
Abstract
Watersheds used for water supply get special attention from managers, as the quantity and quality of supplied water depends on them. Water is an indispensable element of life and a fundamental resource for many human activities. The situation of these watersheds is aggravated by conflicts of land use that end up intensifying the process of erosion and sedimentation of the water reservoirs. In addition, diagnostics that use environmental indicators are important tools for environmental planning. The present study made use of these indicators to evaluate the natural soil susceptibility to erosion in the catchment area of the DNOS water reservoir, in Santa Maria, south of Brazil. Using multi-thematic maps and geoprocessing tools (GIS), we obtained a vulnerability mapping, represented by indexes. This map is an important and skillful tool for territorial planning, for aiding environmental management and conservation of water resources.
Keywords
:
Erosion; Water resources; Sedimentation; Water reservoir
Resumen
Las cuencas hidrográficas utilizadas para el suministro de agua merecen una atención especial de los administradores de los recursos hídricos, ya que la cantidad y calidad del agua suministrada dependen de ellas. La situación de estas cuencas se agrava en función de los conflictos de uso de la tierra que acaban intensificando el proceso de erosión y sedimentación de los reservorios. Además, los diagnósticos que utilizan indicadores ambientales son una importante herramienta para la planificación ambiental. En este sentido, el presente estudio hizo uso de éstos para evaluar la susceptibilidad natural del suelo a la erosión en el área de cobertura de la cuenca de captación del reservorio DNOS, Santa Maria, RS (Brasil). Para ello, usando mapas multitemáticos y geoprocesamiento, se obtuvo el mapeo de vulnerabilidad, representado por índices. El mapa es una importante y hábil herramienta para el ordenamiento territorial, la gestión ambiental y la conservación de los recursos hídricos.
Palabras clave
:
Erosión; Recursos hídricos; Sedimentación; Reservorio
Resumo
Bacias hidrográficas de captação para abastecimento público merecem especial atenção por parte dos gestores dos recursos hídricos, pois delas dependem a quantidade e a qualidade da água, elemento indispensável à sustentabilidade da vida e recurso fundamental para diversas atividades humanas. A situação destas bacias se agrava em função dos conflitos de uso da terra que acabam intensificando o processo de erosão e assoreamento dos reservatórios. Além disso, os diagnósticos que utilizam indicadores ambientais são importante ferramenta para o planejamento ambiental. Neste sentido, o presente estudo fez uso destes para avaliar a suscetibilidade natural do solo à erosão na área de abrangência da bacia de captação do reservatório DNOS, Santa Maria - RS. Para tal, usando mapas multitemáticos e geoprocessamento, obteve-se o mapeamento de vulnerabilidade, representado por índices. O mapa é uma importante e hábil ferramenta para o ordenamento territorial, o auxílio à gestão ambiental e a conservação dos recursos hídricos.
Palavras-chave
:
Erosão; Recursos hídricos; Sedimentação; Reservatório
1 Introduction
The use of environmental indicators in environmental planning allows the inclusion of new alternatives in the management and evaluation of land use and its occupation, especially the indicator of watershed management (SCHUSSEL; NASCIMENTO NETO, 2015SCHUSSEL, Z.; NASCIMENTO NETO, P. Gestão por bacias hidrográficas: do debate teórico à gestão municipal. Ambiente & Sociedade. São Paulo, v. XVIII, n. 3. p. 137-152, 2015.). By adopting the watershed as a territorial unit of planning, we recognize that it is on this area that the anthropogenic actions and the degradation resulting from them reflect their effects (BEVILACQUA, 2012BEVILACQUA, A. F. A bacia hidrográfica como unidade territorial de planejamento e desenvolvimento sustentável. In: Anais... VI Encontro Nacional da ANPPAS, Belém, 2012. Available in: <http://www.anppas.org.br/encontro6/anais/ARQUIVOS/GT9-117-41.pdf>. Accessed on: dezembro de 2017.
http://www.anppas.org.br/encontro6/anais...
).
Soil erosion is one of the main processes involved in its degradation (GUERRA, 2015), considering that land use conflicts intensify this process (CECONI, 2010CECONI, D. E. Diagnóstico e recuperação da mata ciliar da Sanga Lagoão do Ouro na Microbacia Hidrográfica do Vacacaí-Mirim, Santa Maria - RS. 132 f. Tese (Doutorado em Ciência do Solo) - Universidade Federal de Santa Maria, 2010.). Soil, besides being a basic element for economic development, is an elementary natural structure to natural and ecological cycles, given that environmental processes are connected and that soil quality is directly linked to the quality of water resources, biodiversity and human health (RIBEIRO, 2004RIBEIRO, H. Saúde Pública e Meio Ambiente: evolução do conhecimento e da prática, alguns aspectos éticos. Saúde e Sociedade. v.13, n.1, p. 70-80, 2004.; CHAVES; SANTOS, 2009CHAVES, H. M. L.; SANTOS, L. B. Ocupação do solo, fragmentação da paisagem e qualidade da água em uma pequena bacia hidrográfica. Revista Brasileira de Engenharia Agrícola e Ambiental, v.13, (Suplemento), p. 922-930, 2009.).
The challenges of modern society’s progress have always guided the environmental conditions, since those are typical factors of life quality. Anthropic activities of an economic and social nature transform the environment and influence the environmental balance, causing degradation of natural resources (CHAVES; SANTOS, 2009CHAVES, H. M. L.; SANTOS, L. B. Ocupação do solo, fragmentação da paisagem e qualidade da água em uma pequena bacia hidrográfica. Revista Brasileira de Engenharia Agrícola e Ambiental, v.13, (Suplemento), p. 922-930, 2009.). In general, land use reflects the situation of water resources that influences this paradigm.
Farming activities, used in large scale in the Brazilian national economic scenario, with urbanization process in inappropriate places, due to the lack of urban planning and accelerated population growth, act together in the deterioration of rivers and reservoirs, by the production of sediments, through the phenomenon of water erosion (CURVELLO; BATISTA; TARGA, 2008CURVELLO, R. T.; BATISTA, G. T.; TARGA. M. dos S. Estudo dos impactos da ocupação humana na microbacia do rio Batedor na Serra da Mantiqueira no município de Cruzeiro, SP, Brasil. Ambi-Agua, Taubaté, v. 3, n. 1, p. 91-107, 2008.). This environmental impact, besides causing loss of organic matter in the soil, also causes human health problems, difficulties for the public supply sector and damages to plant species communities that perform environmental functions (FERREIRA, et al., 2009FERREIRA, A. B. et al. Análise do meio físico da sub-bacia do Rio Vacacaí-Mirim-RS/Brasil. Revista Geográfica Acadêmica, v. 3, n. 2. p. 28-34, 2009.).
Thereby, this work has as its study area the water catchment area of the reservoir known as DNOS (National Department of Sanitation Works, current DNOCS - National Department of Works Against Drought), belonging to CORSAN (Sanitation Company of the state of Rio Grande do Sul), located in Santa Maria, Rio Grande do Sul. This area is of great importance for the environmental development and, mainly, for the public assistance, being that the reservoir is responsible for about 40% of the supply of water in the city (RODRIGUES; RODRIGUES; FOLETO, 2007RODRIGUES, B. R. C.; RODRIGUES, C. M. C.; FOLETO, E. M. Levantamento de Uso e Conflitos da Terra na Área de Proteção Ambiental (APA) no Rio Vacacaí-Mirim/RS. Anais... XXVII Encontro Nacional de Engenharia de Produção, Foz do Iguaçu, Brasil, 2007. Available in: <http://www.abepro.org.br/biblioteca>. Accessed on: 13 out. 2015.
http://www.abepro.org.br/biblioteca...
). The study area presents inadequate conditions of land use and management, mainly due to urban growth in inappropriate areas and to the development of agricultural activities in disagreement with the soil suitability (DILL, 2002DILL, P. R. J. Assoreamento do reservatório do Vacacaí-Mirim e sua relação com a deterioração da bacia hidrográfica contribuinte. 125 f. Dissertação (Mestrado em Engenharia Civil) - Universidade Federal de Santa Maria, 2002.; CECONI, et al., 2015CECONI, D. E. et al. Avaliação histórica do uso e cobertura da bacia de captação DNOS, Santa Maria - RS, suas consequências e perspectivas. In: KRAMER, G. (Org.). Iniciação científica e de extensão: o seu conhecimento amadurece aqui. Guaíra: UNIPAR, 2015. p. 19 - 27.). In addition, these uses intensify the processes of water erosion.
The importance of the study area and its problematic directs attention to the implementation of actions that aim at the conservation of a public good as important as water. In this sense, environmental planning is an effective tool, as it merges data of diverse characteristics, with the purpose of understanding the territory with a holistic vision, allowing us to understand spatially the problems and organize actions to minimize them (SANTOS, 2004SANTOS, R. F. Planejamento Ambiental: teoria e prática. São Paulo: Oficina de Textos, 2004.; KONRAD, 2005KONRAD, C. G. Zoneamento Ambiental da Microbacia Hidrográfica do Reservatório do DNOS de Santa Maria-RS. 98 f. Dissertação (Mestrado em Geografia) - Universidade Federal de Santa Maria, 2005.; SCHUSSEL; NASCIMENTO NETO, 2015SCHUSSEL, Z.; NASCIMENTO NETO, P. Gestão por bacias hidrográficas: do debate teórico à gestão municipal. Ambiente & Sociedade. São Paulo, v. XVIII, n. 3. p. 137-152, 2015.).
As an instrument for planning, environmental indicators are numbers that represent empirically a parameter for a particular phenomenon (CREPANI et al., 2001CREPANI, E. et al. Sensoriamento remoto e geoprocessamento aplicados ao zoneamento ecológico-econômico e ao ordenamento territorial. INPE: São José dos Campos, 2001. 124 p. ). Due to the factors’ easy application and its dynamics insertion, indexes are notable tools to aid water management and information, and they may also be used to the detriment of some environmental models, which generally require large, complex and costly database (GOMES; MALHEIROS, 2012GOMES, T. C. et al. Caracterização e Espacialização dos Depósitos Tecnogênicos no Bairro Camobi Subsídio ao Planejamento Urbano do Município de Santa Maria - RS. Revista Geonorte, v. 2, n. 4, p. 276 - 288, 2012.). In this context, the vulnerability to erosion index, proposed by Crepani et al. (2001CREPANI, E. et al. Sensoriamento remoto e geoprocessamento aplicados ao zoneamento ecológico-econômico e ao ordenamento territorial. INPE: São José dos Campos, 2001. 124 p. ), is a practical methodology for territorial management, since it is a tool that allows, through an accessible database, to spatially delineate the degree of vulnerability to soil erosion.
As an index-based environmental diagnosis, the method of Crepani et al. (2001CREPANI, E. et al. Sensoriamento remoto e geoprocessamento aplicados ao zoneamento ecológico-econômico e ao ordenamento territorial. INPE: São José dos Campos, 2001. 124 p. ), initially used to subsidize the Ecological and Economic Zoning of the Amazon, is a tool already applied in several studies (RIBEIRO; CAMPOS, 2007RIBEIRO, F. L.; CAMPOS, S. Vulnerabilidade à erosão do solo da região do Alto Rio Pardo, Pardinho, SP. Revista brasileira de engenharia agrícola e ambiental, v. 11, n. 6, p. 628-636, 2007.; MENEZES et al., 2007MENEZES, J. B. et al. Índice de Vulnerabilidade à Erosão para uma Bacia na Mesorregião do São Francisco Pernambucano, a Partir das Relações entre Morfogênese e Pedogênese. Revista Brasileira De Geomorfologia, v. 8, p. 45-56, 2007.; MOTA; VALLADARES, 2011MOTA, L. H. S. O.; VALLADARES, G. S.: Vulnerabilidade à degradação dos solos da Bacia do Acarajú, Ceará. Revista Ciência Agronômica, v. 42, 39-50, 2011.; ARNESEN; MAIA, 2011ARNESEN, A. S.; MAIA, J. S. A. Análise da vulnerabilidade natural à erosão na Bacia Hidrográfica do Rio Tijucas através de técnicas de geoprocessamento: um subsídio à governança territorial. In: Anais... Simpósio Brasileiro de Sensoriamento Remoto, 15, p. 1113-1120. 2011.;DEMARCHI; PISANI; ZIMBACK, 2013DEMARCHI, J. C.; PISANI, R. J.; ZIMBACK, C. R. L. Análise da vulnerabilidade à erosão da sub-bacia do Ribeirão das Perobas por meio de sensoriamento remoto e geoprocessamento. Geografia e Pesquisa, v. 7, n. 1, p. 6-37, 2013.). The authors developed a methodology to create maps of natural vulnerability to soil loss by observing soil interaction with the ecological environment. The methodology was developed from the concept of Ecodynamics of Tricart (TRICART, 1977TRICART, J. Ecodinâmica. Série recursos naturais e meio ambiente. SUPREN/IBGE, 1977, v. 1.), that through an analysis of ecological systems, allows us to study the relationships between the various components of the environment in order to analyze them multilaterally. Its application consists of a rearrangement of the data, so the factors of each theme are connected to a scale of empirical values, that is, indexes. The methodology describes geological, geomorphological and pedological maps, vegetation cover maps (land use) and rainfall intensity curves as thematic components.
Therefore, this work aims to identify the most susceptible sites to the occurrence of water erosion through the elaboration of a map of vulnerability to erosion, for the water catchment area of the DNOS reservoir, in Santa Maria - RS. In order to do so, it was intended to outline the environmentally fragile areas for erosion phenomena and to indicate environmental planning actions, especially regarding the conflicts of land use and occupation and the control of sediment production in the basin.
1.1 Description of the study area
The DNOS reservoir’s water catchment basin covers areas of the municipalities of Santa Maria and Itaara, RS. It has approximately 30 km² of area, being part of the Vacacaí-Mirim and Vacacaí watershed, which are components of the Guaíba watershed (CECONI et al., 2015CECONI, D. E. et al. Avaliação histórica do uso e cobertura da bacia de captação DNOS, Santa Maria - RS, suas consequências e perspectivas. In: KRAMER, G. (Org.). Iniciação científica e de extensão: o seu conhecimento amadurece aqui. Guaíra: UNIPAR, 2015. p. 19 - 27.).
The basin area can be divided into two geomorphological compartments (Plateau and Peripheral Depression) plus a transition area (Plateau Edge) (KONRAD, 2005KONRAD, C. G. Zoneamento Ambiental da Microbacia Hidrográfica do Reservatório do DNOS de Santa Maria-RS. 98 f. Dissertação (Mestrado em Geografia) - Universidade Federal de Santa Maria, 2005.). According to the same author, an altitude of 300 to 480 m characterizes the region of the Plateau. Its reliefs are undulating and smoothly undulating, resulting from fluvial dissection, with the presence of basalts and sandstones. The Peripheral Depression is characterized in a more or less flat and gently undulating region, with hills of rounded form, its formation is constituted by sedimentary rocks; already the Plateau Edge is a transition area between the Plateau and the Peripheral Depression and is characterized by abrupt escarpments and drainage network with dendritic pattern with V-shaped valleys. This drainage flows towards the Peripheral Depression and with its strong action causes progressive erosion and consequent scarification of the escarpment. As for geological units, the watershed is divided into four classes: Serra Geral Superior, Serra Geral Inferior, Botucatu Formation and Caturrita Formation. For the methodological application, the spatial distribution was obtained from the geological chart elaborated by Ferreira et al. (2009FERREIRA, A. B. et al. Análise do meio físico da sub-bacia do Rio Vacacaí-Mirim-RS/Brasil. Revista Geográfica Acadêmica, v. 3, n. 2. p. 28-34, 2009.).
Different uses and types of soil characterize the watershed. More than 50% of its land is occupied by native forest, followed by field areas, which include clean fields, dirty fields and capoeira (medium state of vegetation succession), annual crops and forestry area (eucalyptus) in less quantity, besides urbanized area (SAMUEL-ROSA et al., 2011SAMUEL-ROSA, A. et al. Uso da terra no Rebordo do Planalto do Rio Grande do Sul. Ci. Natura, v. 33, p. 161-173, 2011.).
The soil classes of the study area include: Argissolos, Neossolos, Planossolos, Cambissolos and Luvissolos (MIGUEL, 2010MIGUEL, P. Caracterização Pedológica, Uso da Terra e Modelagem da Perda de Solo em Áreas de Encosta do Rebordo do Planalto do RS. 112 f. Dissertação (Mestrado em Ciência do Solo) - Universidade Federal de Santa Maria. 2010.; CASAGRANDE, 2004CASAGRANDE, L. Avaliação do Parâmetro de Propagação de Sedimentos do Modelo de Williams (1975) na Bacia do Rio Vacacaí-Mirim com o Auxílio de Técnicas de Geoprocessamento. 242 f. Dissertação (Mestrado em Engenharia Civil) - Universidade Federal de Santa Maria, 2004.), of the Brazilian Soil Classification System (EMBRAPA, 2013), and according to the US Soil Taxonomy (approximate equivalent) (SOIL SURVEY STAFF, 2014): Ultisols or low clay activity Alfisols (Argissolos); Entisols (Neossolos); Alfisols and Albic Ultisols (Planossolos); Inceptisols (Cambissolos); and Alfisols or high clay activity Alfisols (Luvissolos). More than 50% of the area is composed of poorly developed soils, such as the Neossolos and Cambissolos, which are usually found in places with higher slopes. These soil types are very susceptible to water erosion. In the areas located to the north of the water catchment basin and in the flatter areas, deeper soils such as Argissolos and Luvissolos are found. The Planossolos are found in places with characteristics of hydromorphism, but they are not very expressive in the study area (MIGUEL et al., 2011).
According to Ceconi et al. (2015CECONI, D. E. et al. Avaliação histórica do uso e cobertura da bacia de captação DNOS, Santa Maria - RS, suas consequências e perspectivas. In: KRAMER, G. (Org.). Iniciação científica e de extensão: o seu conhecimento amadurece aqui. Guaíra: UNIPAR, 2015. p. 19 - 27.), in a study carried out in the same watershed, the use and land cover is with field (15.85%) for livestock, crops with annual crops (21.49%), urbanization (7.49%), including irregular urbanization, next to water courses and in the surroundings of the reservoir. The class vegetation represents 53.49%. This area includes, beyond the forests, the areas in stages of natural regeneration. The areas of the basin occupied by water and exposed soil account for less than 2%.
Due to the environmental importance of the DNOS reservoir’s water catchment area, this basin is the object of several studies on the analysis of erosive effects. In addition to studies on the quantity and quality of water. The land use and occupation in the watershed have influenced the formation of erosion and sedimentation of the reservoir. As shown by Dill (2002DILL, P. R. J. Assoreamento do reservatório do Vacacaí-Mirim e sua relação com a deterioração da bacia hidrográfica contribuinte. 125 f. Dissertação (Mestrado em Engenharia Civil) - Universidade Federal de Santa Maria, 2002.) the reservoir reduced its storage capacity by 29.45%. In relation to the initial design of 1972 there was a reduction of 29-year in its service life. Have indications that the areas that presented conflicts between the current occupation and the potential occupation are responsible for the transport of sediments to the bottom of the reservoir.
Miguel (2010MIGUEL, P. Caracterização Pedológica, Uso da Terra e Modelagem da Perda de Solo em Áreas de Encosta do Rebordo do Planalto do RS. 112 f. Dissertação (Mestrado em Ciência do Solo) - Universidade Federal de Santa Maria. 2010.), making use of the Universal Soil Loss Equation, has calculated the potential for soil losses in part of the DNOS reservoir’s water catchment area in order to create a potential tool to subsidize the land use decision making in that area. Then the author found that 74% of the area has estimates of soil losses ranging from 1 to 2 ton ha-1 per year, with 3% of the area showing high losses (above 20 ton ha-1 per year). The production of solids was also observed by Souza (2012SOUZA, M. M. de. Carga de poluição difusa em bacias hidrográficas com diferentes impactos antrópicos. Santa Maria, Dissertação (Mestrado). UFSM. 2012. ), who at the time observed a total solids production of 376 kg ha-1 year-1.
Bellinaso and Paiva (2007BELLINASO, T. B.; PAIVA, J. DE. Avaliação da produção de sedimentos em eventos chuvosos em uma pequena bacia hidrográfica semi-urbana de encosta. Revista Brasileira de Recursos Hídricos, v. 12, n. 4, p. 169-181, 2007.) have verified the sediment production in an urban area of 0.53 km2 located in the DNOS reservoir’s water catchment basin. In 2001, they observed, after 10 months of observation, that the predominantly urban sub-basin produced 1.4 ton ha-1 of sediment.
2 Material and methods
2.1 Location of study area
The DNOS reservoir’s water catchment basin (Figure 1) is located in the center of the state of Rio Grande do Sul (RS), in southern Brazil, covering areas of Santa Maria and Itaara municipalities, between coordinates 29,61° and 29.71° south latitude and 53.71° and 53.83° west longitude of Greenwich.
LOCALIZATION MAP OF THE DNOS RESERVOIR’S WATER CATCHMENT BASIN, COVERING AREAS OF THE MUNICIPALITIES OF ITAARA AND SANTA MARIA, RS.
2.2 Elaboration of vulnerability map to water erosion
The mapping through indexes, according to the methodology proposed by Crepani et al. (2001CREPANI, E. et al. Sensoriamento remoto e geoprocessamento aplicados ao zoneamento ecológico-econômico e ao ordenamento territorial. INPE: São José dos Campos, 2001. 124 p. ), is a method based on the empirical distribution values for 21 classes of vulnerability to soil loss, distributed according to their susceptibility to erosion scale. The analysis is based on processing, classification and integration of the geological, geomorphological, pedological, vegetative and climatic characteristics. Each characteristic represents a factor of vulnerability. By means of map algebra, equated by the arithmetic mean of all factors, we have the index value for the susceptibility to erosion.
The database for the development of the study included:
-
Digital elevation model (DEM) of topodata project, INPE (2011);
-
Geological map of the DNOS’ catchment basin (FERREIRA et al., 2009FERREIRA, A. B. et al. Análise do meio físico da sub-bacia do Rio Vacacaí-Mirim-RS/Brasil. Revista Geográfica Acadêmica, v. 3, n. 2. p. 28-34, 2009.);
-
Soil maps (MIGUEL, 2010MIGUEL, P. Caracterização Pedológica, Uso da Terra e Modelagem da Perda de Solo em Áreas de Encosta do Rebordo do Planalto do RS. 112 f. Dissertação (Mestrado em Ciência do Solo) - Universidade Federal de Santa Maria. 2010.; CASAGRANDE, 2004CASAGRANDE, L. Avaliação do Parâmetro de Propagação de Sedimentos do Modelo de Williams (1975) na Bacia do Rio Vacacaí-Mirim com o Auxílio de Técnicas de Geoprocessamento. 242 f. Dissertação (Mestrado em Engenharia Civil) - Universidade Federal de Santa Maria, 2004.);
-
Landsat8 satellite image, dated June 15, 2015, from the USGS (US Geological Survey) website;
-
Rainfall data from station 2953017 of the Brazilian National Water Agency, located in Santa Maria - RS
The methodological procedure was elaborated in the Geographic Information System (GIS) Arcgis/Arcmap 10.1 to obtain the indexes for the erosion susceptibility of each factor.
2.2.1 Geomorphological Factor
For the evaluation of the erosion vulnerability index for the Geomorphology factor, it was necessary to analyze the three constituent parameters: altimetric amplitude, relief’s degree of dissection by drainage and slope. According to Crepani et al. (2001CREPANI, E. et al. Sensoriamento remoto e geoprocessamento aplicados ao zoneamento ecológico-econômico e ao ordenamento territorial. INPE: São José dos Campos, 2001. 124 p. ), the relief dissection by drainage can be determined by the width of the interflux or by the drainage density. So, it was used DEM processing for the execution in GIS of the Geomorphology factor.
The slope was obtained by processing, in percentage, using the DEM in GIS algorithm. The ratio of indexes was assigned in view of the upper limit of 45° of slope, because in this situation there is morphogenesis process, occurring exposure of rocky material to which the value 3.0 is attributed. The indexes were defined by reclassifying pixels from the slope file, grouping them according to the tabulated indexes proposed by Crepani et al. (2001CREPANI, E. et al. Sensoriamento remoto e geoprocessamento aplicados ao zoneamento ecológico-econômico e ao ordenamento territorial. INPE: São José dos Campos, 2001. 124 p. ). The pixel grouping forms the landscape units that have been converted to vector format and indexes values were included in the attribute table.
For the distribution of the altimetric amplitude and drainage density data, it was necessary to segment the watershed into sub-basins. This process delimits plots (sub-basins) as a function of the vectorial representation of water resources through a computational routine that uses a mathematical representation of direction and accumulation of flow, which together with the relief information allowed to delimit the plots. This stage of sectorization is not a methodological determination, but rather a procedure that aims at a better distribution of the characteristics of the watershed.
The length of the drainage channels was determined by the specific contribution area estimated through the ratio of flows Q90/Q50. This value has a significant correlation with the representation of the real dimension of the drainage channel (FAN et al., 2013FAN, F. M. et al. Sobre o início da rede de drenagem definida a partir dos modelos digitais de elevação. Revista Brasileira de Recursos Hídricos. v. 18, n. 3. p. 241-257, 2013.). To estimate the specific contribution area the ANA fluviometric station, code 85438000, was used as a base. This station is located in the Vacacaí-Mirim river basin in the city of Restinga Seca (RS), belonging to the same water course, downstream of the study area. This relation informs the minimum drainage area as the initial criterion, rising the minimum number of pixels to form the drainage channel. The data allowed the calculation of Q90 and Q50 through the construction of the retention curve, using the empirical methodology for 25 flows class intervals, obtaining values of 4.5 s-1 m3 and 22 m3 s-1, respectively, he ratio Q90/Q50 being equal to 0.20. Therefore, according to Fan et al. (2013FAN, F. M. et al. Sobre o início da rede de drenagem definida a partir dos modelos digitais de elevação. Revista Brasileira de Recursos Hídricos. v. 18, n. 3. p. 241-257, 2013.), the minimum drainage area is set at 0.3 km2.
To represent the altimetric amplitude for each sub-basin, the pixels of higher and lower values were verified, the difference between them being the amplitude. The values are classified quantitatively in view of the potential energy available in each region, as the rainfall falling on the highest points of the river basin will acquire greater kinetic energy along the path of its course towards the lower parts and, consequently, it will have greater capacity to cause erosion.
To obtain the drainage density, an intersection of the vector layer of sub-basins with the line representing the water resources was necessary. This makes it possible to stipulate the relation between the drainage area and the length of the drainage channel through GIS calculation using the attribute table. Thus, the calculated values are selected according to their magnitude and related to the adapted index value based on the qualitative classification of Florenzano (2008FLORENZANO, T. G. Cartografia. Geomorfologia: conceitos e tecnologias atuais. São Paulo: Oficina de Textos. p. 105-128, 2008.). This author considers drainage density to be very low (less than 0.5 km), low (between 0.5 and 3.0 km), medium (between 3.0 and 6.0 km), high (between 6.0 a 10 km) and very high (greater than 10 km).The indexes for the drainage density sub-factor, as not specified by the methodology, follow a qualitative relation according to Table 1
Finally, the index of susceptibility to erosion for the geomorphological factor is measured using GIS by map algebra following Equation 1:
At where: R is the value of the geomorphological index, Gd is the susceptibility index for the degree of dissection by drainage, A is the altimetric amplitude and D is the slope.
In order to inference the degree of stability or vulnerability, Crepani et al. (2001CREPANI, E. et al. Sensoriamento remoto e geoprocessamento aplicados ao zoneamento ecológico-econômico e ao ordenamento territorial. INPE: São José dos Campos, 2001. 124 p. ) grouped the indexes according to the following classification: stable (index range 1.0 to 1.3); moderately stable (from 1.4 to 1.7); medium vulnerable (from 1.8 to 2.2); moderately vulnerable (from 2.3 to 2.6); and vulnerable (from 2.7 to 3.0).
2.2.2 Geological Factor
For the geology factor, the characteristics analyzed by the methodology for the attribution of the empirical values are the resistance of the rocks to the denudation and the degree of cohesion of the constituent particles of the rocks. The level of molecular bonding (cohesion) of each type of rock defines the characteristics of the erosive process. According to Crepani et al. (2001CREPANI, E. et al. Sensoriamento remoto e geoprocessamento aplicados ao zoneamento ecológico-econômico e ao ordenamento territorial. INPE: São José dos Campos, 2001. 124 p. ) erosive processes (morphogenesis) prevail in little cohesive rocks, with values close to 3.0, while in very cohesive rocks the processes of weathering and soil formation (pedogenesis) prevail, being assigned values close to 1.0.
The geology factor was defined, then, by the geological chart of Ferreira et al. (2009FERREIRA, A. B. et al. Análise do meio físico da sub-bacia do Rio Vacacaí-Mirim-RS/Brasil. Revista Geográfica Acadêmica, v. 3, n. 2. p. 28-34, 2009.) which was georeferenced and scanned (in vector format). The indexes for this factor were attributed according to the values proposed by Crepani et al. (2001CREPANI, E. et al. Sensoriamento remoto e geoprocessamento aplicados ao zoneamento ecológico-econômico e ao ordenamento territorial. INPE: São José dos Campos, 2001. 124 p. ) to the vector map of the geological units following their lithological characteristics.
According to Veiga (1973) apud Gomes et al. (2012GOMES, T. C. et al. Caracterização e Espacialização dos Depósitos Tecnogênicos no Bairro Camobi Subsídio ao Planejamento Urbano do Município de Santa Maria - RS. Revista Geonorte, v. 2, n. 4, p. 276 - 288, 2012.), the Botucatu formation presents as dominant lithology the medium to fine sandstones (index value 2.4). Faccini, Giardin and Machado (2003FACCINI, U. F.; GIARDIN, A.; MACHADO, J. L. F. Heterogeneidades litofaciológicas e hidroestratigrafia do Sistema Aquífero Guarani na região central do estado do Rio Grande do Sul, Brasil. Geometria, arquitetura e heterogeneidades de corpos sedimentares-estudos de casos. Edição PPGeo-UNISINOS - Editora Unisinos. p. 147-173, 2003.), describe that the Caturrita formation is basically formed by fine sandstones (index 2.4). The Serra Geral Superior Formation is characterized by quartz-porphyry (index 1.1) and Serra Geral Inferior Formation is composed of basalts-andesites tholeiitic (index 1.5) (MACIEL FILHO, 1990MACIEL FILHO, C. L. Carta Geotécnica de Santa Maria. Imprensa Universitária-UFSM, 1990.).
2.2.3 Soil Factor
The soil map was elaborated from the digitization of the pedological map of Miguel (2010MIGUEL, P. Caracterização Pedológica, Uso da Terra e Modelagem da Perda de Solo em Áreas de Encosta do Rebordo do Planalto do RS. 112 f. Dissertação (Mestrado em Ciência do Solo) - Universidade Federal de Santa Maria. 2010.), in a scale of 1:30000, which represents the soils of the upper part of the DNOS reservoir’s water catchment area (approximately 60% of the area). It was complemented with the pedological information of the map of Casagrande (2004CASAGRANDE, L. Avaliação do Parâmetro de Propagação de Sedimentos do Modelo de Williams (1975) na Bacia do Rio Vacacaí-Mirim com o Auxílio de Técnicas de Geoprocessamento. 242 f. Dissertação (Mestrado em Engenharia Civil) - Universidade Federal de Santa Maria, 2004.), in scale 1:100000, elaborated for the Vacacaí-Mirim watershed, of which DNOS’ is a sub-basin.
The methodology proposes classes of vulnerability to erosion for the pedology factor as a function of soil maturity, considering the degree of development of it. A value of 1.0 is given for developed and deep soils, that is, less susceptible to erosion. A value 2.0 is given for soils of intermediate vulnerability. Moreover, indexes close to 3.0 are given to more vulnerable soils, that is, young and underdeveloped soils. The soil classes of the study area include Argissolos (index value 2.0), Neossolos (3.0), Planossolos (2.0), Cambissolos (2.5) and Luvissolos (2.0).
2.2.4 Vegetation Factor
The vegetation density of the natural landscape unit is a protective factor against the morphogenetic processes that result in the form of erosion. The vegetation cover density defines the vegetation factor. The interpretation of satellite images is used to define the land occupation in order to assign the degree of vulnerability, and values of 1.0, 2.0 and 3.0 are assigned for high, intermediate and low densities, respectively.
Aiming to assign the index values to the vegetation factor, it was used an image of the Landsat8 satellite, dated June 15, 2015, positioned under orbit 223 and point 80, made available by the USGS site. The classification was elaborated considering the classes: soil exposed (index value 3.0), urbanization (2.0), forest (1.0), water (1.0), agriculture (2.5) and pasture (2.0), using maximum likelihood classifier algorithm. The values of indexes attributed to the vegetation class follow the qualification of the proposal regarding the density of vegetation cover. For the urbanization class, it is considered a moderate level due to the waterproofing of the terrain.
2.2.5 Climate Factor
For the climate factor, the natural landscape units that have the lowest monthly rainfall and longer duration for the rainy season receive values close to 1.0. The intermediate pluviometric indexes are around 2.0, and those with the highest annual rainfall with the lowest rainy season duration, have values close to 3.0.
The mapping of rainfall distribution in the region was obtained based on rainfall data from the Brazilian National Water Agency (ANA), on the surroundings of the study river basin, with more than 15 years of continuous data and a distribution of the values by the inverse of the square distance (BARBOSA, 2006BARBOSA, J. P. M. Utilização de método de interpolação para análise e espacialização de dados climáticos: o SIG como ferramenta. Caminhos da Geografia (UFU), v. 9, n. 17, p. 85-96, 2006.).
For Santa Maria, the highest monthly average is 184.06 mm for the month of July, with the respective index being 1.6 on the susceptibility scale. This value is used for the whole basin considering the degree of local pluviometric homogeneity.
3 Results and discussion
The study area has an average of annual precipitation around 1750 mm. The monthly average rainfall monitored at the station of Santa Maria, code 2953017, with 15 years of discontinuous data, since 1975, ranging from 123.14 mm for the month of March up to 184.06 mm for the month of July.
As the ratio Q90/Q50 was 0.20, a minimum drainage area of 0.3 km² was adopted, as estimated by Fan et al. (2013FAN, F. M. et al. Sobre o início da rede de drenagem definida a partir dos modelos digitais de elevação. Revista Brasileira de Recursos Hídricos. v. 18, n. 3. p. 241-257, 2013.). With this standard, the outlined areas of contribution totaled 56 divisions for the extension of the DNOS reservoir’s water catchment basin varying from 1 to 151 hectares. The low amount of used data influences the quality of the permanence value and, consequently, the ratio Q90/Q50. However, due to the low sensitivity of this factor for the design of the contribution and extension areas of the drainage network, the value is considered adequate.
The indexes assigned to the sub-factors slope, drainage density and altimetric amplitude are shown in Figure 2. It is noticed that there are areas with marked slope in the basin under study, which makes it more susceptible to water erosion. According to Bertoni and Lombardi Neto (2012BERTONI, J.; LOMBARDI NETO, F. Conservação do solo. 5. ed. São Paulo: Ícone, 2012. 355 p.), erosion is caused by active forces such as rainfall characteristics, land slope, its length, and the soil’s capacity to absorb water, and by passive forces such as soil resistance to the erosive action of water and the density of the vegetation cover. These factors are taken into account in the methodology for estimating erosion susceptibility indexes.
INDEXES FOR SLOPE, DRAINAGE DENSITY AND ALTIMETRIC AMPLITUDE FACTORS FOR THE DNOS RESERVOIR’S WATER CATCHMENT BASIN.
On the maps erosion vulnerability areas with an index equal to 1.0 can be observed in the flat areas along the watercourses, at the top of the basin and near the DNOS reservoir. As well as areas of strong relief corrugated to steep in the medium and low slopes, where the velocity of the runoff is higher and the erosion vulnerability index for the factor is close to 3.0. By the description of the areas and considering the Brazilian Forest Code (Law nº. 12.651, of May 25, 2012), we can see that these are permanent preservation areas (PPAs).This law includes the marginal ranges of water bodies covered or not by native vegetation such as PPAs, with the environmental function of preserving water resources, landscape, geological stability, biodiversity, the gene flow of fauna and flora, protecting the soil and to ensure the well being of human, animal and plant populations (BRASIL, 2012).
PPAs play an important role in watershed. In the case of the DNOS reservoir’s water catchment area, there are numerous conflicts in these areas, and the PPAs are preserved only in more rugged relief conditions, which makes it difficult to occupy. There are also numerous properties, such as farms, that use the soil with agriculture and livestock (SAMUEL-ROSA et al., 2011SAMUEL-ROSA, A. et al. Uso da terra no Rebordo do Planalto do Rio Grande do Sul. Ci. Natura, v. 33, p. 161-173, 2011.) and there are buildings just a few meters from the riverbank (MIGUEL, 2014MIGUEL, P. et al. Identificação de fontes de produção de sedimentos em uma bacia hidrográfica de encosta. Revista Brasileira de Ciência do Solo, v. 38, n. 2, p. 585-598, 2014.). According to Miguel et al. (2011MIGUEL, P. et al. A. Solo e dinâmica de ocupação das terras em áreas do rebordo do planalto do Rio Grande do Sul. R. Bras. Agroci., v. 17, p. 447-455, 2011.), the land use conflicts are concentrated closer to the reservoir, where the anthropic use is denser, with occupancy problems.
The result of map algebra with the average of the sub-factors that represent the erosion susceptibility index for the geomorphology factor is shown in Figure 3, which also presents the results for the other factors considered.
EROSION SUSCEPTIBILITY INDEX FOR THE GEOMORPHOLOGY (A), GEOLOGY (B), PEDOLOGY (C) AND VEGETATION (D) FACTORS IN THE DNOS RESERVOIR’S WATER CATCHMENT BASIN.
Considering de geomorphology factor, it can be seen, in Figure 3, that most of the area of the DNOS reservoir’s water catchment basin presents indexes around 2.0 for natural vulnerability of the soil to the erosion. Of the total area, 3.28% are classified as stable, 13.01% as moderately stable, 62.11% as medium vulnerable, 21.46% as moderately vulnerable and 0.14% as vulnerable.
More than 80% of the basin area has indexes above 1.8 in terms of susceptibility to erosion, which is undesirable, considering the morphometric information used and that are related to the shape of relief of the landscape unit. It can be inferred that the potential energy available for the surface runoff is high in the DNOS reservoir’s water catchment basin, that is, the morphogenetic processes prevail (CREPANI et al., 2001CREPANI, E. et al. Sensoriamento remoto e geoprocessamento aplicados ao zoneamento ecológico-econômico e ao ordenamento territorial. INPE: São José dos Campos, 2001. 124 p. ).
The geomorphological indexes of a geographic unit must be taken into account by public managers, both with regard to possible risk areas for urban occupation, and for the use of conservationist practices in the land use and occupation. This, in order to reduce the negative environmental impacts resulting from water erosion, such as loss of soil in agriculture and in livestock areas, silting up watercourses and reservoirs, among other factors.
This would in some way mitigate the negative effects of water erosion on the DNOS catchment, such as those observed by Dill (2002DILL, P. R. J. Assoreamento do reservatório do Vacacaí-Mirim e sua relação com a deterioração da bacia hidrográfica contribuinte. 125 f. Dissertação (Mestrado em Engenharia Civil) - Universidade Federal de Santa Maria, 2002.), who verified a reduction of almost 30% in the storage capacity of the DNOS reservoir due to the sedimentation of the same. The production of sediments in the study area was also verified by Bellinaso e Paiva (2007BELLINASO, T. B.; PAIVA, J. DE. Avaliação da produção de sedimentos em eventos chuvosos em uma pequena bacia hidrográfica semi-urbana de encosta. Revista Brasileira de Recursos Hídricos, v. 12, n. 4, p. 169-181, 2007.) in sub-basin of predominantly urban use, and by Souza (2012SOUZA, M. M. de. Carga de poluição difusa em bacias hidrográficas com diferentes impactos antrópicos. Santa Maria, Dissertação (Mestrado). UFSM. 2012. ), who have observed,1.4 t ha-1 (in 10 months) and 376 kg ha-1 year-1, respectively.
Figure 3b is the result of the assignment of the index values to the geological chart of the basin and it represents the erosion susceptibility indexes for the geology factor in the study area. Considering the relation between the values attributed and the resistance of the rocks to the denudation as well as the degree of cohesion of the constituent particles of the rocks, it can be inferred that the Serra Geral Superior Formation is less vulnerable to water erosion (index 1.1), followed by the Serra Geral Inferior Formation (index 1.5). The Botucatu and Caturrita Formations both have an index value equal to 2.4, which means that those are more susceptible to water erosion
Figure 3c shows the susceptibility indexes attributed to the pedology factor. It is observed that there is discontinuity in the information available on the soils of the watershed, related to the different scales of the maps used. Despite the variation in the level of detail of the information available, both scales allowed mapping the vulnerability of the basin considering the soil factor. It is possible to observe that the highest indexes occurred in the most prominent areas, precisely where the soils most susceptible to water erosion are found, such as the Neossolos, confirming what was observed in the studies of Miguel et al. (2011MIGUEL, P. et al. A. Solo e dinâmica de ocupação das terras em áreas do rebordo do planalto do Rio Grande do Sul. R. Bras. Agroci., v. 17, p. 447-455, 2011.; 2014).
Due to the soil classes that occur in the watershed area, all indexes were higher than 2.0. The need for a land use planning that respects its capacity of use is emphasized, since the major contributions in the production of sediments come from the superficial erosion of the soil (MIGUEL et al., 2014MIGUEL, P. et al. Identificação de fontes de produção de sedimentos em uma bacia hidrográfica de encosta. Revista Brasileira de Ciência do Solo, v. 38, n. 2, p. 585-598, 2014.). In this sense, the authors concluded that adequate management systems, maintenance of soil cover and systems with the lowest possible soil revolving show a significant result in the reduction of sediment production rates in the area. According to the same authors, the roads are potential sources of erosion; therefore, the correct allocation and proper maintenance reflect important impact on the reduction of sediment production.
Figure 3d represents the distribution of index values for the vegetation factor in the study area. It can be seen that the highest indexes are attributed to the most intense classes of use, such as urbanization, crops and exposed soil. On the other hand, the lowest indexes are assigned to the forest and water class.
Ceconi et al. (2015CECONI, D. E. et al. Avaliação histórica do uso e cobertura da bacia de captação DNOS, Santa Maria - RS, suas consequências e perspectivas. In: KRAMER, G. (Org.). Iniciação científica e de extensão: o seu conhecimento amadurece aqui. Guaíra: UNIPAR, 2015. p. 19 - 27.), evaluating the history of land use and occupation in the watershed of the present study and aiming to diagnose the possible causes of degradation and propose measures of environmental restoration, verified conflicts of land use. The conflicts were observed mainly along the waterways and around the DNOS reservoir, including irregular urban occupations, areas that should be covered only by the class “forest”, since they are permanent preservation areas. In addition, uses with “crop” and “field” classes, which represent agriculture and livestock in the basin, are poorly managed and in most areas do not make use of soil conservation practices. This increases erosion and, consequently, sedimentation and eutrophication of watercourses. Being that this situation is not recent but comes from decades.
The use of agricultural water in the Vacacaí-Mirim watershed, mainly for rice cultivation, has affected the amount of water to the point of influencing its ecological flow (PAIVA; PAIVA; PAIVA, 2006PAIVA, R. C.; PAIVA, E. M.; PAIVA, J. B. D. Estimativa das Vazões Naturais nas Sub-Bacias do Vacacaí-Mirim através de Modelo Simplificado. In: Anais... I Simpósio de Recursos Hídricos do Sul-Sudeste, 2006. ). The authors have shown, through a simplified model distributed in sub-basins, that the demands for irrigation of rice plantations are much higher than the available flows during periods of drought. Among the sub-basins studied are those that supply the DNOS reservoir, which are in the upper part of the Vacacaí-Mirim basin. This is where, due to more rugged relief conditions, the use by agriculture is not so intense, prevailing small farms (CECONI et al., 2015CECONI, D. E. et al. Avaliação histórica do uso e cobertura da bacia de captação DNOS, Santa Maria - RS, suas consequências e perspectivas. In: KRAMER, G. (Org.). Iniciação científica e de extensão: o seu conhecimento amadurece aqui. Guaíra: UNIPAR, 2015. p. 19 - 27.), which in a way reduces the impact on the reservoir and allows the abstraction of water for public supply. During prolonged periods of drought, the water supply from the DNOS reservoir decreases and is complemented by another larger reservoir, which regularly supplies about 60% of the city of Santa Maria.
The irregular occupation of the water catchment basins, according to Curvello et al. (2008CURVELLO, R. T.; BATISTA, G. T.; TARGA. M. dos S. Estudo dos impactos da ocupação humana na microbacia do rio Batedor na Serra da Mantiqueira no município de Cruzeiro, SP, Brasil. Ambi-Agua, Taubaté, v. 3, n. 1, p. 91-107, 2008.), as well as the implantation of agricultural activities with inappropriate techniques and methods, affect the quality of the sources by the competitive use of the water and nutrients, besides impelling the deforestation in areas of slopes, sources and margins. These land uses and occupation also increase the risk of slipping, since the suppression of the native forest causes the speed of the drainage of rainwater to be increased. This causes gullies and silting of riverbeds and streams, as well as endangering the lives of the local population.
Therefore, ensuring the continuity of riparian forest, the banks of rivers and streams, helps to produce more water, and a lower cost of treatment for sanitation and water supply companies. This view dismantles the notion that making an investment in nature conservation does not generate profit and it shows, in fact, the damage we have with the degradation of the areas of a watershed (CECONI et al., 2015CECONI, D. E. et al. Avaliação histórica do uso e cobertura da bacia de captação DNOS, Santa Maria - RS, suas consequências e perspectivas. In: KRAMER, G. (Org.). Iniciação científica e de extensão: o seu conhecimento amadurece aqui. Guaíra: UNIPAR, 2015. p. 19 - 27.). In this sense, it is recommended to recover of the DNOS reservoir’s basin, mainly in the surroundings of the water reservoir, involving for that the population there installed and taking actions to avoid the continuation of the irregular occupations.
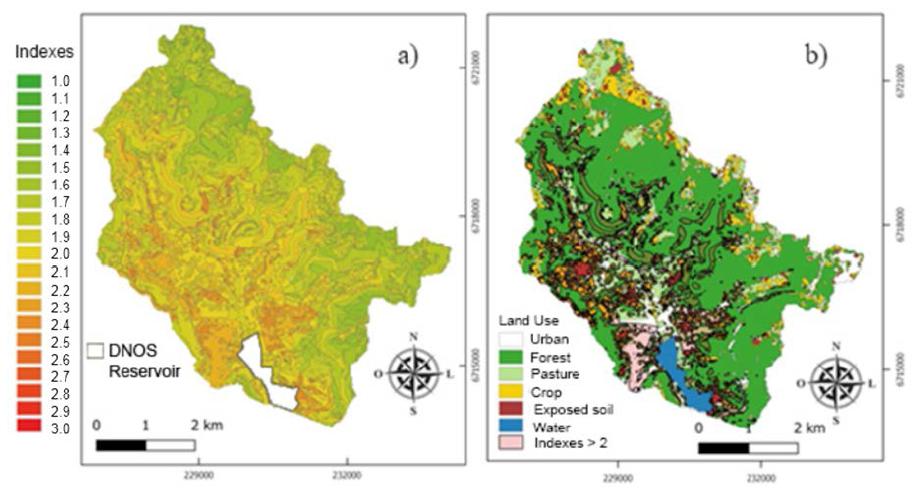
The result of the map algebra of index values attributed to the factors is shown in Figure 4a. It represents the erosion susceptibility index for the DNOS water catchment basin, that is, the main result of the present study. Figure 4b, highlights the most vulnerable areas on the use map.
The result of the mapping indicated that 27.51% of the area is moderately stable in terms of erosion susceptibility, 68.11% is medium vulnerable and 4.38% is in the moderately vulnerable range. It can be noticed that the values for susceptibility to erosion were concentrated in the medium vulnerable class and there is a notable influence of the geology factor, a result that is in agreement with other studies that applied the same methodology (ARRUDA; DIAS; PEREIRA, 2007ARRUDA, W. C.; DIAS, R.; PEREIRA, E. Análise da Vulnerabilidade Natural à Perda de Solo do Município de Fátima-TO. Simpósio Brasileiro de Sensoriamento Remoto, 2007. v. 13, p. 5083-5089.; ARNESEN; GENOFRE; CURTARELLI, 2009ARNESEN, A. S.; GENOFRE, F. T.; CURTARELLI, M. P. Análise da vulnerabilidade à erosão através de SIG: um subsídio ao zoneamento ecológico-econômico de Santo Amaro da Imperatriz/SC. In: Anais... XVIII Simpósio Brasileiro de Recursos Hídricos, 2009. Available in: <http://www.gthidro.ufsc.br/arquivos/An%C3%A1lise_Vul_Eros%C3%A3o1.pdf>. Accessed on: 12 out. 2015.
http://www.gthidro.ufsc.br/arquivos/An%C...
; DEMARCHI; PISANI; ZIMBACK, 2013DEMARCHI, J. C.; PISANI, R. J.; ZIMBACK, C. R. L. Análise da vulnerabilidade à erosão da sub-bacia do Ribeirão das Perobas por meio de sensoriamento remoto e geoprocessamento. Geografia e Pesquisa, v. 7, n. 1, p. 6-37, 2013.). In the index map, where there is a low level of detail in the soil map, in the scale 1: 100000, there was influence in the index values in the vicinity of the reservoir, precisely the area of greatest interest for the actions aiming at territorial planning, given its importance for the public supply of Santa Maria.
EROSION SUSCEPTIBILITY INDEX (a) AND LAND USE MAP (b), HIGHLIGHTING THE MOST VULNERABLE AREAS (INDEXES > 2) IN THE DNOS RESERVOIR’S WATER CATCHMENT AREA.
From the obtained mapping, one can inferred that the mapping indicates the most susceptible areas to erosion. This fact was confirmed by studies carried out previously in the area of catchment of the DNOS reservoir, which were presented during the discussion of the results of the mapping of environmental factors considered. In addition, the mapping allowed verifying that a digital database structured in GIS allows a greater agility, effectiveness and the possibility of updating the information. This facilitates the obtaining of subsidies in an organized way for the municipal executive power, in the elaboration of municipal plans, programs and projects of agricultural and urban development.
Also, as pointed out by Arruda, Dias e Pereira (2007ARRUDA, W. C.; DIAS, R.; PEREIRA, E. Análise da Vulnerabilidade Natural à Perda de Solo do Município de Fátima-TO. Simpósio Brasileiro de Sensoriamento Remoto, 2007. v. 13, p. 5083-5089.), a data base gives the conditions of continuity of the studies of land use and land use planning of watersheds, with the planning or reordering of rural and urban activities. In this case, maps of environmental factors should be elaborated in vulnerability mappings with the harmonization of units to reduce the number of spurious polygons when map combinations (overlap), and then allow a better understanding of the interrelations of the landscape components
Figure 4b shows the most susceptible areas to erosion, with susceptibility indexes higher than 2.0. This is an indicative of the occurrence of morphogenesis, superimposed on the map of use and occupation. Through this, it is possible to point out that land uses in the most fragile areas for erosion are areas of cultivation and urbanization. These areas mainly comprise the banks and surroundings of the watercourses and the DNOS reservoir, due to the need of water, but mainly due to the less rugged relief condition.
These areas, characterized as areas of conflict of use, are potential sources of erosion and can contribute to sedimentation of the reservoir. Because of this, such areas require conservation practices and land use restrictions aiming at improving water quality. In this sense, it is vitally important to these areas to be submitted to the restoration of the native vegetation, especially near the water’s edge and around the reservoir. Such practice, besides contributing to environmental improvements, will contribute to the production of water in quantity and quality.
For guarantees of agricultural productivity, the cultivation areas should also have as guidelines, soil conservation practices, mainly those of a mechanical character (BERTONI; LOMBARDI NETO, 2012BERTONI, J.; LOMBARDI NETO, F. Conservação do solo. 5. ed. São Paulo: Ícone, 2012. 355 p.). Irregular urbanization around the reservoir, the main land use conflict, requires drastic social and economic strategies and actions. This could be done with public management initiatives, such as the relocation of the irregular population to improve the environmental conditions in the watershed under study.
In addition to the irregular land occupations, the lack of basic sanitation, sewage treatment and an adequate management of solid waste, end up making water quality even worse. In this sense, Bandeira, Nunes e Lima (2016BANDEIRA, A. P. N.; NUNES, P. H. de S.; LIMA, M. G. de S. Gerenciamento de riscos ambientais em municípios da região metropolitana do Cariri (Ceará). Ambiente &Sociedade. São Paulo, v. XIX, n. 4, p. 65-84, 2016.) affirm that knowledge of urban problems is fundamental for the planning of management strategies and that knowing where to find the areas of risk and their size is the first step in decision making, thus, the mapping of susceptibility becomes an important tool.
4 Conclusions
The map of susceptibility to erosion represents an important tool for environmental diagnosis, since it facilitates the obtaining of information for the management aiming at the performance of time and resources. In addition, the index map is an effective instrument for territorial planning, since it has the capacity to point out conflicts of use and to direct techniques for the containment of soil losses and, consequently, to reduce the production of sediments.
The erosion susceptibility’s index map is a potential tool for environmental management and conservation of water resources. This is achieved by means of a robust and easy-to-execute technique, however, being limited the quality of the thematic maps used and the degree of detail resulting.
Although the vegetation cover represents more than 50% of the land use and occupation in the DNOS reservoir’s water catchment area, it should be even bigger. This is due to the environmental relevance of the watershed in question, because of its importance in the catchment of water for human supply and considering its location, not only of its relief, but also as regards native vegetation, because it is characteristic of the Atlantic Forest vegetation, it’s necessary to preservation.
For a more satisfactory representation of soil fragility to erosion, it is suggested an analysis of the factors’ weights of the presented method, in order to further discretize the values of indexes. Hierarchical analyzes of importance of factors, common in the use of indexes, appear in the literature as an option.
Acknowledgments:
CNPq, CAPES and FAPERGS for financial support for research.
5 References
- ANA. Agência Nacional das Águas. Hidroweb: Sistemas de informações hidrológicas. Available in: <http://hidroweb.ana.gov.br>. Accessed on: 11 de nov. de 2015.
» http://hidroweb.ana.gov.br - ARNESEN, A. S.; MAIA, J. S. A. Análise da vulnerabilidade natural à erosão na Bacia Hidrográfica do Rio Tijucas através de técnicas de geoprocessamento: um subsídio à governança territorial. In: Anais... Simpósio Brasileiro de Sensoriamento Remoto, 15, p. 1113-1120. 2011.
- ARNESEN, A. S.; GENOFRE, F. T.; CURTARELLI, M. P. Análise da vulnerabilidade à erosão através de SIG: um subsídio ao zoneamento ecológico-econômico de Santo Amaro da Imperatriz/SC. In: Anais... XVIII Simpósio Brasileiro de Recursos Hídricos, 2009. Available in: <http://www.gthidro.ufsc.br/arquivos/An%C3%A1lise_Vul_Eros%C3%A3o1.pdf>. Accessed on: 12 out. 2015.
» http://www.gthidro.ufsc.br/arquivos/An%C3%A1lise_Vul_Eros%C3%A3o1.pdf - ARRUDA, W. C.; DIAS, R.; PEREIRA, E. Análise da Vulnerabilidade Natural à Perda de Solo do Município de Fátima-TO. Simpósio Brasileiro de Sensoriamento Remoto, 2007. v. 13, p. 5083-5089.
- BANDEIRA, A. P. N.; NUNES, P. H. de S.; LIMA, M. G. de S. Gerenciamento de riscos ambientais em municípios da região metropolitana do Cariri (Ceará). Ambiente &Sociedade. São Paulo, v. XIX, n. 4, p. 65-84, 2016.
- BARBOSA, J. P. M. Utilização de método de interpolação para análise e espacialização de dados climáticos: o SIG como ferramenta. Caminhos da Geografia (UFU), v. 9, n. 17, p. 85-96, 2006.
- BELLINASO, T. B.; PAIVA, J. DE. Avaliação da produção de sedimentos em eventos chuvosos em uma pequena bacia hidrográfica semi-urbana de encosta. Revista Brasileira de Recursos Hídricos, v. 12, n. 4, p. 169-181, 2007.
- BERTONI, J.; LOMBARDI NETO, F. Conservação do solo. 5. ed. São Paulo: Ícone, 2012. 355 p.
- BEVILACQUA, A. F. A bacia hidrográfica como unidade territorial de planejamento e desenvolvimento sustentável. In: Anais... VI Encontro Nacional da ANPPAS, Belém, 2012. Available in: <http://www.anppas.org.br/encontro6/anais/ARQUIVOS/GT9-117-41.pdf>. Accessed on: dezembro de 2017.
» http://www.anppas.org.br/encontro6/anais/ARQUIVOS/GT9-117-41.pdf - BRASIL. Lei nº 12.651, de 25 de maio de 2012. Dispõem sobre a Proteção da Vegetação Nativa. Available in: <http://www.planalto.gov.br/ccivil_03/_ato2011-2014/2012/lei/l12651.htm>. Accessed on: dezembro de 2017.
» http://www.planalto.gov.br/ccivil_03/_ato2011-2014/2012/lei/l12651.htm - CASAGRANDE, L. Avaliação do Parâmetro de Propagação de Sedimentos do Modelo de Williams (1975) na Bacia do Rio Vacacaí-Mirim com o Auxílio de Técnicas de Geoprocessamento. 242 f. Dissertação (Mestrado em Engenharia Civil) - Universidade Federal de Santa Maria, 2004.
- CECONI, D. E. Diagnóstico e recuperação da mata ciliar da Sanga Lagoão do Ouro na Microbacia Hidrográfica do Vacacaí-Mirim, Santa Maria - RS. 132 f. Tese (Doutorado em Ciência do Solo) - Universidade Federal de Santa Maria, 2010.
- CECONI, D. E. et al. Avaliação histórica do uso e cobertura da bacia de captação DNOS, Santa Maria - RS, suas consequências e perspectivas. In: KRAMER, G. (Org.). Iniciação científica e de extensão: o seu conhecimento amadurece aqui. Guaíra: UNIPAR, 2015. p. 19 - 27.
- CHAVES, H. M. L.; SANTOS, L. B. Ocupação do solo, fragmentação da paisagem e qualidade da água em uma pequena bacia hidrográfica. Revista Brasileira de Engenharia Agrícola e Ambiental, v.13, (Suplemento), p. 922-930, 2009.
- CREPANI, E. et al. Sensoriamento remoto e geoprocessamento aplicados ao zoneamento ecológico-econômico e ao ordenamento territorial. INPE: São José dos Campos, 2001. 124 p.
- CURVELLO, R. T.; BATISTA, G. T.; TARGA. M. dos S. Estudo dos impactos da ocupação humana na microbacia do rio Batedor na Serra da Mantiqueira no município de Cruzeiro, SP, Brasil. Ambi-Agua, Taubaté, v. 3, n. 1, p. 91-107, 2008.
- DEMARCHI, J. C.; PISANI, R. J.; ZIMBACK, C. R. L. Análise da vulnerabilidade à erosão da sub-bacia do Ribeirão das Perobas por meio de sensoriamento remoto e geoprocessamento. Geografia e Pesquisa, v. 7, n. 1, p. 6-37, 2013.
- DILL, P. R. J. Assoreamento do reservatório do Vacacaí-Mirim e sua relação com a deterioração da bacia hidrográfica contribuinte. 125 f. Dissertação (Mestrado em Engenharia Civil) - Universidade Federal de Santa Maria, 2002.
- EMBRAPA. Sistema brasileiro de classificação de Solos, Ministério da Agricultura, Pecuária e Abastecimento, 3ª Edição, Brasília-DF, 2013. 353 p.
- FACCINI, U. F.; GIARDIN, A.; MACHADO, J. L. F. Heterogeneidades litofaciológicas e hidroestratigrafia do Sistema Aquífero Guarani na região central do estado do Rio Grande do Sul, Brasil. Geometria, arquitetura e heterogeneidades de corpos sedimentares-estudos de casos. Edição PPGeo-UNISINOS - Editora Unisinos. p. 147-173, 2003.
- FAN, F. M. et al. Sobre o início da rede de drenagem definida a partir dos modelos digitais de elevação. Revista Brasileira de Recursos Hídricos. v. 18, n. 3. p. 241-257, 2013.
- FERREIRA, A. B. et al. Análise do meio físico da sub-bacia do Rio Vacacaí-Mirim-RS/Brasil. Revista Geográfica Acadêmica, v. 3, n. 2. p. 28-34, 2009.
- FLORENZANO, T. G. Cartografia. Geomorfologia: conceitos e tecnologias atuais. São Paulo: Oficina de Textos. p. 105-128, 2008.
- GOMES, P. R; MALHEIROS, T. F. Proposta de análise de indicadores ambientais para apoio na discussão da sustentabilidade. Revista Brasileira de Gestão e Desenvolvimento Regional, Taubaté, v. 8, n. 2, p. 151-169, 2012.
- GOMES, T. C. et al. Caracterização e Espacialização dos Depósitos Tecnogênicos no Bairro Camobi Subsídio ao Planejamento Urbano do Município de Santa Maria - RS. Revista Geonorte, v. 2, n. 4, p. 276 - 288, 2012.
- GUERRA, A. J. T. Degradação dos solos - conceitos e temas. In: GUERRA, A. J. T.; JORGE, M. do C. O. (Org.). Degradação dos solos no Brasil. Rui de Janeiro: Bertrand Brasil, p. 15 - 51, 2014.
- INPE. Instituto Nacional de Pesquisas Espaciais. Projeto Topodata. 2011. Available in: <http://www.dsr.inpe.br/topodata>. Accessed on: dezembro de 2015.
» http://www.dsr.inpe.br/topodata - KONRAD, C. G. Zoneamento Ambiental da Microbacia Hidrográfica do Reservatório do DNOS de Santa Maria-RS. 98 f. Dissertação (Mestrado em Geografia) - Universidade Federal de Santa Maria, 2005.
- MACIEL FILHO, C. L. Carta Geotécnica de Santa Maria. Imprensa Universitária-UFSM, 1990.
- MENEZES, J. B. et al. Índice de Vulnerabilidade à Erosão para uma Bacia na Mesorregião do São Francisco Pernambucano, a Partir das Relações entre Morfogênese e Pedogênese. Revista Brasileira De Geomorfologia, v. 8, p. 45-56, 2007.
- MIGUEL, P. Caracterização Pedológica, Uso da Terra e Modelagem da Perda de Solo em Áreas de Encosta do Rebordo do Planalto do RS. 112 f. Dissertação (Mestrado em Ciência do Solo) - Universidade Federal de Santa Maria. 2010.
- MIGUEL, P. et al. A. Solo e dinâmica de ocupação das terras em áreas do rebordo do planalto do Rio Grande do Sul. R. Bras. Agroci., v. 17, p. 447-455, 2011.
- MIGUEL, P. et al. Identificação de fontes de produção de sedimentos em uma bacia hidrográfica de encosta. Revista Brasileira de Ciência do Solo, v. 38, n. 2, p. 585-598, 2014.
- MOTA, L. H. S. O.; VALLADARES, G. S.: Vulnerabilidade à degradação dos solos da Bacia do Acarajú, Ceará. Revista Ciência Agronômica, v. 42, 39-50, 2011.
- PAIVA, R. C.; PAIVA, E. M.; PAIVA, J. B. D. Estimativa das Vazões Naturais nas Sub-Bacias do Vacacaí-Mirim através de Modelo Simplificado. In: Anais... I Simpósio de Recursos Hídricos do Sul-Sudeste, 2006.
- RIBEIRO, F. L.; CAMPOS, S. Vulnerabilidade à erosão do solo da região do Alto Rio Pardo, Pardinho, SP. Revista brasileira de engenharia agrícola e ambiental, v. 11, n. 6, p. 628-636, 2007.
- RIBEIRO, H. Saúde Pública e Meio Ambiente: evolução do conhecimento e da prática, alguns aspectos éticos. Saúde e Sociedade. v.13, n.1, p. 70-80, 2004.
- RODRIGUES, B. R. C.; RODRIGUES, C. M. C.; FOLETO, E. M. Levantamento de Uso e Conflitos da Terra na Área de Proteção Ambiental (APA) no Rio Vacacaí-Mirim/RS. Anais... XXVII Encontro Nacional de Engenharia de Produção, Foz do Iguaçu, Brasil, 2007. Available in: <http://www.abepro.org.br/biblioteca>. Accessed on: 13 out. 2015.
» http://www.abepro.org.br/biblioteca - SANTOS, R. F. Planejamento Ambiental: teoria e prática. São Paulo: Oficina de Textos, 2004.
- SAMUEL-ROSA, A. et al. Uso da terra no Rebordo do Planalto do Rio Grande do Sul. Ci. Natura, v. 33, p. 161-173, 2011.
- SCHUSSEL, Z.; NASCIMENTO NETO, P. Gestão por bacias hidrográficas: do debate teórico à gestão municipal. Ambiente & Sociedade. São Paulo, v. XVIII, n. 3. p. 137-152, 2015.
- SOIL SURVEY STAFF. Keys to Soil Taxonomy. USDA, National Resources Conservation Service, National Soil Survey Center, Lincoln, NE. 2014.
- SOUZA, M. M. de. Carga de poluição difusa em bacias hidrográficas com diferentes impactos antrópicos. Santa Maria, Dissertação (Mestrado). UFSM. 2012.
- TRICART, J. Ecodinâmica. Série recursos naturais e meio ambiente. SUPREN/IBGE, 1977, v. 1.
Publication Dates
-
Publication in this collection
2018
History
-
Received
11 Apr 2017 -
Accepted
07 June 2018

 Source: made by the authors.
 Source: prepared by the authors.
 Source: prepared by the authors.
 Source: prepared by the authors.