Abstracts
A two year field study (1996/97 and 1997/98 growing seasons) was carried out at the Maricopa Agricultural Center (33º04'07" N; 111º57'18" W) of the University of Arizona, USA, to investigate the water use and to derive Kc's for subsurface drip-irrigated head lettuce grown in small weighable lysimeters. Measurement periods ranged from 480 to 1100 ºC-day (96/97) and from 439 to 1098 ºC-day (97/98). These intervals corresponded essentially to the second half of the crop cycle which amounted to a 1100 ºC-day, on average. The lysimeters were weighed periodically and the computation of the water balance revealed an average water use of 117 mm. Basal crop Kc was expressed as a function of cumulative growing degree days following a multiple linear regression procedure in which the data were fitted with a Fourier sine series model with up to six coefficients. Two-year Kc curves were obtained based on the Hargreaves, FAO Penman and FAO Penman-Monteith equations and compared to the AZSCHED (AriZona SCHEDuling) irrigation package. Predicted Kc peaked 0.88, 0.80 and 0.81 with the Hargreaves, FAO Penman, FAO Penman-Monteith equations, respectively, in the range of 1000 to 1050 ºC-day, in contrast to AZSCHED which predicted the peak Kc to be 1.01 at 1150 ºC-day.
SDI; Lactuca sativa; lysimeter; evapotranspiration
Um estudo conduzido na Fazenda Experimental Maricopa (33º04'07" N; 111º57'18" W), pertencente à Universidade do Arizona, USA, nos anos agrícolas de 1996/97 e 1997/98, objetivou determinar o uso de água e derivar coeficientes de cultura (Kc) da alface de cabeça irrigada por gotejamento subsuperficial e cultivada em lisímetros de pesagem intermitente. O período de medições, expresso em graus-dia acumulados, variou de 480 a 1100 ºC-dia em 96/97 e de 439 a 1098 ºC-dia em 97/98. Esses intervalos corresponderam à segunda metade do ciclo da cultura, sendo que até a colheita somou-se uma média de 1100 ºC-dia. Os lisímetros eram pesados periodicamente e o balanço hídrico revelou um consumo médio de 117 mm, naqueles períodos. O Kc basal foi relacionado com o acúmulo de graus-dia através de regressão múltipla, seguindo um modelo dado por uma série seno de Fourier, com até seis coeficientes. As curvas de Kc foram determinadas com base nos métodos de Hargreaves, FAO Penman e FAO Penman-Monteith, para cálculo da ETo e comparadas por aquela gerada pelo programa AZSCHED (AriZona SCHEDuling) de manejo da irrigação. Valores máximos de Kc estimados foram 0,88 (método de Hargreaves), 0,80 (FAO Penman) e 0,81 (FAO Penman-Monteith) no intervalo de 1000 a 1050 ºC dia, inferiores a 1,01 em 1150 ºC dia, que é o máximo Kc previsto pelo programa AZSCHED.
SDI; Lactuca sativa; lisímetro; evapotranspiração
MANEJO DE ÁGUA E SOLO
Water use and crop coefficient of subsurface drip-irrigated lettuce in Central Arizona
Demanda hídrica e coeficiente de cultura da alface irrigada por gotejamento sub-superficial na região central do Arizona
Aureo S. de OliveiraI; Edward C. MartinII; Donald C. SlackII; Edward J. PegelowIII; Allen D. FoltaIV
IDEA/UFBA. CEP 44380-000, Cruz das Almas, BA. Fone: (75) 621-1220, Ramal: 212, E-mail: aureo@ufba.br
IIDept. of Agricultural & Biosystems Engineering, University of Arizona, Shantz Bldg. Tucson, AZ, 85721, USA, Fax: (520) 568-2556. E-mail: edmartin@cals.arizona.edu; slackd@u.arizona.edu
IIIThe University of Arizona Maricopa Agricultural Center 37860 W. Smith-Enke Road Maricopa, Arizona 85239, USA Telephone: (520) 568-2273, Fax: (520) 568-2556.
IVFintech Precast, Inc. 16761 Clear Creek Road Redding, CA, 96001, Fone: (530) 241-8397, Fax: (530) 241-1249. E-mail: dan.folta@yahoo.com
ABSTRACT
A two year field study (1996/97 and 1997/98 growing seasons) was carried out at the Maricopa Agricultural Center (33º04'07" N; 111º57'18" W) of the University of Arizona, USA, to investigate the water use and to derive Kc's for subsurface drip-irrigated head lettuce grown in small weighable lysimeters. Measurement periods ranged from 480 to 1100 ºC-day (96/97) and from 439 to 1098 ºC-day (97/98). These intervals corresponded essentially to the second half of the crop cycle which amounted to a 1100 ºC-day, on average. The lysimeters were weighed periodically and the computation of the water balance revealed an average water use of 117 mm. Basal crop Kc was expressed as a function of cumulative growing degree days following a multiple linear regression procedure in which the data were fitted with a Fourier sine series model with up to six coefficients. Two-year Kc curves were obtained based on the Hargreaves, FAO Penman and FAO Penman-Monteith equations and compared to the AZSCHED (AriZona SCHEDuling) irrigation package. Predicted Kc peaked 0.88, 0.80 and 0.81 with the Hargreaves, FAO Penman, FAO Penman-Monteith equations, respectively, in the range of 1000 to 1050 ºC-day, in contrast to AZSCHED which predicted the peak Kc to be 1.01 at 1150 ºC-day.
Key words: SDI, Lactuca sativa, lysimeter, evapotranspiration
RESUMO
Um estudo conduzido na Fazenda Experimental Maricopa (33º04'07" N; 111º57'18" W), pertencente à Universidade do Arizona, USA, nos anos agrícolas de 1996/97 e 1997/98, objetivou determinar o uso de água e derivar coeficientes de cultura (Kc) da alface de cabeça irrigada por gotejamento subsuperficial e cultivada em lisímetros de pesagem intermitente. O período de medições, expresso em graus-dia acumulados, variou de 480 a 1100 ºC-dia em 96/97 e de 439 a 1098 ºC-dia em 97/98. Esses intervalos corresponderam à segunda metade do ciclo da cultura, sendo que até a colheita somou-se uma média de 1100 ºC-dia. Os lisímetros eram pesados periodicamente e o balanço hídrico revelou um consumo médio de 117 mm, naqueles períodos. O Kc basal foi relacionado com o acúmulo de graus-dia através de regressão múltipla, seguindo um modelo dado por uma série seno de Fourier, com até seis coeficientes. As curvas de Kc foram determinadas com base nos métodos de Hargreaves, FAO Penman e FAO Penman-Monteith, para cálculo da ETo e comparadas por aquela gerada pelo programa AZSCHED (AriZona SCHEDuling) de manejo da irrigação. Valores máximos de Kc estimados foram 0,88 (método de Hargreaves), 0,80 (FAO Penman) e 0,81 (FAO Penman-Monteith) no intervalo de 1000 a 1050 ºC dia, inferiores a 1,01 em 1150 ºC dia, que é o máximo Kc previsto pelo programa AZSCHED.
Palavras-chave: SDI, Lactuca sativa, lisímetro, evapotranspiração
INTRODUCTION
The water requirement of a given crop is represented by its evapotranspiration (ETc), basically defined as the rate of transfer of water vapor from plant and soil surfaces to atmosphere. This is a key element for the implementation of irrigation management strategies for crop production at both farm and irrigation scheme levels and for the study of leaching of agrochemicals towards ground waters. In the agricultural areas of Arizona, irrigation plays an essential role in the production of grains, cotton, fruits, alfalfa, and vegetables (Irrigation Journal, 2001). The State of Arizona is a major contributor to the nation's winter lettuce supply. Arizona also ranks near the top nationally in the production of broccoli, carrots, cauliflower and spring onions. Lettuce was grown on more hectares than any other vegetable crop in Arizona in 2000 (Irrigation Journal, 2001). Total area was 25,250 ha and corresponded to roughly 58% of the total irrigated area under vegetable production in that year.
Studies on water use by vegetable crops in Arizona have been conducted since the classical work done by Erie et al. (1965). Due to its importance as the major source of information on water requirements for many crops in the Southwestern US, the paper was later reprinted (USDA, 1982). Even today, many irrigation management schemes in Arizona and the Southwest are based on information from that report. Fox et al. (1992) incorporated the lettuce water use data from Erie et al. (1965) into the AZSCHED (AriZona SCHEDuling) irrigation program. The estimates of head lettuce ET obtained by Erie et al. (1965) were based on gravimetric measurements of soil water content in furrow-irrigated lettuce fields. They concluded that the crop seasonal water use was about 216 mm for a three and a half month growing season with time of planting around September 15. The peak water use was observed to occur in the head development stage and they also showed that 56% of seasonal soil moisture depletion by crop water use occurred in the top 30 cm. More recently, Gallardo et al. (1996) and Grattan et al. (1998) have also reported lettuce water use for California conditions.
Surface irrigation is still the most widely used method for irrigating lettuce in the US. But pressurized irrigation systems like sprinkler and subsurface drip have gained a lot of importance due to their ability to achieve higher irrigation efficiency and uniformity when compared to traditional surface systems. Considering the facts related to the importance of the drip irrigation systems for crop production in arid and semi-arid areas and the lack of more updated information on lettuce water use in Arizona grown under that irrigation method, a field study was conducted to determine the seasonal water use of subsurface-drip irrigated lettuce and to derive crop coefficients to be used in irrigation scheduling programs.
MATERIAL AND METHODS
Site characterization
This research was carried out at the Maricopa Agricultural Center (MAC) of the University of Arizona in the 1996/97 and 1997/98 growing seasons (Fall-Winter). Local coordinates are: latitude 33º04'07" N, longitude 111º57'18" W, and altitude 361 m. The soil is a deep, well drained and slowly permeable alluvial; classified as Casa Grande sandy loam. Physical and chemical characteristics of the soil based on samples taken from the top 20 cm included 67% of sand, 19.7% of silt, 13.3% of clay, pH 7.9, EC 0.624 dS m-1, Ca+2 8380 ppm, Mg+2 4600 ppm, Na+ 345 ppm, K+ 3350 ppm. Winter temperatures range from -2 to 17 ºC and summer temperatures range from 25 to 42 ºC. Annual average rainfall is about 185 mm. Averages and totals for selected weather parameters during both seasons are shown in Table 1. Data were taken from the nearest AZMET (AriZona METeorological network) weather station located 50 m south of the experimental area.
Most of the irrigation water used at MAC comes from the Central Arizona Project, which is primarily diverted from the Colorado River although it is often mixed with groundwater. Results from the analysis of a sample taken in 1996 revealed a pH of 8.1 and an EC of 1.11 dS m-1. Additional analysis revealed chemical concentrations of 72.8 ppm Ca+2, 14.3 ppm Mg+2, 191 ppm Na+, 3.85 ppm K+, carbonate content < 1 mg L-1, bicarbonate content 192 mg L-1 and alkalinity 157 mg L-1.
Lysimeter design and crop management
The experimental area consisted of six plots with four beds each. A bed shaper was used to make the beds that were roughly 15 cm high, 100 cm wide and 18.6 m long. Buffer beds were on the east and west side of the plot and the harvest beds were in the center. In both the 96/97 and 97/98 seasons, a small weighing lysimeter, as described by Martin et al. (2001), was installed in one of the harvest beds, in the center of the plot. Winter head lettuce (Lactuca sativa L.) and onion (Allium cepa L.) were sown in 1996 and lettuce and kale (Brassica oleracea L. var. acephala) were sown in 1997 but only results on lettuce from both the years are reported and discussed in this paper.
A lysimeter was comprised of an outer rectangular retaining shell and an inner tank, with an internal area of about 0.929 m2. Drainage water was suctioned by a 34-L evacuated metal tank connected to ceramic cylinders installed at the bottom of the inner tank. The lysimeter weighing equipment consisted of a four-wheel spirit sprayer chassis, a digital weighmeter, a load cell, and hook-ended chains to lift the lysimeters up. A detailed description of the lysimeter and the weighing system can be found in Martin et al. (2001). On weighing days, the sprayer was driven to the field and parked above the first lysimeter where the chains were lowered and the hooks connected to the corners of the lysimeter. The drainage tank was then disconnected and taken to the laboratory for collecting and weighing of the drainage water. Frequency of weighing varied from 1 to no more than 3 times a week and was higher in the 97/98 season as compared to the 96/97 season.
Two rows were mechanically seeded in each bed before lysimeter installation and hand-seeded in the lysimeters after their installation. The beds were subsurface drip-irrigated for the first time on the day following the sowing in the lysimeters. Turbulent flow twin-wall drip irrigation tapes (Chapin Watermatics, Inc., USA1) with wall thickness of 381 mm, and 23 cm outlet space, were buried at about 15 cm depth at the center of each bed during bed formation. According to the manufacturer, the tape flow rate was about 373 L 100 m-1 h-1 at the 68.9 kPa pressure. These specifications were verified in a field test.
The planting date, considered to be the date of the first irrigation, was on 24th October (DOY 298) in 1996 and 23 rd October (DOY 296) in 1997. Emergence occurred about seven days after planting in both years, i.e., on 1st November 1996 (DOY 306) and 30th October 1997 (DOY 303). Dry fertilizer was applied prior to planting to assure adequate nutrient content in the soil. An application of 560 kg ha-1 of 11-55-0 was applied to the entire plot prior to any field activity. Additional nitrogen was applied using UAN-32 liquid fertilizer injected directly into the irrigation system by a differential pressure type injector. The applications were made throughout the season to match crop needs at different stages of growth. The fertilizer application rate was 26.4 L ha-1 with time of application ranging from 15 to 30 min. Since the seeds were mechanically sown, the final plant spacing was determined by thinning. The first thinning in 96/97 was made during the 3rd week after emergence for a temporarily 8 cm spacing. A second thinning during the 6th week resulted in the final plant spacing of 23 cm. In 97/98, only one thinning during the 4th week after plant emergence was made. After thinning, four plants per row were left in each lysimeter totaling eight plants per lysimeter. In both seasons, all plots were hand-cleaned for weed control during the 5th and 6th weeks after plant emergence.
Soil water monitoring and irrigation control
A TDR device (model 6060X1 TRASE, Soilmoisture Corp., Goleta, CA, USA) was used to measure the soil water content in the crop root zone during both the 96/97 and 97/98 seasons. The TDR was calibrated against the standard gravimetric method from soil samples taken in the top 45 cm, covering a broad range of soil moisture from dry to wet. In 97/98, soil moisture conditions were also monitored with digital tensiometers (Soil Measurement Systems, Inc., Tucson, AZ, USA) installed inside and outside the lysimeters at a depth of 45 cm. TDR waveguide probes were installed in all three lysimeters at 15, 30 and 45 cm depths. At each depth, three readings were taken but only the last two were recorded. The first one was discarded as to stabilize the readings and to check for reading errors. Initially, the amount of irrigation water to apply was calculated using soil moisture data from the 30 cm TDR reading. This reading was used because it was assumed that the plant roots did not go beyond 30 cm. Later in the season, the 45 cm TDR readings were used assuming the plant roots had reached this depth.
Irrigation water was applied in an amount to avoid plant stress and to promote potential evapotranspiration conditions inside and outside the lysimeters. The irrigation threshold was based on a maximum allowed depletion (MAD) of 35%. TDR readings were taken inside and outside the lysimeters before each irrigation and the decision to irrigate was based on moisture data from the lysimeters. Probes were also installed in the bed outside the lysimeters. Tensiometer readings were also taken on a regular basis and always before irrigation. The maximum irrigation depth was calculated based on the root system depth and total available water between field capacity (0.270 cm3 cm-3) and permanent wilting point (0.140 cm3 cm-3). Gross irrigation depths were calculated using 95% application efficiency for the irrigation system.
Water balance in the lysimeters
The lysimeters were always weighed before irrigation, but were not always weighed right after. For those days when the lysimeters were not weighed after irrigation, the amount of water applied was estimated based on the weight variation data obtained on the days when they were weighed after irrigation. The first weighing period started on December 19, 1996 (48 days after emergence, DAE, DOY 354) and ended on March 4,1997 (123 DAE, DOY 63), a 76-day interval during which the lysimeters were weighed 13 times. In 97/98, the lysimeters were weighed 20 times from December 15, 1997 (46 DAE, DOY 349) to March 19, 1998 (140 DAE, DOY 78), a 94-day interval.
The water balance components in a lysimeter over a given period of time are irrigation, precipitation, evapotranspiration, drainage, and water storage variation. Irrigation runoff was null since the crop was subsurface drip irrigated. Rainfall runoff into the lysimeters was prevented through the gap between the walls of the inner and outer tanks and rainfall runoff out of the lysimeters was considered negligible, since depended on rain intensity and initial soil moisture conditions. Based on these assumptions, the water balance could be solved for ET as given by:

(1)
where ETc = average crop evapotranspiration (mm day-1), I = irrigation depth (mm), P = precipitation depth (mm), D = drainage depth (mm), DS = soil water content variation (mm) being the difference between two consecutive weighings of the lysimeter, and Dt = time interval (day).
Derivation of crop coefficient curve
Basal crop coefficient over a given time interval Dt was calculated as follows:

(2)
where Kc = average basal crop coefficient (dimensionless) and ETo = average reference crop evapotranspiration (mm day-1).
Cumulative growing degree-days from plant emergence, (CGDD), were used as a normalizing factor to draw the crop coefficient curve. Then, CGDD was the independent variable against which Kc values could be plotted. A multiple linear regression with up to six coefficients was performed to fit the data (Fox et al., 1992; Slack et al., 1996), following:
Kc = C1sinY + C2sin2Y + C3sin3Y + C4sin4Y + C5sin5Y + C6sin6Y
(3)
where Cn = regression coefficient. The regression analysis was performed with the constant value set to zero. The variable Y is obtained through:

(4)
where C0 determines the value of cumulative growing degree-days where the crop coefficient returns to zero or some minimum value. In this work, C0 for lettuce was taken as 1450 ºC-day (Slack et al., 1996). Therefore, once the Cn values were determined, Kc could be obtained for any time in the season, through Eq. 3. Growing degree-days were calculated using the sine curve method as reported by Fry (1983). Following recommendations by Slack et al. (1996), the minimum threshold temperature, Th, was set to be 3.33 ºC and the upper limiting temperature, Tu, was set to be 21.1 ºC. The value of CGDD used to make a given pair (CGDD, Kc) corresponded to the average value during the time interval Dt (Eq. 1) and Kc was obtained from Eq. 2.
Lettuce crop coefficients were calculated based on three different ETo methods, the Hargreaves equation (EToH), the FAO Penman equation (EToFP), and the FAO Penman-Monteith equation (EToFPM). The intermediate steps in the calculation of ETo by each method can be found in detail in Hargreaves et al. (1985), Doorenbos & Pruitt (1977) and Allen et al. (1994).
RESULTS AND DISCUSSION
Reference ET and cumulative GDD
The 96/97 season covered a period of 132 days from planting (October 24, 1996, DOY 298) to harvest ( March 4, 1997, DOY 63). The 97/98 season ranged from October 23, 1997 (DOY 296) to March 19, 1998 (DOY 78), totaling 148 days. Table 2 shows the seasonal and daily average ETo based on the three proposed methods.
The FAO Penman equation estimated the highest seasonal ETo in both seasons (Table 2) and also provided the highest variability in daily ETo. The Penman-Monteith method has been found to perform excellent under a broad variety of conditions and several authors (Jensen et al., 1990; Beyazgül et al., 2000) have recommended it as the standard for ETo estimates. Assuming this is the case for the Central Arizona conditions, then the FAO Penman equation overestimated seasonal and daily ETo for both years. In 96/97, seasonal ETo was overestimated by 6.9% and daily ETo was overestimated by 8.3%. This trend continued in 97/98 with seasonal estmates 12.1% higher and daily ETo values 12.0% higher. The overestimation of the FAO Penman equation has been widely reported (Allen et al., 1989; Chiew et al., 1995) and the values found here are consistent with those abtained by.
The seasonal ETo predicted by the Hargreaves equation was 4.5% lower than the FAO Penman-Monteith equation in 96/97 and 4.4% higher than that in 97/98. In terms of daily ETo, the average difference between ETo estimated by both methods was less than 1% in 96/97 and 8.0% in 97/98. The 97/98 season was wetter than the 96/97 (Table 1) and the tendency of the Hargreaves method to overestimate ETo under humid conditions has been addressed (Hargreaves, 1989; Amatya et al., 1995). Despite a near null average difference in the 96/97 season, the relative difference between EToH and EToFPM on a daily basis ranged from - 43 to 62%. This scattered pattern (overpredicting, then underpredicting) exhibited by the Hargreaves equation on a daily basis was also discussed by Henggeler et al. (1996).
The summation of GDD started from the emergence date, i.e., Nov. 1, 1996 (DOY 306) and Oct. 30, 97 (DOY 303). The cumulative GDD was 1100 ºC-day by the end of the 96/97 season and about 1170 ºC-day in the 97/98 season.
Irrigation scheduling and soil moisture profiles
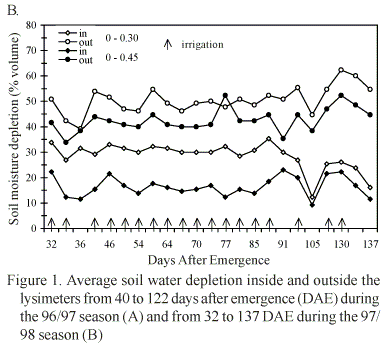
TDR readings inside the lysimeters were used to determine when to irrigate. The gross amount of water to be applied was then determined using an application efficiency of 95%. At the study site, a timer was set for the calculated irrigation time. Irrigation depths were initially calculated for the 30 cm depth but in the last quarter of both seasons, when the plants reached their stage of peak vegetative development, calculations were made using a rooting depth of 45 cm. The soil water depletion inside and outside the lysimeters is summarized in Table 3. The average soil water depletion at both the 30 and 45 cm depths in the lysimeters was lower than the maximum allowed value of 35%.
In general, the soil water depletion outside the lysimeters was higher than inside. The depletion was also higher at the 30 cm depth compared to the 45 cm depth, in both inside and outside the lysimeters. The variation of soil water depletion in 96/97 and 97/98 is shown in Figure 1A and Figure 1B. Most of the readings were taken prior to irrigation on the days when the lysimeter was weighed and therefore, on those days, the depletion was well above zero.
Higher soil water depletion levels were measured both inside and outside the lysimeters in the top 30 cm, suggesting that the plants extracted more water from this depth where root density would be higher. According to Nonnecke (1989), lettuce forms a deep, penetrating taproot, but the major absorbing root area is found spreading laterally in the upper 30 cm of the soil. No investigation was done on the root system development inside the lysimeters since the lysimeter area was small and soil disturbance and plant damage were likely to occur, altering the rate of water loss as vapor.
Measurements of the soil water potential in the 97/98 season at 45 cm gave support to the findings on soil water depletion in and out of the lysimeters, in the sense that the soil inside the lysimeters was wetter than outside. The soil water potential averaged -9.84 and -11.06 kPa inside and outside the lysimeters, respectively. Therefore, the soil water content at 45 cm was higher than the critical soil water potential -40 kPa, which is the value that has been recommended for irrigation scheduling (Gallardo et al., 1996).
The differences in soil moisture in and out of the lysimeters, especially at lesser depths seem to go against the representativeness of the lysimeters. A vacuum drainage system was used, which is essential (Howell et al., 1991) with shallow lysimeters (depth < 1.5 m) in order to get representative field conditions, since the vacuum drainage helps to equalize the water potential at the lower boundary to that in the surrounding soil. Allen et al. (1991), on the other hand, pointed out that frequently, vacuum extraction systems are only partially effective in drying lysimeter profiles and may fail with age, resulting in lysimeter profiles more moist than surrounding soils. Vaccum-leaking problems found with the drainage system used in both seasons, may have affected the ability of the drainage system in suctioning water efficiently from the lysimeter.
Water applied and lettuce ET
Lettuce ET was obtained by applying Eq. 1 to data from each of the lysimeters during the period of measurement; given in terms of CGDD. Table 4 shows the average lettuce ET and other components of the water balance in the lysimeters. The difference in the drainage depth between the seasons may in part be due to the leaks but most was due to the additional 77 mm of rainfall that occurred.
As previously shown, the weighing period corresponded to 75 days in 96/97 and 87 days in 97/98, in contrast to the duration of the total crop cycle which was 132 days in 96/97 and 148 days in 97/98. Therefore, the numbers in Table 4 do not tell much in terms of seasonal water use (planting to harvest) because they correspond approximately to the second half of the crop cycle. These data show the water use during the most sensitive period of the crop, i.e., the head development and maturity (Shih & Rahi, 1984). According to Swiader et al. (1992) lettuce produces approximately 70% of its total growth in the 3 weeks preceding maturity. Therefore, the bulk of the crop water use should occur during that short period. Lettuce is harvested during the maximum vegetative growth stage (Plaut & Meiri, 1994) when the canopy covers a large part of the soil surface and ET rates are high.
Lettuce ET has been reported to vary with location, time of the year, cultivar and irrigation system. In Mesa, Arizona, Erie et al.(1965) reported a 216 mm water use for furrow-irrigated lettuce from planting to harvest, with planting date by the second week of September. In a study by Gallardo et al. (1996) in California, the ET of three well-watered sprinkler-irrigated lettuce cultivars varied from 141 to 153 mm.
Lettuce Kc curve
Lettuce basal Kc was obtained by dividing average values of ETc and ETo over the respective time interval (Eq. 2). As mentioned earlier, ETo was calculated based on the Hargreaves, FAO Penman and FAO Penman-Monteith methods. Crop coefficient values from both 96/97 and 97/98 seasons were combined and resulted in the regression equation coefficients shown in Table 5.
The coefficients of the regression model used by AZSCHED (Fox et al., 1992) to estimate lettuce Kc are shown here for comparison purposes. These coefficients were derived from data reported by Erie et al. (1982). AZSCHED used a Penman-type equation to estimate ETo. A graphical representation of the models in Table 5 is shown in Figure 2.
The first three models in Table 5 are not recommended for estimating Kc values between the planting date and about 450 oC day, since no experimental data were available to define the shape of the curve in that range. For irrigation scheduling purposes, Kc values in that range can be estimated from a single straight-line as shown in Figure 2 for the AZSCHED-based Kc or a different approach can be used to estimate crop water demand.
The lettuce Kc predicted by all three ETo methods was about the same, with small differences in the 450 to 800 oC day range, when started to differentiate toward the peak values. The Hargreaves based Kc peaked 0.88 while FAO Penman and FAO Penman-Monteith based Kc peaked 0.80 and 0.81, respectively, between 1000 and 1050 oC-day. The AZSCHED lettuce Kc peaked 1.01 at about 1150 ºC-day. It is seen that the experimental Kc curves shifted downwards and to the left with respect to the AZSCHED Kc curve, regardless the ETo method used.
Lettuce crop coefficients have been reported, however, in most cases, the type of lettuce used (leafy or head) is not clearly mentioned or is not specified. Information on crop management and irrigation methods is also frequently absent. Most Kc values are arranged in tables and are a function of time (Julian days or days after planting or emergence). Few studies used heat units as a normalizing variable. The use of percentage ground cover has only recently been reported (Grattan et al., 1998).
Other authors have reported different values of Kc for lettuce and according to Doorenbos & Pruitt (1977), the minimum and maximum suggested Kc values were 0.25 and 1.00. For a well-watered lettuce field, Gallardo et al. (1996) in California found maximum Kc to vary from 0.81 to 1.02 by harvest. In that study, ETo was obtained from the CIMIS network and Kc was expressed as a fuction of time (DAE). Hargreaves & Samani (1991) reported lettuce Kc values based on a reference ET calculated using the Hargreaves equation. They reported peak Kc to vary from 0.85 to 1.05. In the present study, the predicted peak Kc using the Hargreaves ETo equation was 0.88. Snyder & Pruitt (1989) presented two sets of lettuce Kc for California conditions depending on the planting date, i.e., end of August and end of October, according to the straight-line approach of Doorenbos & Pruitt (1977). For the first planting date, they recommended 0.17 (10% ground cover), 1.02 (peak canopy development), and 0.10 (end of the season). The corresponding Kc values for the second planting date were 0.30, 0.87, and 0.30. Grattan et al. (1998) recently reported Kc polynomial models for furrow-irrigated iceberg lettuce and other vegetable (row) crops, applying the percentage of canopy cover as the independent variable. They used data from two locations in California (El Centro and Imperial Valley). Lettuce ET was measured from 2.5 to 71% of ground cover. The fitted curve was a second-order polynomial and the predicted Kc values varied from 0.1 to about 0.78.
CONCLUSIONS
1. The water use of subsurface drip-irrigated lettuce indicate an average demand of 117 mm.
2. This amount basically reflects the water demand du-ring the second half of the crop cycle that accumulated 1100 oC-day, on the average.
3. Crop coefficients based on Hargreaves, FAO Penman and FAO Pernman-Monteith peaked 0.88, 0.80 and 0.81, respectively in the range of 1000 to 1050 ºC-day.
4. These values were lower than and occurred earlier than the maximum Kc predicted by the AZSCHED irrigation-scheduling model.
ACKNOWLEDGMENTS
The first author would like to thank the Brazilian Ministry of Education through CAPES, which supported him to pursue his PhD at the University of Arizona, Tucson, AZ, USA.
LITERATURE CITED
Protocolo 123 - 15/7/2003 - Aprovado em 2/6/2004
- Allen, R.G.; Jensen, M.E.; Wright, J.L.; Burman, R.D. Operational estimates of evapotranspiration. Agronomy Journal, Madison, v.81, p.650-662, 1989.
- Allen, R.G.; Pruitt, W.O.; Jensen, M.E. Environmental requirements for lysimeters. In: Lysimeters for evapotranspiration and environmental measurements, 23-25 July, 1991, Honolulu, HI, USA. Proceedings… New York: ASCE, 1991. p.170-181.
- Allen, R.G.; Smith, M.; Perrier, A.; Pereira, L.S. An update for the definition of reference evapotranspiration. ICID Bulletin, New Delhi, v.43, n.2, p.1-34, 1994.
- Amatya, D.M.; Skaggs, R.W.; Gregory, J.D. Comparison of methods for estimating REF-ET. Journal of Irrigation and Drainage Engineering, New York, v.121, n.6, p.427-435, 1995.
- Beyazgül, M.; Kayam, Y.; Engelsman, F. Estimation methods for crop water requirements in the Gediz Basin of Western Turkey. Journal of Hydrology, Amsterdam, v.229, p.19-26, 2000.
- Chiew, F.H.S.; Kamaladasa, N.N.; Malano, H.N.; McMahon, T.A. Penman-Monteith, FAO-24 reference crop evapotranspiration and class-A pan data in Australia. Agricultural Water Management, Amsterdam, v.28, p.9-21, 1995.
- Doorenbos, J.; Pruitt, W.O. Crop water requirements. Rome: FAO, 1977. 144p. Irrigation and Drainage Paper 24
- Erie, L.J.; French, O.F.; Harris, K., Consumptive use of water by crops in Arizona. Tucson: The University of Arizona, Agricultural Experiment Station Technical Bulletin No. 169. 1965. 46p
- Fox, A.F.; Scherer, T.; Slack, D.C.; Clark, L.J. AZSCHED-Arizona irrigation scheduling: user's manual v. 1.01. Tucson, Agricultural and Biosystems Engineering Department, The University of Arizona, 1992. 36p
- Fry, K.E. Heat-unit calculations in cotton crop and insect models. USDA-ARS, Advances in Agricultural Technology, Fresno, Western Series 23. 1983. 30p.
- Gallardo, M.; Jackson, L.E.; Schulbach, K.; Snyder, R.L.; Thompson, R.B.; Wyland, L.J. Production and water use in lettuces under variable water supply. Irrigation Science, Heidelberg, v.16, p.125-137, 1996.
- Grattan, S.R.; Bowers, W.; Dong, A.; Snyder, R.L.; Carroll, J.J.; George, W. New crop coefficients estimate water use of vegetables, row crops. California Agriculture, Berkeley, v.52, n.1, p.16-21, 1998.
- Hargreaves, G. H. Accuracy of estimated reference crop evapotranspiration. Journal of Irrigation and Drainage Engineering, New York, v.115, n.6, p.1000-1007, 1989.
- Hargreaves, G. H.; Samani, Z.A. Irrigation scheduling/programacion del riego. Las Cruces: Editts, 1991. 46 p.
- Hargreaves, L.G.; Hargreaves, G. H.; Riley, J.P. Irrigation water requirements for Senegal River Basin. Journal of Irrigation and Drainage Engineering, New York, v.111, n.3, p. 265-275, 1985.
- Henggeler, J.C.; Samani, Z.; Flynn, M.S.; Zeitler, J.W. Evaluation of various evapotranspiration equations for Texas and New Mexico. In: International Conference on Evapotranspiration and Irrigation Scheduling, 1996, San Antonio, TX, Proceedings… St. Joseph: ASAE, 1996. p. 962-967.
- Howell, T.A.; Schneider, A.D.; Jensen, M.E. History of lysimeter design and use for evapotranspiration measurements. In: Lysimeters for evapotranspiration and environmental measurements, 23-25 July, 1991, Honolulu, Proceedings… New York: ASCE, 1991. p.1-9.
- Irrigation Journal. 2000 Annual irrigation survey continuous steady growth. Irrigation Journal, Heidelberg, v.51, n.1, p.12-41, 2001.
- Jensen, M.E.; Burman, R.D.; Allen, R.G. Evapotranspiration and irrigation water requirements. New York: ASCE, . 1990. 332p. Manuals and Reports on Engineering Practices 70
- Martin, E.C.; Oliveira, A.S.; Folta, A.D.; Pegelow, E.J.; Slack, D.C. Development and testing of a small weighable lysimeter system to assess water use by shallow-rooted crops. Transactions of the ASAE, St. Joseph, v.44, n.1, p.71-78, 2001.
- Nonnecke, I.L. Vegetable production. New York: van Nostrand Reinhold, 1989. 657p.
- Plaut, Z.; Meiri, A. Crop irrigation. In: Tanji, K.K.; Yaron, B. (eds.). Management of water use in agriculture. New York: Springer-Verlag, 1994. 320 p. Advanced Series in Agricultural Sciences 22
- Shih, S.F.; Rahi, G.S. Evapotranspiration of lettuce in relation to water table depth. Transactions of the ASAE, St. Joseph, v.27, p.1074-1080, 1984.
- Slack, D.C.; Martin, E.C.; Sheta, A.E.; Fox Jr., F.; Clark, L.J.; Ashley, R.O. Crop coefficients normalized for climatic variability with growing-degree-days. In: International Conference on Evapotranspiration and Irrigation Scheduling, 1996, San Antonio. Proceedings… St. Joseph: ASAE, 1996. p.892-898.
- Snyder, R.L.; Pruitt, W.O. Reference evapotranspiration. In: Goldhamer, D.A., Snyder, R.L. (eds.). Irrigation efficiency: A guide for efficient on-farm water management. Davis: ANR 1989. 67p. Publication no. 21454
- Swiader, J.M.; Ware, G.W.; McCollum, J.P. Producing vegetable crops. 4ed. Danville: Interstate Publishers, 1992. 626p.
- USDA - United States Department of Agriculture. Consumptive use of water by major crops in the Southwestern United States. 1982. 42p. Conservation Research Report, Phoenix, No. 29
- van Bavel, C.H.M. Lysimetric measurements of evapo-transpiration rates in Eastern United States. Soil Science Society of America Proceedings, Madison, v.25, p.138-141, 1961.
Publication Dates
-
Publication in this collection
18 May 2005 -
Date of issue
Mar 2005
History
-
Received
15 July 2003 -
Accepted
02 June 2004