ABSTRACT
Leaf area measurements are used in agronomic studies to evaluate plant growth, light interception, photosynthetic rates, and plant transpiration. It constitute an important indicator of crop productivity, for which the evaluation method must be fast, accurate, and of low cost. The objective of this study was to compare different indirect methods to estimate leaf area in pornunça (Manihot sp.). The research was carried out under field conditions from August 2017 to January 2019 in the semiarid region of Pernambuco State, Northeastern Brazil. Three methods were tested: linear dimensions of leaf (length, width, and the number of lobes), digital image, and leaf scanned image, analyzing 150 healthy leaves from 120 plants of pornunça at different growth stages. The criteria used to determine the best model(s) were a high coefficient of determination, low Akaike information criterion, low sum of squares of residuals, and high Willmott index. Independent of the method of determination, the power models showed the best criteria of adequacy for estimating the leaf area of the pornunça. The digital image, using the power model (Y=LW0.77NL0.49, where L and W are the leaf length and width, and NL is the number of lobes in the leaf) was the best non-destructive method for estimating the leaf area in pornunça plants.
Key words:
biometry; modeling; power model
RESUMO
Medidas de área foliar são utilizadas em estudos agronômicos para avaliar o crescimento vegetal, interceptação de luz, taxas fotossintéticas e transpiração das plantas, constituindo-se assim em importante indicador da produtividade das culturas, cujo método de avaliação deve ser rápido, preciso e de baixo custo. Neste estudo, objetivou-se comparar diferentes métodos indiretos para estimar a área foliar na pornunça (Manihot sp). A pesquisa foi realizada em condições de campo, de agosto de 2017 a janeiro de 2019 na região semiárida do Estado de Pernambuco, Nordeste do Brasil. Três métodos foram testados: dimensões lineares das folhas (comprimento, largura e número de lóbulos); imagem digital; e imagem digitalizada da folha. Foram analisadas 150 folhas saudáveis provenientes de 120 plantas de pornunça em diferentes estádios de crescimento. Os critérios utilizados para determinar os melhores modelos de regressão avaliados foram: alto coeficiente de determinação, baixo critério de informação de Akaike, baixa soma do quadrado de resíduos e alto índice de Willmott. Independentemente do método de determinação, os modelos potenciais apresentaram os melhores critérios de adequação para estimar a área foliar na pornunça. A imagem digital, utilizando o modelo potência (Y=CL0,77NL0,49, onde C e L são o comprimento e a largura da folha e NL o número de lóbulos na folha) foi o melhor método não destrutivo para estimar a área foliar nas plantas da pornunça.
Palavras-chave:
biometria; modelagem; modelo potência
HIGHLIGHTS:
The leaf area in pornunça (Manihot sp.) can be estimated with high accuracy using a digital method.
The power model, Y=LW0.77NL0.49, can be used to estimate the leaf area in pornunça.
The number of lobes associated with the length and width of the leaf increases the accuracy of the Pornunça leaf area.
Introduction
Pornunça (Manihot sp.) is a member of the Euphorbiaceae family and descendant of the cassava (M. esculenta) and maniçoba (M. pseudoglaziovii) (Silva et al., 2017Silva, G. L. S.; Carneiro, M. S. S.; Edvan, R. L.; Andrade, A. P.; Medeiros, G. R.; Cândido, M. J. D. Determining a model to estimate leaf area in pornunça (Manihot sp.) using morphometric measures. Acta Scientiarum. Animal Science, v.39, p.351-256, 2017. https://doi.org/10.4025/actascianimsci.v39i4.36447
https://doi.org/10.4025/actascianimsci.v...
), which stands out for its high leaf production, elevated tolerance to water-thermal stress, high accumulation of starch, and high protein content (Alencar et al., 2015Alencar, F. H. H.; Silva, D. S.; Andrade, A. P.; Carneiro, M. S. S.; Feitosa, J. V. Composição química e digestibilidade da pornunça sob duas fontes de adubação orgânica e cortes. Revista Caatinga, v.28, p.215-222, 2015. https://doi.org/10.1590/1983-21252015v28n324rc
https://doi.org/10.1590/1983-21252015v28...
).
Leaf area is a valuable morphological measure for determining the leaf area ratio and leaf area index (Schmildt et al., 2014Schmildt, E. R.; Amaral, J. A. T.; Schmildt, O.; Santos, J. S. Análise comparativa de equações para estimativa da área foliar em cafeeiros. Coffee Science, v.9, p.155-167, 2014. ). Additionally, it is a useful indicator of solar radiation interception by foliage, which in turn affects the intensity of plant transpiration, plant growth, and quantity and quality of forage biomass (Flumignan et al., 2008Flumignan, D. L.; Adami, M.; Faria, R. T. Área foliar de folhas íntegras e danificadas de cafeeiro determinada por dimensões foliares e imagem digital. Coffe Science, v.3, p.1-6, 2008. , Achten et al., 2010Achten, W. M. J.; Maes, W. H.; Reubens, B.; Mathijs, E.; Singh, V. P.; Verchot, L. V.; Muys, B. Biomass production and allocation in Jatropha curcas L. seedlings under different levels of drought stress. Biomass and Bioenergy, v.34, p.667-676, 2010. https://doi.org/10.1016/j.biombioe.2010.01.010
https://doi.org/10.1016/j.biombioe.2010....
). Together, these factors directly influence the efficiency of the use of natural resources applied in production systems and imply the quality and yield of forage produced.
Currently, several methods for estimating leaf area in plants are being used. Non-destructive methods are based on the relationship between linear allometric measurements or images of the leaves and the real leaf area (Flumignan et al., 2008Flumignan, D. L.; Adami, M.; Faria, R. T. Área foliar de folhas íntegras e danificadas de cafeeiro determinada por dimensões foliares e imagem digital. Coffe Science, v.3, p.1-6, 2008. , Leite et al., 2019Leite, M. L. M. V.; Lucena, L. R. R.; Cruz, M. G.; Sá Júnior, E. H.; Simões, V. J. L. P. Leaf area estimate of Pennisetum glaucum by linear dimensions. Acta Scientiarum. Animal Sciences, v.41, e42808, 2019. https://doi.org/10.4025/actascianimsci.v41i1.42808
https://doi.org/10.4025/actascianimsci.v...
). Linear measurements of leaves are commonly used in regression models as a fast, practical, and low-cost method to evaluate leaf area (Toebe et al., 2012Toebe, M.; Cargnelutti Filho, A.; Loose, L. H.; Heldwein, A. B.; Zanon, A. J. Área foliar de feijão-vagem (Phaseolus vulgaris L.) em função de dimensões foliares. Semina: Ciências Agrárias , v.33, p.2491-2500, 2012. https://doi.org/10.5433/1679-0359.2012v33Supl1p2491
https://doi.org/10.5433/1679-0359.2012v3...
). Leaf measurements have been used successfully to determine the leaf area in many crops, including sunflower (Aquino et al., 2011Aquino, L. A.; Santos Junior, V. C.; Guerra, J. V. S.; Costa, M. M. Estimativa da área foliar do girassol por método não destrutivo. Bragantia, v.70, p.832-836, 2011. https://doi.org/10.1590/S0006-87052011000400015
https://doi.org/10.1590/S0006-8705201100...
), passion fruit (Morgado et al., 2013Morgado, M. A. D.; Bruckner, C. H.; Rosado, L. D. S.; Assunção, W.; Santos, C. E. M. Estimação da área foliar por método não destrutivo, utilizando medidas lineares das folhas de espécies de Passiflora. Revista Ceres, v.60, p.662-667, 2013. https://doi.org/10.1590/S0034-737X2013000500009
https://doi.org/10.1590/S0034-737X201300...
), pineapple (Francisco et al., 2014Francisco, J. P.; Diotto, A. V.; Folegatti, M. V.; Silva, L. D. B.; Piedade, S. M. S. Estimativa da área foliar do abacaxizeiro cv. Vitória por meio de relações alométricas. Revista Brasileira de Fruticultura, v.36, p.285-293, 2014. https://doi.org/10.1590/0100-2945-216/13
https://doi.org/10.1590/0100-2945-216/13...
), mango (Lima et al., 2012Lima, R. T.; Souza, P. J. O. P.; Rodrigues, J. C.; Lima, M. J. A. Modelos para estimativa da área foliar da mangueira utilizando medidas lineares. Revista Brasileira de Fruticultura , v.34, p.974-980, 2012. https://doi.org/10.1590/S0100-29452012000400003
https://doi.org/10.1590/S0100-2945201200...
), gray mucuna (Cargnelutti Filho et al., 2012Cargnelutti Filho, A.; Toebe, M.; Burin, C.; Fick, A. L.; Neu, I. M. M.; Facco, G. Estimação de área foliar de mucuna cinza por meio de método não-destrutivo. Ciência Rural, v.42, p.238-242, 2012. https://doi.org/10.1590/S0103-84782012000200009
https://doi.org/10.1590/S0103-8478201200...
), millet (Leite et al., 2019Leite, M. L. M. V.; Lucena, L. R. R.; Cruz, M. G.; Sá Júnior, E. H.; Simões, V. J. L. P. Leaf area estimate of Pennisetum glaucum by linear dimensions. Acta Scientiarum. Animal Sciences, v.41, e42808, 2019. https://doi.org/10.4025/actascianimsci.v41i1.42808
https://doi.org/10.4025/actascianimsci.v...
), cassava (Zanetti et al., 2017Zanetti, S.; Pereira, L. F. M.; Sartori, M. M. P.; Silva, M. A. Leaf area estimation of cassava from linear dimensions. Anais da Academia Brasileira de Ciências, v.89, p.1729-1736, 2017.), and pornunça (Silva et al., 2017Silva, G. L. S.; Carneiro, M. S. S.; Edvan, R. L.; Andrade, A. P.; Medeiros, G. R.; Cândido, M. J. D. Determining a model to estimate leaf area in pornunça (Manihot sp.) using morphometric measures. Acta Scientiarum. Animal Science, v.39, p.351-256, 2017. https://doi.org/10.4025/actascianimsci.v39i4.36447
https://doi.org/10.4025/actascianimsci.v...
).
Advances in computational science have promoted the rapid growth of methodologies using digital images to estimate the leaf area for many crops (Ferreira et al., 2017Ferreira, O. G. L.; Rossi, F. D.; Vaz, R. Z.; Fluck, A. C.; Costa, O. A. D.; Farias, P. P. Leaf area determination by digital image analysis. Archivos de Zootecnia, v.66, p.593-597, 2017. https://doi.org/10.21071/az.v66i256.2777
https://doi.org/10.21071/az.v66i256.2777...
). However, to date, no studies have used digital images to evaluate the leaf area of pornunça. Thus, the objective of this study was to compare different indirect methods for estimating the leaf area of pornunça.
Material and Methods
The study was conducted from August 2017 to January 2019 at the Universidade Federal Rural de Pernambuco (UFRPE) in the municipality of Serra Talhada, PE, Brazil (07° 57’ 01” S, 38° 17’ 53” W, at an elevation of 429 m).
According to Koppen, the climate regime of the region is a BSwh, with the rainy season occurring during the summer, beginning in November and ending in April. The long-term average annual rainfall is 632.2 mm, with an annual long-term average air temperature of 26 °C and an relative air humidity of 60% (Dubreuil et al., 2018Dubreuil, V.; Fante, K. P.; Planchon, O.; Sant’anna Neto, J. L. Os tipos de climas anuais no Brasil: uma aplicação da classificação de Köppen de 1961 a 2015. Revista Franco-brasileira de Geografia, v.18, p.115-121, 2018. https://doi.org/10.4000/confins.15738
https://doi.org/10.4000/confins.15738...
; Leite et al., 2019Leite, M. L. M. V.; Lucena, L. R. R.; Cruz, M. G.; Sá Júnior, E. H.; Simões, V. J. L. P. Leaf area estimate of Pennisetum glaucum by linear dimensions. Acta Scientiarum. Animal Sciences, v.41, e42808, 2019. https://doi.org/10.4025/actascianimsci.v41i1.42808
https://doi.org/10.4025/actascianimsci.v...
).
The soil in the experimental area was classified as an inceptisol. A composite sample of the superficial layer of 20 cm depth had the following physico-chemical characteristics: pH(water) = 6.80; P (Mehlich) = 40.00 mg dm-3; K+ = 0.45 cmolc dm-3; Na+ = 0.06 cmolc dm-3; Ca2+ = 5.30 cmolc dm-3; Mg2+ = 1.10 cmolc dm-3; H + Al = 1.23 cmolc dm-3; S = 6,91 cmolc dm-3; CTC = 8.14 cmolc dm-3; V% = 84.89%; organic matter = 7.93 g kg-1; sand = 828.6 g kg-1; silt = 148.25 g kg-1; clay = 23.15 g kg-1, and soil density = 1.45 kg dm-3.
The experimental unit (area of 24.0 m2, 5.0 × 4.8 m) was composed of two rows of pornunça (Manihot glaziovii × Manihot esculenta) plants, in which the rows were 1.6 m apart and the plants 1.0 m apart, corresponding to a density of 6250 plants ha-1.
The pornunça plants were established from seedlings planted in 30 cm high plastic bags (Jardim et al., 2018Jardim, A. M. R. F.; Silva, J. P.; Simões, V. J. L. P.; Morais, J. E. F.; Silva, M. J.; Araújo Júnior, G. N.; Izidro, J. L. P. S.; Silva, J. R. I.; Leite, M. L. M. V.; Silva, T. G. F. Inter-relação das características de manivas na propagação vegetativa de Manihot glaziovii em ambiente Semiárido. Pubvet, v.12, p.1-7, 2018. https://doi.org/10.31533/pubvet.v12n9a161.1-7
https://doi.org/10.31533/pubvet.v12n9a16...
). The seedlings were transplanted to the field in October 2017, when they were approximately 20 cm tall. The plants were grown under rainfed conditions without fertilization, and the control of spontaneous plants was carried out manually when necessary.
During the experimental period, five leaves were randomly selected each week to estimate the leaf area. Leaves of different shapes, sizes, positions in the plant, and phenological stages were selected, all free of damage and diseases or pest attacks, following the methodologies described by Schmildt et al. (2014Schmildt, E. R.; Amaral, J. A. T.; Schmildt, O.; Santos, J. S. Análise comparativa de equações para estimativa da área foliar em cafeeiros. Coffee Science, v.9, p.155-167, 2014. ), Lucena et al. (2018Lucena, L. R. R.; Leite, M. L. M. V.; Cruz, M. G.; Sá Junior, E. H. Estimativa da área foliar em Urochloa mosambicensis por dimensões foliares e imagens digitais. Archivos de Zootecnia , v.67, p.408-413, 2018. https://doi.org/10.21071/az.v67i259.3798
https://doi.org/10.21071/az.v67i259.3798...
), Ribeiro et al. (2019Ribeiro, J. E. S.; Coêlho, E. S.; Figueiredo, F. R. A.; Pereira, W. E.; Albuquerque, M. B. Leaf area estimation for Psychotria carthagenensis and Psychotria hoffmannseggiana as a function of linear leaf dimensions. Acta Scientiarum. Biological Sciences, v.41, e43494, 2019. https://doi.org/10.4025/actascibiolsci.v41i1.43494
https://doi.org/10.4025/actascibiolsci.v...
), and Leite et al. (2019Leite, M. L. M. V.; Lucena, L. R. R.; Cruz, M. G.; Sá Júnior, E. H.; Simões, V. J. L. P. Leaf area estimate of Pennisetum glaucum by linear dimensions. Acta Scientiarum. Animal Sciences, v.41, e42808, 2019. https://doi.org/10.4025/actascianimsci.v41i1.42808
https://doi.org/10.4025/actascianimsci.v...
). A total of 150 healthy leaves from 120 plants had their leaf area measured using three indirect methods.
The first method was the linear dimension method (LW and NL). The maximum length (L) and maximum width (W) of the leaves were measured using a digital caliper, and the number of lobes (NL) in the leaves was counted. The maximum length and width generally corresponded to the central and basal leaf, respectively (Figure 1A). The length and width were multiplied to determine the product in cm2 (Lucena et al., 2018Lucena, L. R. R.; Leite, M. L. M. V.; Cruz, M. G.; Sá Junior, E. H. Estimativa da área foliar em Urochloa mosambicensis por dimensões foliares e imagens digitais. Archivos de Zootecnia , v.67, p.408-413, 2018. https://doi.org/10.21071/az.v67i259.3798
https://doi.org/10.21071/az.v67i259.3798...
; Ribeiro et al., 2019Ribeiro, J. E. S.; Coêlho, E. S.; Figueiredo, F. R. A.; Pereira, W. E.; Albuquerque, M. B. Leaf area estimation for Psychotria carthagenensis and Psychotria hoffmannseggiana as a function of linear leaf dimensions. Acta Scientiarum. Biological Sciences, v.41, e43494, 2019. https://doi.org/10.4025/actascibiolsci.v41i1.43494
https://doi.org/10.4025/actascibiolsci.v...
; Leite et al., 2019Leite, M. L. M. V.; Lucena, L. R. R.; Cruz, M. G.; Sá Júnior, E. H.; Simões, V. J. L. P. Leaf area estimate of Pennisetum glaucum by linear dimensions. Acta Scientiarum. Animal Sciences, v.41, e42808, 2019. https://doi.org/10.4025/actascianimsci.v41i1.42808
https://doi.org/10.4025/actascianimsci.v...
).

The second method was the digital image method (DLA). The leaves were photographed using a digital camera (Sony, DSC-P72 model) to generate 150 digital images of 2700 × 2000 pixels (Figure 1A). The third method is the scanned image method (SLA). The leaves were placed in a portable scanner Epson L395 (Figure 1B). The digital photographs and the scanned images were processed using Image J software, where the images were transformed into black and white scales. The black area of the images was used to calculate the leaf area in the image (cm2) (Jadoski et al., 2012Jadoski, S. O.; Lopes, E. C.; Maggi, M. F.; Suchoronczek, A.; Saito, L. R.; Denega, S. Método de determinação da área foliar da cultivar de batata ágata a partir de dimensões lineares. Semina: Ciências Agrárias, v.33, p.2545-2554, 2012. https://doi.org/10.5433/1679-0359.2012v33Supl1p2545
https://doi.org/10.5433/1679-0359.2012v3...
; Lucena et al., 2018Lucena, L. R. R.; Leite, M. L. M. V.; Cruz, M. G.; Sá Junior, E. H. Estimativa da área foliar em Urochloa mosambicensis por dimensões foliares e imagens digitais. Archivos de Zootecnia , v.67, p.408-413, 2018. https://doi.org/10.21071/az.v67i259.3798
https://doi.org/10.21071/az.v67i259.3798...
). To obtain the correction factor of pixels in cm², a digital photo of a 10 × 10 cm square of the same dimension of the images of the pornunça leaves was taken, and the area was calculated in pixels² (equivalent to 0.00833 cm²).
After the leaf measurements and images were taken, the leaves were harvested, placed in a polystyrene container with ice, and transported to the laboratory (5 min from the field). In the laboratory, the leaf area was measured using the gravimetric method, which is defined as a reference method corresponding to the real leaf area (RLA). The leaf was spread on a millimeter graph paper, its outline was drawn on the paper, the paper was cut with scissors along the outline, and the paper piece was transferred to an electronic scale to be weighed. In the same study, a 10 × 10 cm square was cut, weighing 0.630 g. Considering the proportion of the area and the weight of the square, it was possible to calculate the leaf area of each leaf based on the weight of the piece of paper corresponding to its outline (Leite et al., 2019Leite, M. L. M. V.; Lucena, L. R. R.; Cruz, M. G.; Sá Júnior, E. H.; Simões, V. J. L. P. Leaf area estimate of Pennisetum glaucum by linear dimensions. Acta Scientiarum. Animal Sciences, v.41, e42808, 2019. https://doi.org/10.4025/actascianimsci.v41i1.42808
https://doi.org/10.4025/actascianimsci.v...
).
Regression models (linear, gamma, and power) were adjusted to the data obtained using three indirect methods to find the most effective model to predict the real leaf area (Leite et al., 2019Leite, M. L. M. V.; Lucena, L. R. R.; Cruz, M. G.; Sá Júnior, E. H.; Simões, V. J. L. P. Leaf area estimate of Pennisetum glaucum by linear dimensions. Acta Scientiarum. Animal Sciences, v.41, e42808, 2019. https://doi.org/10.4025/actascianimsci.v41i1.42808
https://doi.org/10.4025/actascianimsci.v...
). It was assumed that the linear and power models had a normal distribution, as the response of the dependent variable was in the range (-∞, ∞), linear with a gamma distribution, assuming that the response of the dependent variable is in the range (0; ∞).
Regression models used to explain the digital leaf area (DLA) and scanner (SLA) in relation to the explanatory variables: real leaf area (RLA) and product length by width (LW) are described below:
Linear models:
Gamma models:
Power models:
where:
DLAi - represents the i-th digital leaf area of the pornunça;
SLAi - the i-th scanned leaf area of the pornunça;
RLAi - the i-th real leaf area of the pornunça;
LWi - product of the length and width of the i-th pornunça leaf.
εi - i-th error interrelated to the digital and scanned leaf area, where εi exhibits a normal distribution of mean 0 and variance constant σ² > 0 to the linear, power model, and gamma distribution of parameters α and β for the gamma models; and,
β0 and β1 - parameters related to the model.
The power model regression used to explain the real leaf area (RLA) and digital leaf area (DLA) in relation to the explanatory variables: product length by width (LW) and the number of lobes (NL) are described below:
where:
εi - i-th error related to the real and digital leaf area, where εi exhibits a normal distribution of mean 0 and variance constant σ² > 0; and,
β0, β1 and β2 - parameters related to the power model.
The following performance indices were used as criteria to compare the models with the real leaf area and to choose the best model: a higher coefficient of determination of the model (R²), lower Akaike’s information criterion (AIC) defined by Akaike (1974Akaike, H. A new look at the statistical model identification. IEEE Transactions on Automatic Control, v.19, p.716-723, 1974. https://doi.org/10.1109/TAC.1974.1100705
https://doi.org/10.1109/TAC.1974.1100705...
), a lower sum of squares of residuals (SSR), and higher Willmott index (d) defined by Willmott (1981Willmott, C. J. On the validation of models. Physical Geography, v.2, p.184-194, 1981. https://doi.org/10.1080/02723646.1981.10642213
https://doi.org/10.1080/02723646.1981.10...
).
The coefficient of determination is expressed by:
The Akaike information criterion (AIC) is defined as follows:
The sum of squares of the residuals (SSR) is defined by the following expression:
The d index is expressed by:
where:
L(x\θ) - maximum likelihood function, defined as the product of the density, and p is the number of model parameters;
Yi - values of the i-th digital or scanned leaf area of the pornunça after model adjustment;
Y - mean of the values for the leaf area, thus digital (Yi) or scanned (Yi); and,
n - number of observations (leaves).
To evaluate the correlations between the variables RLA, DLA, SLA, and LW, the Pearson correlation coefficient was used (Leite et al., 2020Leite, M. L. M. V.; Lucena, L. R. R.; Oliveira, A. D. M.; Costa, A. C. L.; Anjos, F. L. Q.; Farias, I. M.; Simões, V. J. L. P.; Almeida, M. C. R. Cladode area and weight of Nopalea cochenillifera clones as a function of morphometric characteristics. Journal of the Profissional Association for Cactus Development, v.22, p.18-28, 2020.), described by:
where:
Yi and Xi - i-th observations of variables; and,
Y and X - means of the variables Y and X, respectively.
The statistical program R version 3.5.3 was used for all analyses.
Results and Discussion
The descriptive statistical analysis for the different methods used to determine the leaf area in the pornunça plants is shown in Table 1. The highest mean leaf area was observed in the real leaf area (RLA) (136.42 cm²), indicating that all indirect methods slightly underestimated the leaf area when compared to RLA.
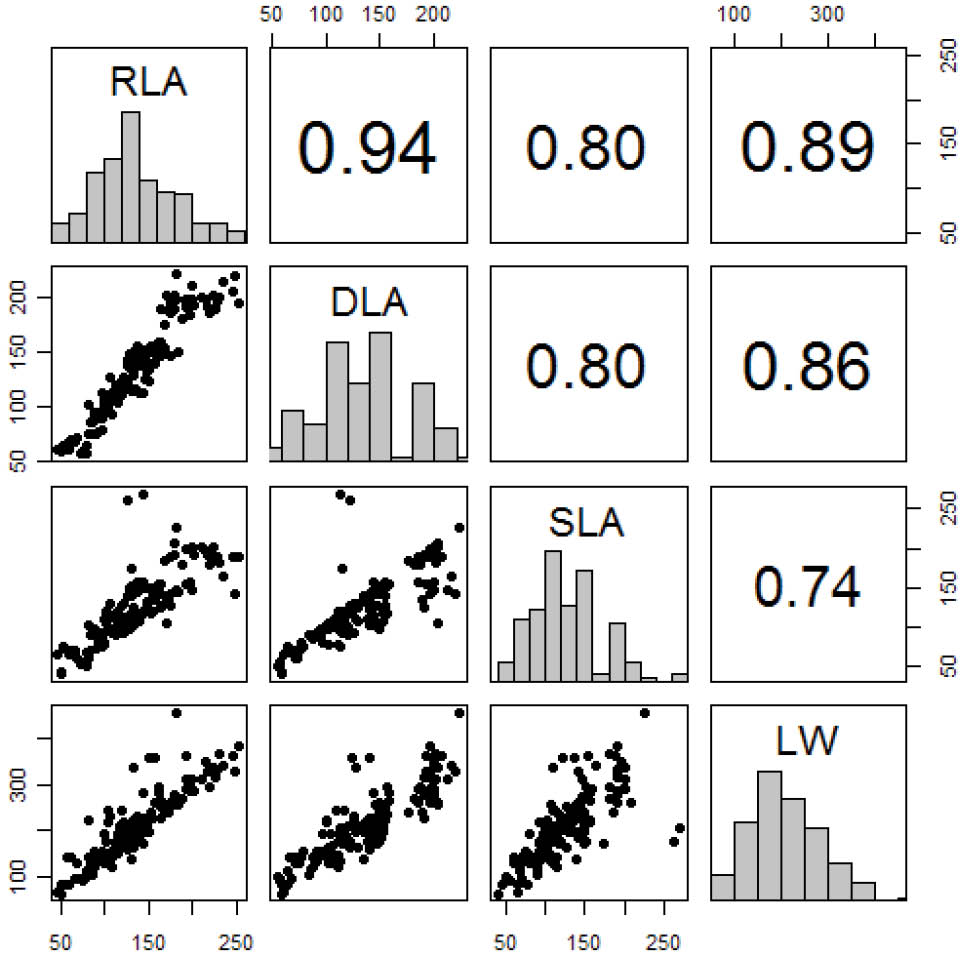
The highest positive correlation was observed for RLA and digital leaf area (DLA) (r = 0.94; p ≤ 0.0001), but high positive correlations were also observed between RLA and length by width (LW) and scanned leaf area (SLA) (Figure 2). DLA was positively correlated with LW (r = 0.89; p ≤ 0.0001) and SLA (r = 0.80; p ≤ 0.0001) and SLA with LW (r = 0.74; p ≤ 0.0001).

Correlation matrix between variables in pornunça: real leaf area (RLA), digital leaf area (DLA), scanned leaf area (SLA), and product of length by width (LW)
Using linear measurements, the power model was the best explanatory model for estimating the leaf area in pornunça, with an R² of 0.99, while the linear model had an R² of 0.97, and the gamma model had an R² of 0.74. The highest sum square residuals (SSR) and the lowest Akaike information criterion (AIC) were observed in the linear regression model. In contrast, the lowest SSR and AIC values were obtained for the power model. The Willmott index (d) was very similar among the regression models evaluated. The linear model exhibited a Willmott index (d) of 0.9400, similar to those of the power and gamma models, 0.9421 and 0.939, respectively (Table 2).
Leite et al. (2019Leite, M. L. M. V.; Lucena, L. R. R.; Cruz, M. G.; Sá Júnior, E. H.; Simões, V. J. L. P. Leaf area estimate of Pennisetum glaucum by linear dimensions. Acta Scientiarum. Animal Sciences, v.41, e42808, 2019. https://doi.org/10.4025/actascianimsci.v41i1.42808
https://doi.org/10.4025/actascianimsci.v...
) evaluated the relationship between RLA and LW of millet genotype IPA BULK 1BF and concluded that the linear, gamma, and power models exhibited a power of explanation of 99.25%, 96.07%, and 99.96%, respectively. The results of this study were more accurate than those reported by Silva et al. (2017Silva, G. L. S.; Carneiro, M. S. S.; Edvan, R. L.; Andrade, A. P.; Medeiros, G. R.; Cândido, M. J. D. Determining a model to estimate leaf area in pornunça (Manihot sp.) using morphometric measures. Acta Scientiarum. Animal Science, v.39, p.351-256, 2017. https://doi.org/10.4025/actascianimsci.v39i4.36447
https://doi.org/10.4025/actascianimsci.v...
) when estimating the leaf area of euphorbiaceous forage species. Guimarães et al. (2019Guimarães, M. J. M.; Coelho Filho, M. A.; Gomes Junior, F. A.; Silva, M. A. M.; Alves, C. V. O.; Lopes, I. Modelos matemáticos para a estimativa da área foliar de mandioca. Revista de Ciências Agrárias, v.62, p.1-5, 2019. https://doi.org/10.22491/rca.2019.3015
https://doi.org/10.22491/rca.2019.3015...
) found that for the evaluation of 17 cassava genotypes, the linear model had the best adjustment when the product between the length and width of the central lobe was used.
Figure 3 shows the values used to estimate the real leaf area of pornunça using the product of the length and width of the leaves. The points in black represent the real leaf area, and the color points are the estimated values based on the regression equations (linear, power, and gamma models).

Adjustments of models (linear, power, and gamma) using the product of the length by the width of the leaf top to estimate the leaf area of pornunça
The performance indices of the models used to estimate the real leaf area (RLA) using the digital leaf area (DLA) and scanned (SLA) methods are shown in Table 3. The DLA explained the RLA in a linear regression model with the highest R² of 0.99, while the lowest R² was observed for SLA using the gamma model 0.83. The linear model had SSR, AIC, and d indices of 32679.10, 1222.81, and 0.9689, respectively, while the power model had 32475.21, 226.75 0.9689, and the gamma models had 33765.64, 1207.80, and 0.9684, respectively (Table 3).
These results corroborate those reported by Lucena et al. (2018Lucena, L. R. R.; Leite, M. L. M. V.; Cruz, M. G.; Sá Junior, E. H. Estimativa da área foliar em Urochloa mosambicensis por dimensões foliares e imagens digitais. Archivos de Zootecnia , v.67, p.408-413, 2018. https://doi.org/10.21071/az.v67i259.3798
https://doi.org/10.21071/az.v67i259.3798...
), who observed an R² of 0.99 for a linear model and 0.99 for a power model when they evaluated the relationship of DLA and RLA in Urochloa mosambicensis. Similarly, Flumignan et al. (2008Flumignan, D. L.; Adami, M.; Faria, R. T. Área foliar de folhas íntegras e danificadas de cafeeiro determinada por dimensões foliares e imagem digital. Coffe Science, v.3, p.1-6, 2008. ) verified that the relationship between DLA and RLA in coffee trees using a power model had an R² of 0.99 and a d index of 0.9998.
Among the methods of imagery, the highest R² values were observed using DLA with a power model; overall, the R² varied between 0.83 using SLA in a gamma model to 0.99 in DLA using a power model. A similar pattern was observed using other criteria of adequacy.
Figures 4A and B show the relationships between leaf area as a function of real leaf area, as well as the adjustments to the linear, power, and gamma models.

Adjustment of different models used to estimate the leaf area in pornunça: digital (A) and scanned (B) method
The relationship between DLA and SLA to explain the leaf area estimated by the LW measurements is shown in Table 4. Overall, the power models had higher R² values than the other regression models, and the lowest R² values were observed in the gamma models. A similar pattern was observed for the other performance indices.
A similar methodology was used by Jadoski et al. (2012Jadoski, S. O.; Lopes, E. C.; Maggi, M. F.; Suchoronczek, A.; Saito, L. R.; Denega, S. Método de determinação da área foliar da cultivar de batata ágata a partir de dimensões lineares. Semina: Ciências Agrárias, v.33, p.2545-2554, 2012. https://doi.org/10.5433/1679-0359.2012v33Supl1p2545
https://doi.org/10.5433/1679-0359.2012v3...
) to determine the leaf area in potato plants. The authors found that the linear regression model had an R² value of 0.93. The results observed in the present research corroborate these studies, with R2 of 0.97 and 0.94 in the linear model, to estimate the digital leaf area and the scanned leaf area, respectively.
Toebe et al. (2012Toebe, M.; Cargnelutti Filho, A.; Loose, L. H.; Heldwein, A. B.; Zanon, A. J. Área foliar de feijão-vagem (Phaseolus vulgaris L.) em função de dimensões foliares. Semina: Ciências Agrárias , v.33, p.2491-2500, 2012. https://doi.org/10.5433/1679-0359.2012v33Supl1p2491
https://doi.org/10.5433/1679-0359.2012v3...
) used the software Sigma Scan Pro v. 5.0 to estimate the digital leaf area of Phaseolus vulgaris L. and obtained an R² of 0.98 for the linear model and 0.98 for the power model. In the present research, using the Image J software, values of R2 of 0.97 and 0.99 were obtained for the linear and power models, respectively.
The best values for the performance indices were observed for the DLA method using the power model: the highest values for the coefficient of determination (0.99) and Willmott index (0.9276), associated with the lowest values of the Akaike information criterion (113.49) and the sum of squares of residuals (73067.51). On the other hand, the least useful values were observed for the SLA method using the gamma model (Table 4).
The linear models also resulted in the highest R² (Silva et al., 2013Silva, W. L.; Costa, J. P. R.; Caputti, G. P.; Galzerano, L.; Ruggieri, A. C. Medidas lineares do limbo foliar dos capins xaraés e massai para a estimativa da área foliar. Biotemas, v.26, p.11-18, 2013. https://doi.org/10.5007/2175-7925.2013v26n3p11
https://doi.org/10.5007/2175-7925.2013v2...
) when used to estimate the leaf area of panicum grass using a scanner or the product of the length and width of the leaf. In the research, the power model was the best adjusted to estimate the leaf area in pornunça, with R2 of 0.98 and 0.99 for the scanned images and the product length x width methods, respectively.
Figure 5 show the relationships of the digital leaf area (Figure 5A) and scanned leaf area (Figure 5B) as a function of product length by width, as well as the adjustments of linear, power, and gamma models.

Adjustments of models for digital leaf area (A) and scanned leaf area (B) by the product of the length by the width of the pornunça leaves
Based on the performance indices, the best relationship between the DLA, SLA, and RLA was obtained using the power model. To obtain an even better estimate of the real leaf area, the number of lobes (NL) was incorporated as an explanatory variable associated with the L and W measurements. Overall, the number of lobes as an explanatory variable increased the capacity to explain the models used. It is important to mention that the power model using LW measurements had the smallest SSR among all the methods and all models (Table 5).
Figure 6 shows the relationship between the real leaf area (Figure 6A) and the digital leaf area (Figure 6B) using the power regression model, highlighting the high positive correlation observed between the models and the estimated variables.

Relationship between real leaf area (A) and digital leaf area (B) using as estimative a power regression model as explanatory variables as the product between length by width (LW) and the number of lobes (NL)
Silva et al. (2017Silva, G. L. S.; Carneiro, M. S. S.; Edvan, R. L.; Andrade, A. P.; Medeiros, G. R.; Cândido, M. J. D. Determining a model to estimate leaf area in pornunça (Manihot sp.) using morphometric measures. Acta Scientiarum. Animal Science, v.39, p.351-256, 2017. https://doi.org/10.4025/actascianimsci.v39i4.36447
https://doi.org/10.4025/actascianimsci.v...
) observed that the number of lobes associated with the product of the length by the leaf width significantly increased the accuracy of the model of estimation of the real leaf area of pornunça.
The same results were found when the relationship between DLA, SLA, and LW was analyzed in other plants (Lucena et al., 2018Lucena, L. R. R.; Leite, M. L. M. V.; Cruz, M. G.; Sá Junior, E. H. Estimativa da área foliar em Urochloa mosambicensis por dimensões foliares e imagens digitais. Archivos de Zootecnia , v.67, p.408-413, 2018. https://doi.org/10.21071/az.v67i259.3798
https://doi.org/10.21071/az.v67i259.3798...
). The methods and models identified in the present study may contribute to studies that involve the growth and development of pornunça since leaf area is a fundamental variable for research in these areas, ratifying the conclusions of Ribeiro et al. (2019Ribeiro, J. E. S.; Coêlho, E. S.; Figueiredo, F. R. A.; Pereira, W. E.; Albuquerque, M. B. Leaf area estimation for Psychotria carthagenensis and Psychotria hoffmannseggiana as a function of linear leaf dimensions. Acta Scientiarum. Biological Sciences, v.41, e43494, 2019. https://doi.org/10.4025/actascibiolsci.v41i1.43494
https://doi.org/10.4025/actascibiolsci.v...
).
Conclusions
The digital image, using the power model (Y= LW0.77NL0.49, where L and W are the leaf length and width, and NL is the number of lobes in the leaf) was the best non-destructive method for estimating the leaf area in pornunça plants.
Literature Cited
- Achten, W. M. J.; Maes, W. H.; Reubens, B.; Mathijs, E.; Singh, V. P.; Verchot, L. V.; Muys, B. Biomass production and allocation in Jatropha curcas L. seedlings under different levels of drought stress. Biomass and Bioenergy, v.34, p.667-676, 2010. https://doi.org/10.1016/j.biombioe.2010.01.010
» https://doi.org/10.1016/j.biombioe.2010.01.010 - Akaike, H. A new look at the statistical model identification. IEEE Transactions on Automatic Control, v.19, p.716-723, 1974. https://doi.org/10.1109/TAC.1974.1100705
» https://doi.org/10.1109/TAC.1974.1100705 - Alencar, F. H. H.; Silva, D. S.; Andrade, A. P.; Carneiro, M. S. S.; Feitosa, J. V. Composição química e digestibilidade da pornunça sob duas fontes de adubação orgânica e cortes. Revista Caatinga, v.28, p.215-222, 2015. https://doi.org/10.1590/1983-21252015v28n324rc
» https://doi.org/10.1590/1983-21252015v28n324rc - Aquino, L. A.; Santos Junior, V. C.; Guerra, J. V. S.; Costa, M. M. Estimativa da área foliar do girassol por método não destrutivo. Bragantia, v.70, p.832-836, 2011. https://doi.org/10.1590/S0006-87052011000400015
» https://doi.org/10.1590/S0006-87052011000400015 - Cargnelutti Filho, A.; Toebe, M.; Burin, C.; Fick, A. L.; Neu, I. M. M.; Facco, G. Estimação de área foliar de mucuna cinza por meio de método não-destrutivo. Ciência Rural, v.42, p.238-242, 2012. https://doi.org/10.1590/S0103-84782012000200009
» https://doi.org/10.1590/S0103-84782012000200009 - Dubreuil, V.; Fante, K. P.; Planchon, O.; Sant’anna Neto, J. L. Os tipos de climas anuais no Brasil: uma aplicação da classificação de Köppen de 1961 a 2015. Revista Franco-brasileira de Geografia, v.18, p.115-121, 2018. https://doi.org/10.4000/confins.15738
» https://doi.org/10.4000/confins.15738 - Ferreira, O. G. L.; Rossi, F. D.; Vaz, R. Z.; Fluck, A. C.; Costa, O. A. D.; Farias, P. P. Leaf area determination by digital image analysis. Archivos de Zootecnia, v.66, p.593-597, 2017. https://doi.org/10.21071/az.v66i256.2777
» https://doi.org/10.21071/az.v66i256.2777 - Flumignan, D. L.; Adami, M.; Faria, R. T. Área foliar de folhas íntegras e danificadas de cafeeiro determinada por dimensões foliares e imagem digital. Coffe Science, v.3, p.1-6, 2008.
- Francisco, J. P.; Diotto, A. V.; Folegatti, M. V.; Silva, L. D. B.; Piedade, S. M. S. Estimativa da área foliar do abacaxizeiro cv. Vitória por meio de relações alométricas. Revista Brasileira de Fruticultura, v.36, p.285-293, 2014. https://doi.org/10.1590/0100-2945-216/13
» https://doi.org/10.1590/0100-2945-216/13 - Guimarães, M. J. M.; Coelho Filho, M. A.; Gomes Junior, F. A.; Silva, M. A. M.; Alves, C. V. O.; Lopes, I. Modelos matemáticos para a estimativa da área foliar de mandioca. Revista de Ciências Agrárias, v.62, p.1-5, 2019. https://doi.org/10.22491/rca.2019.3015
» https://doi.org/10.22491/rca.2019.3015 - Jadoski, S. O.; Lopes, E. C.; Maggi, M. F.; Suchoronczek, A.; Saito, L. R.; Denega, S. Método de determinação da área foliar da cultivar de batata ágata a partir de dimensões lineares. Semina: Ciências Agrárias, v.33, p.2545-2554, 2012. https://doi.org/10.5433/1679-0359.2012v33Supl1p2545
» https://doi.org/10.5433/1679-0359.2012v33Supl1p2545 - Jardim, A. M. R. F.; Silva, J. P.; Simões, V. J. L. P.; Morais, J. E. F.; Silva, M. J.; Araújo Júnior, G. N.; Izidro, J. L. P. S.; Silva, J. R. I.; Leite, M. L. M. V.; Silva, T. G. F. Inter-relação das características de manivas na propagação vegetativa de Manihot glaziovii em ambiente Semiárido. Pubvet, v.12, p.1-7, 2018. https://doi.org/10.31533/pubvet.v12n9a161.1-7
» https://doi.org/10.31533/pubvet.v12n9a161.1-7 - Leite, M. L. M. V.; Lucena, L. R. R.; Cruz, M. G.; Sá Júnior, E. H.; Simões, V. J. L. P. Leaf area estimate of Pennisetum glaucum by linear dimensions. Acta Scientiarum. Animal Sciences, v.41, e42808, 2019. https://doi.org/10.4025/actascianimsci.v41i1.42808
» https://doi.org/10.4025/actascianimsci.v41i1.42808 - Leite, M. L. M. V.; Lucena, L. R. R.; Oliveira, A. D. M.; Costa, A. C. L.; Anjos, F. L. Q.; Farias, I. M.; Simões, V. J. L. P.; Almeida, M. C. R. Cladode area and weight of Nopalea cochenillifera clones as a function of morphometric characteristics. Journal of the Profissional Association for Cactus Development, v.22, p.18-28, 2020.
- Lima, R. T.; Souza, P. J. O. P.; Rodrigues, J. C.; Lima, M. J. A. Modelos para estimativa da área foliar da mangueira utilizando medidas lineares. Revista Brasileira de Fruticultura , v.34, p.974-980, 2012. https://doi.org/10.1590/S0100-29452012000400003
» https://doi.org/10.1590/S0100-29452012000400003 - Lucena, L. R. R.; Leite, M. L. M. V.; Cruz, M. G.; Sá Junior, E. H. Estimativa da área foliar em Urochloa mosambicensis por dimensões foliares e imagens digitais. Archivos de Zootecnia , v.67, p.408-413, 2018. https://doi.org/10.21071/az.v67i259.3798
» https://doi.org/10.21071/az.v67i259.3798 - Morgado, M. A. D.; Bruckner, C. H.; Rosado, L. D. S.; Assunção, W.; Santos, C. E. M. Estimação da área foliar por método não destrutivo, utilizando medidas lineares das folhas de espécies de Passiflora. Revista Ceres, v.60, p.662-667, 2013. https://doi.org/10.1590/S0034-737X2013000500009
» https://doi.org/10.1590/S0034-737X2013000500009 - Ribeiro, J. E. S.; Coêlho, E. S.; Figueiredo, F. R. A.; Pereira, W. E.; Albuquerque, M. B. Leaf area estimation for Psychotria carthagenensis and Psychotria hoffmannseggiana as a function of linear leaf dimensions. Acta Scientiarum. Biological Sciences, v.41, e43494, 2019. https://doi.org/10.4025/actascibiolsci.v41i1.43494
» https://doi.org/10.4025/actascibiolsci.v41i1.43494 - Schmildt, E. R.; Amaral, J. A. T.; Schmildt, O.; Santos, J. S. Análise comparativa de equações para estimativa da área foliar em cafeeiros. Coffee Science, v.9, p.155-167, 2014.
- Silva, G. L. S.; Carneiro, M. S. S.; Edvan, R. L.; Andrade, A. P.; Medeiros, G. R.; Cândido, M. J. D. Determining a model to estimate leaf area in pornunça (Manihot sp.) using morphometric measures. Acta Scientiarum. Animal Science, v.39, p.351-256, 2017. https://doi.org/10.4025/actascianimsci.v39i4.36447
» https://doi.org/10.4025/actascianimsci.v39i4.36447 - Silva, W. L.; Costa, J. P. R.; Caputti, G. P.; Galzerano, L.; Ruggieri, A. C. Medidas lineares do limbo foliar dos capins xaraés e massai para a estimativa da área foliar. Biotemas, v.26, p.11-18, 2013. https://doi.org/10.5007/2175-7925.2013v26n3p11
» https://doi.org/10.5007/2175-7925.2013v26n3p11 - Toebe, M.; Cargnelutti Filho, A.; Loose, L. H.; Heldwein, A. B.; Zanon, A. J. Área foliar de feijão-vagem (Phaseolus vulgaris L.) em função de dimensões foliares. Semina: Ciências Agrárias , v.33, p.2491-2500, 2012. https://doi.org/10.5433/1679-0359.2012v33Supl1p2491
» https://doi.org/10.5433/1679-0359.2012v33Supl1p2491 - Willmott, C. J. On the validation of models. Physical Geography, v.2, p.184-194, 1981. https://doi.org/10.1080/02723646.1981.10642213
» https://doi.org/10.1080/02723646.1981.10642213 - Zanetti, S.; Pereira, L. F. M.; Sartori, M. M. P.; Silva, M. A. Leaf area estimation of cassava from linear dimensions. Anais da Academia Brasileira de Ciências, v.89, p.1729-1736, 2017.
-
1 Research developed at Universidade Federal Rural de Pernambuco, Serra Talhada, PE, Brazil
Edited by
Publication Dates
-
Publication in this collection
23 Aug 2021 -
Date of issue
Nov 2021
History
-
Received
03 July 2020 -
Accepted
01 May 2021 -
Published
30 May 2021

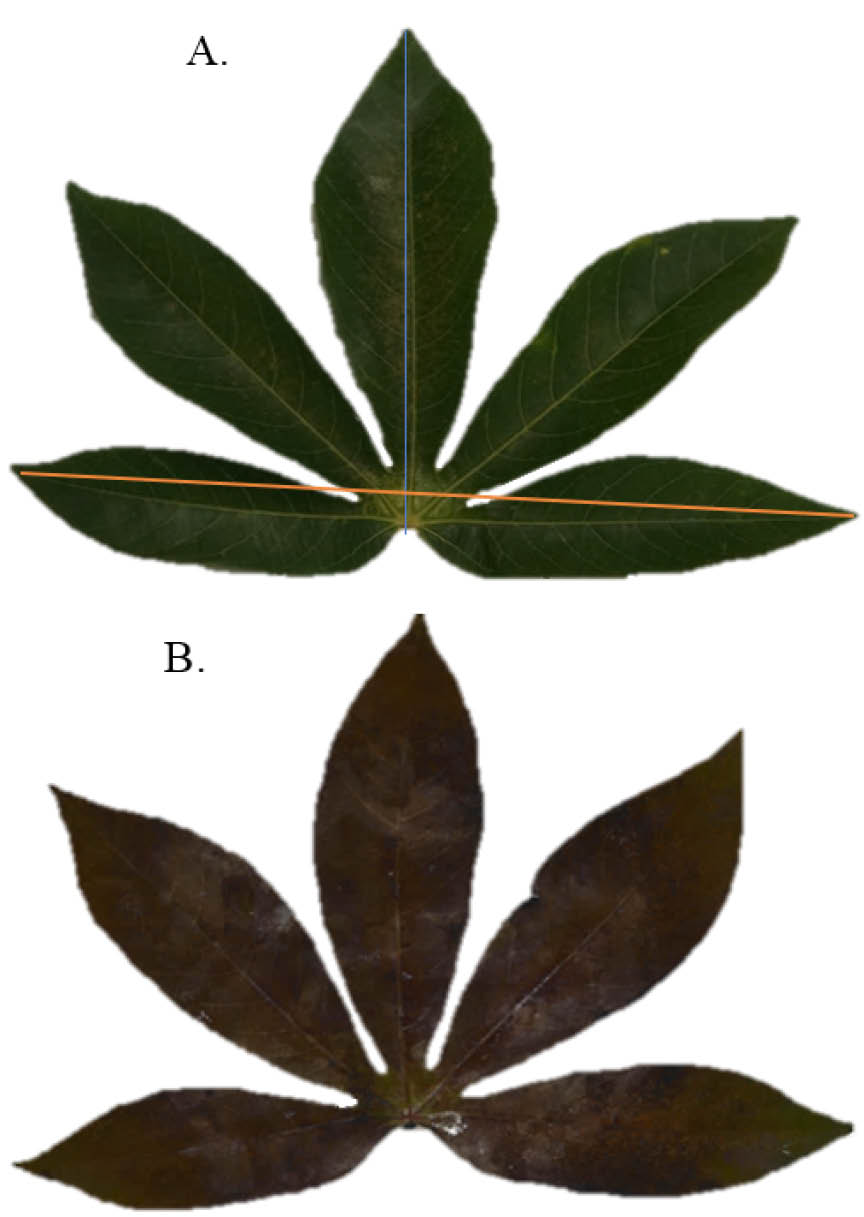 The blue line indicates the length, and the orange line indicates the width measured in the pornunça leaves