
ABSTRACT
The leaf area is a parameter of fundamental importance in studies on plant growth and physiology. The objective of this study was to build allometric equations for the accurate and fast estimation of sapodilla leaf areas. In total, 250 leaves of different shapes and sizes were collected from sapodilla matrices trees growing at the Universidade Federal Rural do Semi-Árido, Mossoró-RN, Brazil. For each leaf, the length, width, product of length and width (LW), product of length and length, product of width and width, and leaf area were measured. Linear and nonlinear models were used to construct the allometric equations. The best equations were chosen on the basis of the following criteria: the highest coefficient of determination, Pearson’s linear correlation coefficient, and Willmott’s index of agreement; and the lowest Akaike information criterion and root mean square error. It was verified that the models that used the LW value presented the best criteria for estimating the leaf area. Specifically, the equations ŷ = 0.664 × LW1.018 and ŷ = 0.713 × LW, which use LW values, are the most suitable for estimating the leaf area of sapodilla quickly and accurately.
Key words:
Manilkara zapota L.; biometrics; regression models; Sapotaceae
RESUMO
A área foliar é um parâmetro de fundamental importância para estudos relacionados ao crescimento e fisiologia vegetal. O objetivo do trabalho foi construir equações alométricas que permitam estimar com precisão e rapidez a área foliar do sapotizeiro. Foram coletadas 250 folhas de diferentes formas e tamanhos em árvores matrizes de sapotizeiro localizadas na Universidade Federal Rural do Semi-Árido, Mossoró-RN, Brazil. Em cada folha, foi mensurado o comprimento, largura, produto entre comprimento e largura (LW), produto entre comprimento e comprimento, produto entre largura e largura, e área foliar. Modelos lineares e não lineares foram utilizados para construção das equações alométricas. As melhores equações foram escolhidas com base nos seguintes critérios: maior coeficiente de determinação, coeficiente de correlação linear de Pearson e índice de concordância de Willmott, e menor critério de informação de Akaike e raiz do quadrado médio do erro. Diante disso, verificou-se que os modelos que utilizaram o produto entre comprimento e largura apresentaram os melhores critérios para estimar a área foliar do sapotizeiro. Buscando reduzir o tempo das análises e maior precisão dos dados, as equações ŷ = 0.664 × LW1.018 e ŷ = 0.713 × LW e utilizando LW são as mais indicadas para estimar a área foliar do sapotizeiro.
Palavras-chave:
Manilkara zapota L.; biometria; modelos de regressão; Sapotaceae
HIGHLIGHTS:
The sapodilla leaf area can be estimated using a nondestructive method based on allometric equations.
Models that use the product of the leaf length and width present the best criteria for estimating the leaf area.
The equations LA = 0.664 × LW1.018 and LA = 0.713 × LW accurately and quickly estimate the sapodilla leaf area.
Introduction
Among the fruits of nutritional importance, sapodilla (Manilkara zapota L.; family Sapotaceae) is an exotic species with known antioxidative properties. The sapodilla trees are cultivated widely in pantropical regions for their wood (used for various purposes, including the creation of artisanal products), fresh fruits, and latex (Moura et al., 2019Moura, B. I. de V.; Araújo, B. P. L. de; Sa, R. D.; Randau, K. P. Pharmacobotanical study of Manilkara zapota (L.) P. Royen (Sapotaceae). Brazilian Journal of Pharmaceutical Sciences, v.55, p.1-10, 2019. https://doi.org/10.1590/s2175-97902019000117227
https://doi.org/10.1590/s2175-9790201900...
). For the continued expansion of sapodilla, studies are needed to estimate its growth, physiology, and productivity.
The leaf area (LA), which is an essential parameter for studies of plant physiology and ecology, is directly related to vital plant processes, such as photosynthetic efficiency, water balance, respiration, and the interception of light energy (Tondjo et al., 2015Tondjo, K.; Brancheriau, L.; Sabatier, S.; Kokutse, A. D.; Akossou, A.; Kokou, K.; Fourcaud, T. Non-destructive measurement of leaf area and dry biomass in Tectona grandis. Trees, v.29, p.1625-1631, 2015. https://dx.doi.org/10.1007/s00468-015-1227-y
https://dx.doi.org/10.1007/s00468-015-12...
). LA measurements can be obtained either directly (using a digital meter or scanner) or indirectly (Zhang, 2020Zhang, W. Digital image processing method for estimating leaf length and width tested using kiwifruit leaves (Actinidia chinensis Planch). PloS one, v.15, p.1-14, 2020. https://doi.org/10.1371/journal.pone.0235499
https://doi.org/10.1371/journal.pone.023...
). The direct methods involve the destruction of samples, which renders successive measurements unfeasible and incurs high costs (Liu et al., 2017Liu, Z.; Zhu, Y.; Li, F.; Jin, G. Non-destructively predicting leaf area, leaf mass and specific leaf area based on a linear mixed-effect model for broadleaf species. Ecological Indicators, v.78, p.340-350, 2017. https://doi.org/10.1016/j.ecolind.2017.03.025
https://doi.org/10.1016/j.ecolind.2017.0...
). By contrast, the indirect method involves the application of regression models based on the linear dimensions of the leaves, making it a nondestructive, economical, and effective technique that allows measurement of the LA throughout the plant growth cycle (Hernández-Fernandéz et al., 2021Hernández-Fernandéz, I. A.; Jarma-Orozco, A.; Pompelli, M. F. Allometric models for non-destructive leaf area measurement of stevia: An in depth and complete analysis. Horticultura Brasileira, v.39, p.205-215, 2021. https://doi.org/10.1590/s0102-0536-20210212
https://doi.org/10.1590/s0102-0536-20210...
).
In studies on fruit trees, the LA indicates the relationship of the leaf surface with the fruit weight, quality, and maturation and estimation of production attributes (Keramatlou et al., 2015Keramatlou, I.; Sharifani, M.; Sabouri, H.; Alizadeh, M.; Kamkar, B. A simple linear model for leaf area estimation in Persian walnut (Juglans regiaL.). Scientia Horticulturae, v.184, p.36-39, 2015. http://dx.doi.org/10.1016/j.scienta.2014.12.017
http://dx.doi.org/10.1016/j.scienta.2014...
). Studies with a focus on LA estimations have been carried out on other fruit trees, such as vines (Teobaldelli et al., 2020Teobaldelli, M.; Rouphael, Y.; Gonnella, M.; Buttaro, D.; Rivera, C. M.; Muganu, M.; Colla, G.; Basile, B. Developing a fast and accurate model to estimate allometrically the total shoot leaf area in grapevines. Scientia Horticulturae , v.259, p.1-9, 2020. https://doi.org/10.1016/j.scienta.2019.108794
https://doi.org/10.1016/j.scienta.2019.1...
) and cashew trees (Gomes et al., 2020Gomes, R. G.; Silva, D. F. P. da; Ragagnin, A. L. S. L.; Souza, P. H. M. de; Cruz, S. C. S. Leaf area estimation of Anacardium humile. Revista Brasileira de Fruticultura, v.42, p.1-8, 2020. http://dx.doi.org/10.1590/0100-29452020628
http://dx.doi.org/10.1590/0100-294520206...
).
Although LA estimation through regression models is easy to apply, there are still no studies on the application of this indirect method for sapodilla crops. Regression models may provide information for subsequent studies on this species. Therefore, the objective of this study was to build allometric equations that allow for the fast and accurate estimation of the sapodilla LA.
Material and Methods
This study was performed using sapodilla trees grown in the didactic orchard of the Center of Agrarian Sciences, Federal Rural University of the Semi-Arid Region, Rio Grande do Norte, Brazil (5° 11’ S, 37° 20’ W). The climate in this region is classified as BSh and is considered dry and very hot, with a dry season and summer rain (Alvares et al., 2013Alvares, C. A.; Stape, J. L.; Sentelhas, P. C.; Gonçalves, J. L. de M.; Sparovek, G. Köppen’s climate classification map for Brazil. Meteorologische Zeitschrift, v.22, p.711-728, 2013. https://doi.org/10.1127/0941-2948/2013/0507
https://doi.org/10.1127/0941-2948/2013/0...
). The average temperature is approximately 28 °C, and annual rainfall is approximately 695 mm. The soil in the experimental area is classified as Eutrophic Red-Yellow Argisol (Ultisol).
In total, 250 leaves were randomly collected from 15 matrices of M. zapota trees. Expanded, healthy, pest-free, and disease-free leaves or leaves with damage caused by biotic or abiotic related factors were selected (Ribeiro et al., 2022aRibeiro, J. E. da S.; Nóbrega, J. S.; Coêlho, E. dos S.; Dias, T. J.; Melo, M. F. Estimating leaf area of basil cultivars through linear dimensions of leaves. Ceres, v.69, p.139-147, 2022a. http://dx.doi.org/10.1590/0034-737X202269020003
http://dx.doi.org/10.1590/0034-737X20226...
). Leaves of different shapes and sizes were selected to test the generality of the model and to obtain significantly more variability in the sample data. Immediately after collection, the leaf samples were packed in plastic bags and kept in the shade to maintain their turgidity.
The leaves were digitized using a table scanner (model OKI ES5162LP MFP) with a 1,200 × 1,200 DPI resolution. The images were processed, contrasted, and analyzed individually using ImageJ software (National Institutes of Health, USA) according to the methodology described by Ribeiro et al. (2018Ribeiro, J. E. da S.; Barbosa, A. J. S.; Albuquerque, M. B. de. Leaf area estimate of Erythroxylum simonis Plowman by linear dimensions. Floresta e Ambiente, v.25, p.243-250, 2018. https://doi.org/10.1590/2179-8087.010817
https://doi.org/10.1590/2179-8087.010817...
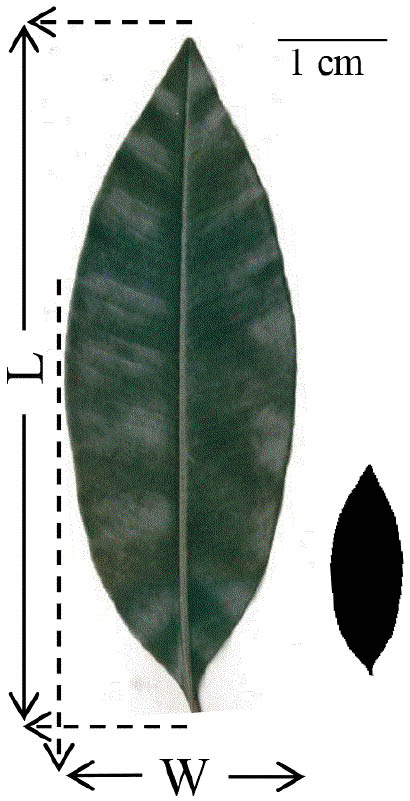
). During the scanning of the images, rules graduated in centimeters were included on each sheet as indicators of the reference scale for the analyses. For each leaf, the maximum length (L) (cm) (distance between the insertion end of the petiole and the opposite distance of the central rib) and maximum width (W) (cm) (superior measure perpendicular to the central rib) were measured for calculation of the actual (observed) LA (cm²) (Figure 1). Then, using the length and width data, the product of length and width (LW) (cm²), product of length and length (LL) (cm²), and product of width and width (WW) (cm²) were calculated.

On the basis of the variance inflation factor (VIF) (Eq. 1) (Marquaridt, 1970Marquaridt, D. W. Generalized inverse, ridge regression, biased linear estimation and nonlinear estimation. Technometrics, v.12, p.591-612, 1970. https://doi.org/10.1080/00401706.1970.10488699
https://doi.org/10.1080/00401706.1970.10...
) and tolerance value (T) (Eq. 2) (Gill, 1986Gill, J. L. Outliers, residuals, and influence in multiple regression. Journal of Animal Breeding and Genetics, v.103, p.161-175, 1986. https://doi.org/10.1111/j.1439-0388.1986.tb00079.x
https://doi.org/10.1111/j.1439-0388.1986...
), the degree of collinearity between the linear parameters of the leaves (L and W) was evaluated to verify the accuracy of the regression coefficient estimates. A variance inflation factor of greater than 10 and a tolerance value of less than 0.1 indicate that the length (L) and width (W) data have multicollinearity, which may affect the estimation of the LA; therefore, one of these parameters should be excluded for the adjustment of the regression models for LA estimation (Gill, 1986).
where:
r - correlation coefficient between L and W;
VIF - variance inflation factor; and,
T - tolerance value.
Tests of 90 linear and nonlinear regression models were performed to estimate the LA (dependent variable) as a function of the linear dimensions of the leaves (L, W, LW, LL, and WW) (independent variables). Logarithmic and polynomial models from the second to fifth order were excluded, leaving 16 models that presented satisfactory criteria in addition to high accuracy and speed of analysis.
The regression models tested were as follows: linear (ŷ = β0 + β1 × x + εi); linear without an intercept (ŷ = β1 × x + εi); power (ŷ = β0 × xβ1 + εi); and exponential (ŷ = β0 × β1 x + εi). The value of ŷ estimates the LA as a function of x, which corresponds to the linear dimensions of the leaves (L, W, LW, LL, and WW). Student’s t-test (with a probability value of 0.05) was used to test the following H0 hypotheses: β0 = 0 versus Ha: β0 ≠ 0; and H0: β1 = 0 versus Ha: β1 ≠ 1, where β0 and β1 are regression coefficients.
The best models for estimating the LA of sapodilla were chosen on the basis of the following criteria: a higher coefficient of determination (R²) (Eq. 3), a higher Pearson linear correlation coefficient (r) (Eq. 4), a lower Akaike information criterion (AIC) (Eq. 5), a higher Willmott agreement index (d) (Eq. 6), and a lower root of the mean error square (RMSE) (Eq. 7).
where:
R² - coefficient of determination;
r - Pearson linear correlation coefficient;
AIC - Akaike information criterion;
d - Willmott agreement index;
RMSE - root of the mean error square;
ŷi - estimated values of leaf area;
yi - observed values of leaf area;
yi - average of the observed values;
y’i = ŷi - y; y’i = yi - y; L(x\θ) - maximum likelihood function;
p - number of model parameters;
n - number of observations;
xi and yi - i-th observations of the variables y and x; and,
y and x - means of variables y and x.
Descriptive analyses were performed to calculate the minimum, maximum, and average values; amplitude; standard deviation; standard error; asymmetry; shortness; and coefficient of variation. Data normality was verified using the Shapiro-Wilk test (Shapiro & Wilk, 1965Shapiro, S. S.; Wilk, M. B. Analysis of variance test for normality (complete samples). Biometrika, v.52, p.591-611, 1965.). The observed and estimated LAs were compared using Student’s t-test for paired samples (p < 0.01). Statistical analyses of the data were performed using R® v.4.1.2 (R Core Team, 2022R Core Team. R: A language and environment for statistical computing. Vienna: R Foundation for Statistical Computing, 2022.).
Results and Discussion
The sapodilla leaves varied in length of between 3.70 and 16.25 cm, with an average of 9.55 cm and amplitude of 12.55 cm (Figure 2A). The leaf width varied between 1.58 and 5.94 cm, with a mean of 3.42 cm and an amplitude of 4.36 cm (Figure 2B). The LW values ranged from 5.87 to 94.85 cm², with an average of 34.41 cm² and amplitude of 88.98 cm² (Figure 2C). The LL values varied between 13.72 and 264.19 cm², with a mean of 96.54 and an amplitude of 250.47 cm² (Figure 2D). The WW values ranged from 2.51 to 35.29 cm², with an average of 12.42 cm² and amplitude of 32.78 cm² (Figure 2E). The actual LA values ranged between 4.22 and 70.86 cm², with an average of 24.47 cm² and amplitude of 66.64 cm² (Figure 2F). The lowest coefficients of variation were observed for leaf length and width, 24.37 and 24.90%, respectively (Figures 2A and B). The highest data variability was recorded for the LW (47.53%), LL (47.92%), WW (50.15%), and actual LA (48.34%) values (Figures 2C, D, E and F).

Descriptive analysis of the length (A), width (B), product of length and width (LW) (C), product of length and length (LL) (D), product of width and width (WW) (E), and leaf area (LA) (F) of 250 sapodilla leaves
A wide variability in LW, LL, WW, and LA data is of fundamental importance for studies involving regression models for estimating the LA of fruit species (Oliveira et al., 2017Oliveira, P. S.; Silva, W.; Costa, A. A. M.; Schmildt, E. R.; Vitória, E. L. da. Leaf area estimation in litchi by means of allometric relationships. Revista Brasileira de Fruticultura , v.39, p.1-6, 2017. https://doi.org/10.1590/0100-29452017403
https://doi.org/10.1590/0100-29452017403...
; Gomes et al., 2020Gomes, R. G.; Silva, D. F. P. da; Ragagnin, A. L. S. L.; Souza, P. H. M. de; Cruz, S. C. S. Leaf area estimation of Anacardium humile. Revista Brasileira de Fruticultura, v.42, p.1-8, 2020. http://dx.doi.org/10.1590/0100-29452020628
http://dx.doi.org/10.1590/0100-294520206...
). High data variability allows for the construction of more representative models and precise equations that can be applied for leaves of different shapes and sizes, which can be measured at different phenological stages during the plant life cycle (Cargnelutti Filho et al., 2021Cargnelutti Filho, A.; Pezzini, R. V.; Neu, I. M. M.; Dumke, G. E. Estimation of buckwheat leaf area by leaf dimensions. Semina Ciências Agrárias, v.42, p.1529-1548, 2021. https://doi.org/10.5433/1679-0359.2021v42n3Supl1p1529
https://doi.org/10.5433/1679-0359.2021v4...
). The collection of a large number of leaves (250 leaves) from different parts of the matrices was considered to be ideal for constructing models that estimate the LA of sapodilla as a function of linear measurements of leaves. Previous studies have confirmed that the use of a low number of samples to build allometric models can lead to the generation of biased equations with low reliability for estimating the LA (Antunes et al., 2008Antunes, W. C.; Pompelli, M. F.; Carretero, D. M.; DaMatta, F. M. Allometric models for non-destructive leaf area estimation in coffee (Coffea arabica and Coffea canephora). Annals of Applied Biology, v.153, p.33-40, 2008. https://doi.org/10.1111/j.1744-7348.2008.00235.x
https://doi.org/10.1111/j.1744-7348.2008...
; Pompelli et al., 2012Pompelli, M. F.; Antunes, W. C.; Ferreira, D. T. R. G.; Cavalcante, P. P. G. S.; Wanderley-Filho, H. C. L.; Endres, L. Allometric models for non-destructive leaf area estimation of the Jatropha curcas. Biomass and Bioenergy, v.36, p.77-85, 2012. https://doi.org/10.1016/j.biombioe.2011.10.010
https://doi.org/10.1016/j.biombioe.2011....
).
The kurtosis coefficients (k) of LW, LL, WW, and LA presented a platykurtic distribution, which was flatter than the normal distribution (k > 3.26). By contrast, the length data presented a leptokurtic distribution (k < 3.26), whereas the width data exhibited a mesokurtic one (k = 3.26) (Figure 2). The high p-values of the normality test (p ≥ 0.05), combined with the magnitude of the mean about the median and asymmetry, characterized a suitable adjustment of the length and width data to the normal distribution. The asymmetry of the LW, LL, WW, and LA data indicated a higher frequency of leaves with values approaching the minimum and a lower frequency of those with values close to the maximum, confirming the non-normality of the data (Ribeiro et al., 2022bRibeiro, J. E. da S.; Figueiredo, F. R. A.; Nóbrega, J. S.; Coêlho, E. dos S.; Melo, M. F. Leaf area of Erythrina velutina Willd. (Fabaceae) through allometric equations. Revista Floresta, v.52, p.93-102, 2022b. http://dx.doi.org/10.5380/rf.v52i1.78059
http://dx.doi.org/10.5380/rf.v52i1.78059...
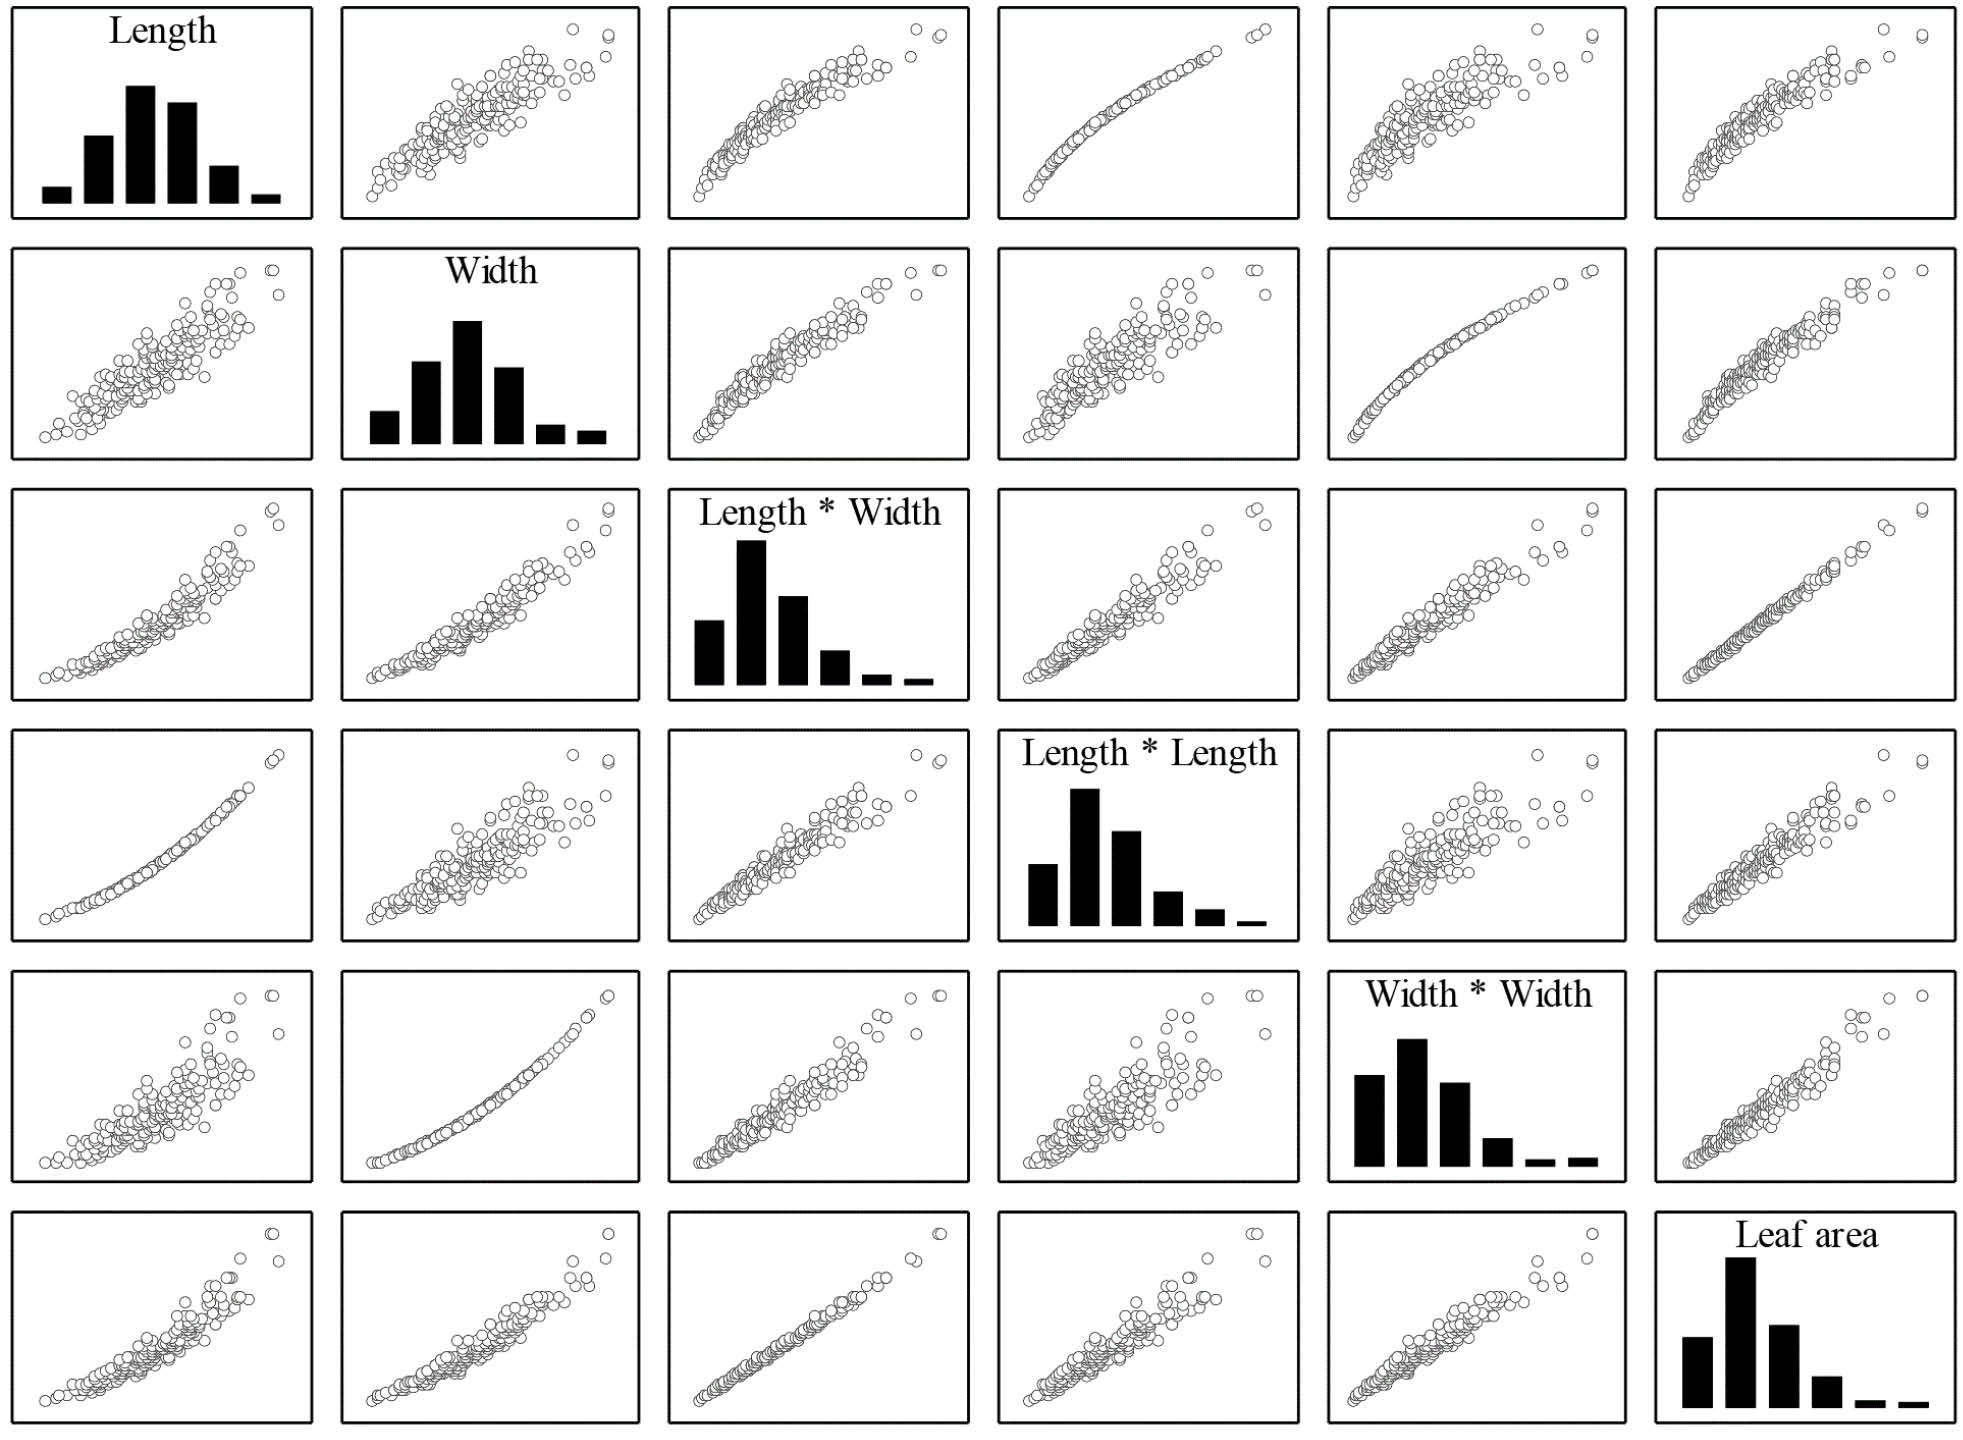
). Linear and nonlinear association patterns between the L, W, LW, LL, WW, and LA values were observed in the dataset used to construct the predicted regression models for LA estimation (Figure 3). Linear patterns were observed between LW and LA, LL and LA, and WW and LA, whereas nonlinear patterns were evident between L and LA and W and LA (Figure 3), indicating the need for different regression models for data adjustment and validation.

Frequency histograms (diagonal) and data dispersion between the length, width, product of length and width, product of length and length, product of width and width, and leaf area of 250 sapodilla leaves used to build equations for estimating the leaf area
The variance inflation factor (VIF) values ranged between 0.004 and 0.139, whereas the tolerance (T) values ranged from 7.165 to 217.64. Thus, for all constructed models, the variance inflation factor values were less than 10 and the tolerance values were greater than 0.10, indicating that the collinearity between the length and width data was negligible and these parameters were valid for use in the regression models (Gill, 1986Gill, J. L. Outliers, residuals, and influence in multiple regression. Journal of Animal Breeding and Genetics, v.103, p.161-175, 1986. https://doi.org/10.1111/j.1439-0388.1986.tb00079.x
https://doi.org/10.1111/j.1439-0388.1986...
; Fanourakis et al., 2021Fanourakis, D.; Kazakos, F.; Nektarios, P. A. Allometric individual leaf area estimation in chrysanthemum. Agronomy, v.11, p.795, 2021. https://doi.org/10.3390/agronomy11040795
https://doi.org/10.3390/agronomy11040795...
).
The models presented coefficient of determination (R²) values of above 0.86, indicating that at least 86% of the variations in sapodilla LA were explained by the equations proposed for the estimation (Table 1). The equations that used the LW value presented the best criteria for estimating the LA of the species, giving the best fits of the regression models (Macário et al., 2020Macário, A. P. S.; Ferraz, R. L. de S.; Costa, P. da S.; Brito Neto, J. F. de; Melo, A. S. de; Dantas Neto, J. Allometric models of estimating Moringa oleífera leaflets area. Ciência e Agrotecnologia, v.44, p.1-10, 2020. https://doi.org/10.1590/1413-7054202044005220
https://doi.org/10.1590/1413-70542020440...
; Goergen et al., 2021Goergen, P. C. H.; Lago, I.; Schwab, N. T.; Alves, A. F.; Freitas, C. P. de O.; Verlaine, S.; Selli, V. S. Allometric relationship and leaf area modeling estimation on chia by non-destructive method. Revista Brasileira de Engenharia Agrícola e Ambiental, v.25, p.305-311, 2021. https://doi.org/10.1590/1807-1929/agriambi.v25n5p305-311
https://doi.org/10.1590/1807-1929/agriam...
). The exception was the exponential model, where the best criteria were observed in the equation in which the WW value was used (Ribeiro et al., 2020Ribeiro, J. E. da S.; Coêlho, E. dos S.; Figueiredo, F. R. A.; Melo, M. F. Non-destructive method for estimating leaf area of Erythroxylum pauferrense (Erythroxylaceae) from linear dimensions of leaf blades. Acta Botanica Mexicana, v.127, p.1-12, 2020. https://doi.org/10.21829/abm127.2020.1717
https://doi.org/10.21829/abm127.2020.171...
).
Models, regression coefficients (β0 and β1), coefficient of determination (R²), Pearson’s linear correlation coefficient (r), Akaike information criterion (AIC), Willmott agreement index (d), root mean square error (RMSE), and equations for estimating the leaf area (LA) of sapodilla as a function of linear leaf dimensions (length and width)
The criteria used to choose the best equations for estimating the LA of sapodilla through linear dimensions of the leaves confirmed that the power model and the linear model without the intercept, both constructed using the LW values, were the quickest and most accurate. These models showed the highest coefficients of determination (R²) (0.9991 and 0.9954), Pearson’s linear correlation coefficients (r) (0.9977 and 0.9976), and Willmott agreement indexes (d) (0.9988 and 0.9988) and the lowest Akaike information criterion (AIC) (560.75 and 567.08) and root mean square error values (RMSE) (0.7998 and 0.8108) (Table 1). Linear and power models were also the most suitable for estimating the LA of other plant species (Tondjo et al., 2015Tondjo, K.; Brancheriau, L.; Sabatier, S.; Kokutse, A. D.; Akossou, A.; Kokou, K.; Fourcaud, T. Non-destructive measurement of leaf area and dry biomass in Tectona grandis. Trees, v.29, p.1625-1631, 2015. https://dx.doi.org/10.1007/s00468-015-1227-y
https://dx.doi.org/10.1007/s00468-015-12...
; Trachta et al., 2020Trachta, M. A.; Zanon, A. J.; Alves, A. F.; Freitas, C. P. O.; Streck, N. A.; Cardoso, P. S.; Rodrigues, L. B. Leaf area estimation with nondestructive method in cassava. Bragantia, p.79, p.472-484, 2020. https://doi.org/10.1590/1678-4499.20200018
https://doi.org/10.1590/1678-4499.202000...
; Montelatto et al., 2021Montelatto, M. B.; Villamagua-Vergara, G. C.; Brito, C. M. de; Castanho, F.; Sartori, M. M.; Silva, M. de A.; Guerra, S. P. S. Bambusa vulgaris leaf area estimation on short-rotation coppice. Scientia Forestalis, v.49, p.1-9, 2021. https://doi.org/10.18671/scifor.v49n129.14
https://doi.org/10.18671/scifor.v49n129....
; Mela et al., 2022Mela, D.; Dias, M. G.; Silva, T. I. da; Ribeiro, J. E. da S.; Martinez, A. C. P.; Zuin, A. H. L. Estimation of Thunbergia grandiflora leaf area from allometric models. Comunicata Scientiae, v.13, p.1-6, 2022. https://doi.org/10.14295/cs.v13.3722
https://doi.org/10.14295/cs.v13.3722...
).
The equations proposed for estimating the LA of sapodilla presented high adjustments of the data (R² > 0.99), in which the residual variance was homogeneous, with little dispersion of the data (Figure 4). The LA data estimated from the constructed equations showed positive correlations with the observed values (measured from the digital images), producing coefficient of determination (R²) values of greater than 0.99 (Figures 5A and C). There were no significant differences between the observed LAs and the values estimated in the indicated models, confirming the significant relationship between the observed and estimated data (Figures 5B and D). Thus, the equations ŷ = 0.664 × LW1.018 (power model) and ŷ = 0.713 × LW (linear model without intercept) are the most suitable for accurately estimating the LA (> 99%) of sapodilla by means of the linear dimensions of the leaf. These two equations can also be used to measure this parameter in different cultivation environments and phenological stages of the species.

Relationship between the observed leaf area and the product of length and width of sapodilla leaves calculated using the models ŷ = 0.664 × LW1.018 and ŷ = 0.713 × LW. An analysis of the dispersion pattern of the residues is presented in the inset

Relationship and comparison (Student’s t-test) between the observed leaf area and the leaf area estimated using the linear model without intercept (A and B) and the power model (C and D) as a function of the product length and width of the sapodilla leaves
Conclusions
-
The leaf area of sapodilla can be estimated with a nondestructive indirect method using allometric equations based on the linear dimensions of the leaves.
-
The equations ŷ = 0.664 × LW1.018 (R² = 0.9991) and ŷ = 0.713 × LW (R² = 0.9954), which use the product of the leaf length and width, are the most suitable for the accurate and quick estimation of the leaf area of sapodilla.
Literature Cited
- Alvares, C. A.; Stape, J. L.; Sentelhas, P. C.; Gonçalves, J. L. de M.; Sparovek, G. Köppen’s climate classification map for Brazil. Meteorologische Zeitschrift, v.22, p.711-728, 2013. https://doi.org/10.1127/0941-2948/2013/0507
» https://doi.org/10.1127/0941-2948/2013/0507 - Antunes, W. C.; Pompelli, M. F.; Carretero, D. M.; DaMatta, F. M. Allometric models for non-destructive leaf area estimation in coffee (Coffea arabica and Coffea canephora). Annals of Applied Biology, v.153, p.33-40, 2008. https://doi.org/10.1111/j.1744-7348.2008.00235.x
» https://doi.org/10.1111/j.1744-7348.2008.00235.x - Cargnelutti Filho, A.; Pezzini, R. V.; Neu, I. M. M.; Dumke, G. E. Estimation of buckwheat leaf area by leaf dimensions. Semina Ciências Agrárias, v.42, p.1529-1548, 2021. https://doi.org/10.5433/1679-0359.2021v42n3Supl1p1529
» https://doi.org/10.5433/1679-0359.2021v42n3Supl1p1529 - Fanourakis, D.; Kazakos, F.; Nektarios, P. A. Allometric individual leaf area estimation in chrysanthemum. Agronomy, v.11, p.795, 2021. https://doi.org/10.3390/agronomy11040795
» https://doi.org/10.3390/agronomy11040795 - Gill, J. L. Outliers, residuals, and influence in multiple regression. Journal of Animal Breeding and Genetics, v.103, p.161-175, 1986. https://doi.org/10.1111/j.1439-0388.1986.tb00079.x
» https://doi.org/10.1111/j.1439-0388.1986.tb00079.x - Goergen, P. C. H.; Lago, I.; Schwab, N. T.; Alves, A. F.; Freitas, C. P. de O.; Verlaine, S.; Selli, V. S. Allometric relationship and leaf area modeling estimation on chia by non-destructive method. Revista Brasileira de Engenharia Agrícola e Ambiental, v.25, p.305-311, 2021. https://doi.org/10.1590/1807-1929/agriambi.v25n5p305-311
» https://doi.org/10.1590/1807-1929/agriambi.v25n5p305-311 - Gomes, R. G.; Silva, D. F. P. da; Ragagnin, A. L. S. L.; Souza, P. H. M. de; Cruz, S. C. S. Leaf area estimation of Anacardium humile Revista Brasileira de Fruticultura, v.42, p.1-8, 2020. http://dx.doi.org/10.1590/0100-29452020628
» http://dx.doi.org/10.1590/0100-29452020628 - Hernández-Fernandéz, I. A.; Jarma-Orozco, A.; Pompelli, M. F. Allometric models for non-destructive leaf area measurement of stevia: An in depth and complete analysis. Horticultura Brasileira, v.39, p.205-215, 2021. https://doi.org/10.1590/s0102-0536-20210212
» https://doi.org/10.1590/s0102-0536-20210212 - Keramatlou, I.; Sharifani, M.; Sabouri, H.; Alizadeh, M.; Kamkar, B. A simple linear model for leaf area estimation in Persian walnut (Juglans regiaL.). Scientia Horticulturae, v.184, p.36-39, 2015. http://dx.doi.org/10.1016/j.scienta.2014.12.017
» http://dx.doi.org/10.1016/j.scienta.2014.12.017 - Liu, Z.; Zhu, Y.; Li, F.; Jin, G. Non-destructively predicting leaf area, leaf mass and specific leaf area based on a linear mixed-effect model for broadleaf species. Ecological Indicators, v.78, p.340-350, 2017. https://doi.org/10.1016/j.ecolind.2017.03.025
» https://doi.org/10.1016/j.ecolind.2017.03.025 - Macário, A. P. S.; Ferraz, R. L. de S.; Costa, P. da S.; Brito Neto, J. F. de; Melo, A. S. de; Dantas Neto, J. Allometric models of estimating Moringa oleífera leaflets area. Ciência e Agrotecnologia, v.44, p.1-10, 2020. https://doi.org/10.1590/1413-7054202044005220
» https://doi.org/10.1590/1413-7054202044005220 - Marquaridt, D. W. Generalized inverse, ridge regression, biased linear estimation and nonlinear estimation. Technometrics, v.12, p.591-612, 1970. https://doi.org/10.1080/00401706.1970.10488699
» https://doi.org/10.1080/00401706.1970.10488699 - Mela, D.; Dias, M. G.; Silva, T. I. da; Ribeiro, J. E. da S.; Martinez, A. C. P.; Zuin, A. H. L. Estimation of Thunbergia grandiflora leaf area from allometric models. Comunicata Scientiae, v.13, p.1-6, 2022. https://doi.org/10.14295/cs.v13.3722
» https://doi.org/10.14295/cs.v13.3722 - Montelatto, M. B.; Villamagua-Vergara, G. C.; Brito, C. M. de; Castanho, F.; Sartori, M. M.; Silva, M. de A.; Guerra, S. P. S. Bambusa vulgaris leaf area estimation on short-rotation coppice. Scientia Forestalis, v.49, p.1-9, 2021. https://doi.org/10.18671/scifor.v49n129.14
» https://doi.org/10.18671/scifor.v49n129.14 - Moura, B. I. de V.; Araújo, B. P. L. de; Sa, R. D.; Randau, K. P. Pharmacobotanical study of Manilkara zapota (L.) P. Royen (Sapotaceae). Brazilian Journal of Pharmaceutical Sciences, v.55, p.1-10, 2019. https://doi.org/10.1590/s2175-97902019000117227
» https://doi.org/10.1590/s2175-97902019000117227 - Oliveira, P. S.; Silva, W.; Costa, A. A. M.; Schmildt, E. R.; Vitória, E. L. da. Leaf area estimation in litchi by means of allometric relationships. Revista Brasileira de Fruticultura , v.39, p.1-6, 2017. https://doi.org/10.1590/0100-29452017403
» https://doi.org/10.1590/0100-29452017403 - Pompelli, M. F.; Antunes, W. C.; Ferreira, D. T. R. G.; Cavalcante, P. P. G. S.; Wanderley-Filho, H. C. L.; Endres, L. Allometric models for non-destructive leaf area estimation of the Jatropha curcas Biomass and Bioenergy, v.36, p.77-85, 2012. https://doi.org/10.1016/j.biombioe.2011.10.010
» https://doi.org/10.1016/j.biombioe.2011.10.010 - R Core Team. R: A language and environment for statistical computing. Vienna: R Foundation for Statistical Computing, 2022.
- Ribeiro, J. E. da S.; Barbosa, A. J. S.; Albuquerque, M. B. de. Leaf area estimate of Erythroxylum simonis Plowman by linear dimensions. Floresta e Ambiente, v.25, p.243-250, 2018. https://doi.org/10.1590/2179-8087.010817
» https://doi.org/10.1590/2179-8087.010817 - Ribeiro, J. E. da S.; Coêlho, E. dos S.; Figueiredo, F. R. A.; Melo, M. F. Non-destructive method for estimating leaf area of Erythroxylum pauferrense (Erythroxylaceae) from linear dimensions of leaf blades. Acta Botanica Mexicana, v.127, p.1-12, 2020. https://doi.org/10.21829/abm127.2020.1717
» https://doi.org/10.21829/abm127.2020.1717 - Ribeiro, J. E. da S.; Figueiredo, F. R. A.; Nóbrega, J. S.; Coêlho, E. dos S.; Melo, M. F. Leaf area of Erythrina velutina Willd. (Fabaceae) through allometric equations. Revista Floresta, v.52, p.93-102, 2022b. http://dx.doi.org/10.5380/rf.v52i1.78059
» http://dx.doi.org/10.5380/rf.v52i1.78059 - Ribeiro, J. E. da S.; Nóbrega, J. S.; Coêlho, E. dos S.; Dias, T. J.; Melo, M. F. Estimating leaf area of basil cultivars through linear dimensions of leaves. Ceres, v.69, p.139-147, 2022a. http://dx.doi.org/10.1590/0034-737X202269020003
» http://dx.doi.org/10.1590/0034-737X202269020003 - Shapiro, S. S.; Wilk, M. B. Analysis of variance test for normality (complete samples). Biometrika, v.52, p.591-611, 1965.
- Teobaldelli, M.; Rouphael, Y.; Gonnella, M.; Buttaro, D.; Rivera, C. M.; Muganu, M.; Colla, G.; Basile, B. Developing a fast and accurate model to estimate allometrically the total shoot leaf area in grapevines. Scientia Horticulturae , v.259, p.1-9, 2020. https://doi.org/10.1016/j.scienta.2019.108794
» https://doi.org/10.1016/j.scienta.2019.108794 - Tondjo, K.; Brancheriau, L.; Sabatier, S.; Kokutse, A. D.; Akossou, A.; Kokou, K.; Fourcaud, T. Non-destructive measurement of leaf area and dry biomass in Tectona grandis Trees, v.29, p.1625-1631, 2015. https://dx.doi.org/10.1007/s00468-015-1227-y
» https://dx.doi.org/10.1007/s00468-015-1227-y - Trachta, M. A.; Zanon, A. J.; Alves, A. F.; Freitas, C. P. O.; Streck, N. A.; Cardoso, P. S.; Rodrigues, L. B. Leaf area estimation with nondestructive method in cassava. Bragantia, p.79, p.472-484, 2020. https://doi.org/10.1590/1678-4499.20200018
» https://doi.org/10.1590/1678-4499.20200018 - Zhang, W. Digital image processing method for estimating leaf length and width tested using kiwifruit leaves (Actinidia chinensis Planch). PloS one, v.15, p.1-14, 2020. https://doi.org/10.1371/journal.pone.0235499
» https://doi.org/10.1371/journal.pone.0235499
-
1 Research developed at Universidade Federal Rural do Semi-Árido, Mossoró, RN, Brazil
Edited by
Publication Dates
-
Publication in this collection
21 Nov 2022 -
Date of issue
Mar 2023
History
-
Received
02 Aug 2022 -
Accepted
21 Oct 2022 -
Published
27 Oct 2022

 aAsymmetry differs from zero by the t-test at 0.05 probability; bKurtosis differs from 3 by the t-test at 0.05 probability; ** - Significant at 0.01 probability; ns - Non-significant; C.V. - Coefficient of variation
 LA - Leaf area; LW - Product of length and width
