Abstract
Chromosome markers were developed for Arachis glandulifera using fluorescence in situ hybridization (FISH) of the 5S and 45S rRNA genes and heterochromatic 4'-6-diamidino-2-phenylindole (DAPI) positive bands. We used chromosome landmarks identified by these markers to construct the first Arachis species ideogram in which all the homologous chromosomes were precisely identified. The comparison of this ideogram with those published for other Arachis species revealed very poor homeologies with all A and B genome taxa, supporting the special genome constitution (D genome) of A. glandulifera. Genomic affinities were further investigated by dot blot hybridization of biotinylated A. glandulifera total DNA to DNA from several Arachis species, the results indicating that the D genome is positioned between the A and B genomes.
chromosome markers; DAPI bands; rDNA loci; dot blot hybridization; genome relationships
PLANT GENETICS
RESEARCH ARTICLE
Characterization of the Arachis (Leguminosae) D genome using fluorescence in situ hybridization (FISH) chromosome markers and total genome DNA hybridization
Germán RobledoI; Guillermo SeijoI, II
IInstituto de Botánica del Nordeste, Corrientes, Argentina
IIFacultad de Ciencias Exactas y Naturales y Agrimensura, Universidad Nacional del Nordeste, Corrientes, Argentina
Send correspondence to Send correspondence to: Guillermo Seijo Instituto de Botánica del Nordeste Casilla de Correo 209, Sargento Cabral 2131 Corrientes, Argentina E-mail: seijo@agr.unne.edu.ar
ABSTRACT
Chromosome markers were developed for Arachis glandulifera using fluorescence in situ hybridization (FISH) of the 5S and 45S rRNA genes and heterochromatic 4'-6-diamidino-2-phenylindole (DAPI) positive bands. We used chromosome landmarks identified by these markers to construct the first Arachis species ideogram in which all the homologous chromosomes were precisely identified. The comparison of this ideogram with those published for other Arachis species revealed very poor homeologies with all A and B genome taxa, supporting the special genome constitution (D genome) of A. glandulifera. Genomic affinities were further investigated by dot blot hybridization of biotinylated A. glandulifera total DNA to DNA from several Arachis species, the results indicating that the D genome is positioned between the A and B genomes.
Key words: chromosome markers, DAPI bands, rDNA loci, dot blot hybridization, genome relationships.
Introduction
The genus Arachis comprises 80 wild species and the cultivated crop Arachis hypogaea L. (Fabales, Leguminosae) commonly known as groundnut or peanut. All Arachis species are native to South America and have been arranged taxonomically into nine sections based on morphological characters and cross-compatibility relationships (Krapovickas and Gregory, 1994). Species within section Arachis are distinguished from those belonging to other sections by having tap roots, erect main stems, prostrate lateral branches, tetrafoliate leaves, vertical pegs and flowers without prominent veins (Krapovickas and Gregory, 1994).
This section comprises 29 wild diploid species (2n = 2x = 20, 2n = 2x = 18) and two allopolyploids entities (2n = 4x = 40), the cultigen A. hypogaea and its presumed wild progenitor Arachis monticola (Krapovickas and Gregory, 1994; Fernández and Krapovickas, 1994; Lavia, 1996, 2000; Peñaloza and Valls, 2005; Valls and Simpson, 2005). Diploid species have received particular attention because they are being used as sources for several agronomic traits, including resistance to various pests and diseases, drought resistance and different life-cycle spans (Singh, 1986; Burow et al., 2001; Simpson, 2001; Mallikarjuna, 2002; Mallikarjuna et al., 2004). For this reason, great efforts have been directed towards understanding the relationships between species, with particular attention to the genetic compatibility between the wild taxa and the cultivated peanut.
Except for the species with 2n = 18, for which the genome identity still remains uncertain, three different genomes have been proposed within section Arachis based on chromosome features and cross-compatibility relationships (Smartt et al., 1978; Singh and Moss, 1982, 1984; Singh, 1986; Stalker, 1991; Singh and Smartt, 1998). Most of the species have symmetric karyotypes, mainly composed of metacentric chromosomes, which have been assigned to either A or the B genome types. The A genome is characterized by a small chromosome pair, the "A chromosome" (Husted, 1931; Smartt et al., 1978) and has been confirmed in 16 wild diploid Arachis species (Fernández and Krapovickas, 1994; Lavia, 1996, 2000; Peñaloza and Valls, 2005). The A genome species also have heterochromatic bands in all, or almost all, of their chromosomes and are homogeneous in their gross karyotype structure (Seijo et al., 2004). The remaining species with a symmetric karyotype do not have the "A chromosome" pair and have been traditionally included in the B genome. These taxa are more diverse in karyotype formula and in the presence and distribution of heterochromatin (Raina and Mukai, 1999; Seijo et al., 2004). Tetraploid species have an AABB genome constitution, and it has been demonstrated that they originated by hybridization of two wild diploid species, one with the A genome and the other with the B genome (Gregory and Gregory, 1976, 1979; Seijo et al., 2007).
The D genome is the third so far described for the section and it has been proposed to be exclusive to Arachis glandulifera. The assignment of a different genome type for this species was mainly based on morphological traits and results from interspecific crossings, using Arachis duranensis (A genome) and Arachis batizocoi (B genome) as representatives of their genome type (Stalker, 1991). Although hybrids have been obtained in low frequency from those crosses, all the plants were highly sterile. However, the chromosome pairing of the hybrids into five to eight bivalents at meiotic metaphase demonstrated a certain degree of homology between the chromosomes of A. glandulifera and those of A. duranensis and A. batizocoi.
According to the available cytogenetic data, A. glandulifera is characterized by an asymmetric karyotype made up of several submetacentric and subtelocentric chromosomes and without the small "A chromosome pair". However, different karyotype formulas have been proposed by different authors for the four populations so far known of this species (Stalker, 1991; Fernández and Krapovickas, 1994). Some of the differences observed in chromosome morphology were attributed to polytypic variation, while others were considered as miss-identification of chromosomes (Fernández and Krapovickas, 1994).
Concerning the genomic relationships, it has been hypothesized that A. glandulifera has evolved from other member of the section through pericentric inversions and/or translocations (Stalker, 1991). In this sense, and from a karyotype point of view, the main candidate would be A. batizocoi, since according to Fernández and Krapovickas (1994) it is the species within section Arachis with the least symmetric karyotype aside from A. glandulifera.
Different analyses using molecular markers have shown a closer relationship between A. glandulifera and the B genome group of species, particularly with A. batizocoi, and a more distant relationship with the A genome species (Milla et al., 2005; Tallury et al., 2005). However, analysis of the plastid trnT-L region has shown that A. glandulifera lies in an unresolved polytomy out of the clusters formed by A and B genome species (Tallury et al., 2005). Additionally, a simple sequence repeat (SSR) analysis by Moretzsohn et al. (2004) showed that A. glandulifera formed a cluster with one 2n = 18 species and with Arachis cruziana. Therefore, the relationship of A. glandulifera with other species within section Arachis is still not well understood. Moreover, in spite of much effort the exact genome identity of A. glandulifera is still unresolved and the molecular methods employed so far have not generated fingerprintings for the D genome.
Detection of rRNA genes by fluorescent in situ hybridization (FISH) has proved to be a useful tool in studies of plant genome organization, chromosome homeologies, cytotaxonomy and evolution (Jiang and Gill, 1994; Moscone et al., 1999; Lim et al., 2000; Nakamura et al., 2001). Raina and Mukai (1999) applied this approach to a few Arachis species and demonstrated that the number of ribosomal rDNA loci is variable. Subsequently, the mapping of these sites and heterochromatic bands provided new information on the genomic characterization and phylogenetic relationship of the group (Seijo et al., 2004). Furthermore, physical mapping of chromosome markers allowed the establishment of several homeologies between species and served as a base for the construction of a comparative FISH-based Arachis genetic map (Seijo et al., 2004).
In the present study, we investigate the genomic affinities of A. glandulifera with representative species of the A and B genomes by comparing several chromosome landmarks and by total genome DNA hybridization. We constructed the first karyotype for an Arachis species in which all the homologous chromosomes were identified by physically mapping the 5S and 45S rRNA gene loci by FISH and by the establishment of heterochromatic 4'-6-diamidino-2-phenylindole (DAPI) positive banding patterns. The cytogenetic landmarks developed allowed a precise characterization of the D genome and the establishment of some homeologies with the published karyotype for other Arachis species. The data provided will contribute to the characterization of wild Arachis species, thereby aiding in understanding the variability contained in the secondary gene pool of A. hypogaea.
Materials and Methods
Plant material and chromosome preparations
Vouchers specimens of the three populations of Arachis glandulifera (population accession numbers SeSn 3263, SeSn 3230 and SeSn 3267) analyzed in the FISH experiments and those of species used in dot blot assays (Table 1) are deposited at the Bolivian National Herbarium (Herbario Nacional de Bolivia - LPB) and at the Herbarium of the Botanical Institute of the Northeast, Argentina (Herbario of the Instituto de Botánica del Nordeste, Argentina - CTES). Ovaries from matured flowers were collected in the field and pretreated with 2 mM 8-hydroxyquinoline (Sigma) for three hours at room temperature (Fernández and Krapovickas, 1994) and then fixed in 3:1 absolute ethanol:glacial acetic acid for a minimum of 12 h at 4 °C. Somatic chromosome spreads were prepared according to Schwarzacher et al. (1980). Ovules were macerated in 1% (w/v) Trichoderma viridae cellulase (Onozuka R-10; Serva, Heidelberg, Germany) plus 10% (w/v) Aspergillus niger pectinase (Sigma) dissolved in 40% (v/v) glycerol in 0.01 M citrate buffer (pH 4.8) at 37 °C for two hours and then squashed in 45% (v/v) aqueous acetic acid. After removal of the coverslip with gas carbon dioxide the slides were air dried, aged for one to two days at room temperature and stored at - 20 °C until use.
Probe labeling and fluorescent in situ hybridization
The 5S rDNA and 45S rDNA loci were localized using the probes amplified from total DNA of A. hypogaea subsp. fastigiata Waldron var. aequatoriana Krapov. and W.C. Gregory (race Zaruma. Ecuador, Quito, Collection Number: Banks, Pietrarelli and Zurita 683). For the 5S rDNA loci were detected by the plasmid clone pA5S, which contains a 326 bp fragment corresponding to 5S rRNA gene repeated unit and the adjacent intergenic spacer of A. hypogaea; amplified using the primers: A5Sfwd (5'-GAG GAATTCTAGGATGGGTGAC-3') and A5Srev (5'-TCC GAATTCTACTCTCGCCC-3'). The 45S rDNA loci were detected using an equimolar mixture of the plasmid clones pA18S and pA26S. The plasmid clone pA18S contains a 1572 bp fragment corresponding to the coding region of the 18S rRNA gene of A. hypogaea, amplified using the primers: A18Sfwd (5'-GCTAATACGTGCAACAAACCCC G-3') and A18Srev (5'-GGACTTCTCACAACGTCGCC G-3'). The plasmid clone pA26S contains a 3366 bp fragment corresponding to the coding region of the 26S rRNA gene of A. hypogaea, amplified using the primers: A26Sfwd (5'-GATTCCCCTAGTAACGGCGAG-3') and A26Srev (5'-TGGATCGTGGCAGCAAGGCC-3'). The three amplified fragments were cloned in pGEM®-T Easy vector (Promega) and their identities were determined by sequencing.
Probes were labeled by nick translation with digoxigenin-11-dUTP (Boehringer) or biotin-11-dUTP (Sigma). Pretreatment of preparations, chromosome and probe denaturation, conditions for the in situ hybridization, post-hybridization washing, blocking and indirect detection by fluorochrome conjugated antibodies were performed according to Moscone et al. (1996). The concentration of each DNA probes used in the hybridization mixes was of 2.5 ng µL-1 to 3.5 ng µL-1. The first set of antibodies consisted of mouse anti-biotin (Dakopatts) and sheep anti-digoxigenin conjugated to fluorescein isothiocyanate (FITC) (Boehringer). The second set of antibodies consisted of rabbit anti-mouse conjugated to tetramethyl-rhodamine isothiocyanate (TRITC) (Dakopatts) and FITC-conjugated rabbit anti-sheep (Dakopatts). Preparations were counterstained and mounted with Vectashield medium (Vector Laboratories, USA) containing 2 mg mL-1 of DAPI. The DAPI counterstaining subsequent to FISH resulted in a C-banding like pattern with major heterochromatic bands fluorescing more intensely, aiding in the chromosome identification (Moscone et al., 1996, 1999). Chromosomes were viewed and photographed with a Leica DMRX epifluorescence microscope (Leica) equipped with a computer-assisted Leica DC 350 digital camera system. Red, green and blue images were captured in black and white using appropriate filters for TRITC, FITC, and DAPI excitation, respectively. Digital images were combined using IM 1000 Leica software and then imported into Photoshop, version 7.0 (Adobe) for final processing.
Karyotype analysis was accomplished using at least five metaphase plates per plant for chromosome measurements using the free version of the MicroMeasure 3.3 program. The centromeric index (CI), calculated as CI = short arm length (µm) x 100/chromosome length (µm), was used to classify the chromosomes as metacentric (µ) with CI = 50 to 37.51, submetacentric (sm) with CI = 37.50 to 25.01 or subtelocentric (st) with CI = 25 to 12.51 (Levan et al., 1964). Different lengths of the same arm (and band/locus, where applicable) from homologous chromosomes were combined, mean values calculated and then represented in the haploid complements of the ideograms. Each chromosome pair was ordered in groups according to morphology and within each group by decreasing size. Accordingly, they were named from D1 to D10, where D is used in reference to the D genome. Intercalary markers were mapped using the di index calculated as di = d x 100/a, where d = distance (µm) of band center from the centromere and a = length (µm) of the corresponding chromosome arm (Greilhuber and Speta, 1976).
Dot blot assays
Genomic DNA of 11 wild diploid species belonging either to the A or B genomes and to the cultigen A. hypogaea (Table 1) were spotted onto Zeta-Probe nylon membranes (Bio-Rad). Representative diploid species having the A genome were selected according to the groups proposed by Gregory and Gregory (1976), and those bearing the B genome considering their geographical distribution and the presence or absence of heterochromatic bands in their karyotypes. For each species three dots with 0.50, 0.25 and 0.125 µg of genomic DNA were applied to the membrane, which was then incubated in pre-hybridization solution (containing: formamide, 60% (v/v); SDS, 7% (w/v); Na2HPO4, 0.12 M (pH 7.2); NaCl, 0.25 M; EDTA, 1 mM) at 37 °C for 1 h. For hybridization, 600 ng of A. glandulifera (Accession number: SeSn 3263) denatured biotinylated total DNA was added to the pre-hybridization solution and incubated at 37 °C overnight. Post-hybridization washes were performed in 2x standard saline citrate (SSC), 0.5x SSC and 0.2x SSC for 5 min each at room temperature (all washing solution contained 0.1% (w/v) SDS). Under this stringency condition, at least 80% to 85% identity of nucleotide sequence is necessary for hybridization. Hybridized biotinylated DNA was visualized by colorimetric detection using streptavidin/alkaline phosphatase conjugate (Amersham Biosciences) and SIGMA FAST NBT-BCIP (Sigma). All chemicals from Sigma unless otherwise stated.
Results
Chromosome identification and construction of a detailed ideogram
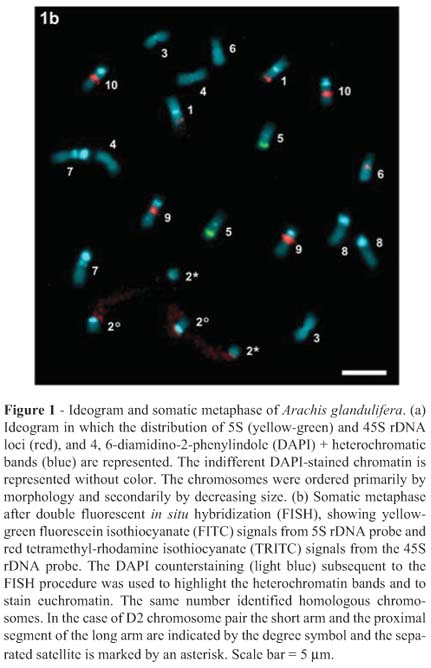
A consensus ideogram based on the measurements of the metaphases from five plants of three analyzed populations, together with the chromosome markers generated by mapping the rDNA loci and the DAPI+ heterochromatic blocks was developed (Figure 1a). The karyotype formula was 8 m + 4 sm + 8 st (Table 2), with a chromosome length ranging between 3.36 µm and 4.65 µm and a mean length of the haploid karyotype of 38.22 µm ± 6.32 µm. The indexes of asymmetry A1 and A2 revealed a moderate degree of intrachromosomal asymmetry (A1 = 0.49), but low interchromosomal asymmetry (A2 = 0.09).

The D2 chromosome pair bore a macrosatellite in the long arm and displayed an extended paracentromeric secondary constriction. Eight chromosome pairs had DAPI+ heterochromatic bands and the total amount of this type of heterochromatin per haploid karyotype was 13.09%. The bands were mainly pericentromeric, but they showed variable size and intensity allowing homologous identification (Figure 1b). Subtelocentric chromosomes had the biggest heterochromatic blocks, reaching up to 29.05% of the chromosome length in the D7 pair. The remaining chromosomes bearing bands had small and faint blocks corresponding to less than 7.78% of the total length, except for the satellited chromosomes that showed a medium-sized band (Table 2). The D7 pair was characterized by the presence of two heterochromatic blocks, one pericentromeric and the other interstitial, whereas the D5 pair was unique since it presented only an interstitial band. The chromosomes without bands corresponded to the metacentric D4 and submetacentric D6 pairs, which are the smallest of the karyotype.
All the plants of the three populations showed a similar heterochromatin distribution, except for one interstitial band: this variation corresponding to an intrapopulation polymorphism detected in the subtelocentric D10 chromosomes. In most plants analyzed this chromosome pair had only a pericentromeric DAPI+ band, however an additional heterochromatic band was observed in the interstitial position on the long arm of the D10 chromosomes in one SeSn 3263 plant.
The in situ hybridization revealed only one 5S rDNA locus located in a subterminal position on the long arms of the D5 pair in all the accessions analyzed, although up to ten loci for the 45S rRNA genes were observed (Figure 1b). Chromosome pair D2 was hybridized all along the extended secondary constrictions, indicating that they bore the ribosomal gene clusters participating in the formation of the nucleolus in the preceding interphase. The D9 and D10 subtelocentric pairs presented high-intensity interstitial hybridization sites on the long arms, while faint signals were observed in subterminal position on the short arms of pair D1 and in the interstitial position on the long arms of D6 pair. The pattern of signal intensity for the 45S rDNA sites described was constant for all the analyzed metaphases. However, some differences in the number of 45S rDNA sites were observed between populations. The largest number of sites observed in the metaphases analysed was ten for the A. glandulifera accession SeSn 3263, whereas accession SeSn 3230 presented eight sites and SeSn 3267 six sites. The differences found corresponded to the absence of the subterminal hybridization sites on chromosome pair D1 for accessions SeSn 3267 and SeSn 3230, and an interstitial site on chromosome pair D6 for accession SeSn 3267.
Genome affinity of A. glandulifera with other species of section Arachis was investigated using the patterns of genomic DNA hybridization between A. glandulifera and 11 wild diploid species (Figure 2). Biotinylated DNA of A. glandulifera showed a strong hybridization signal with most of the species at the higher DNA concentrations dots (0.25 µg and 0.50 µg), hampering the determination of any genome affinity. Nevertheless, hybridization differences were evident in the dots with 0.125 µg of DNA. The A genome Arachis trinitensis, Arachis kuhlmannii and Arachis kempff-mercadoi and the B genome Arachis ipaensis and Arachis williamsi presented the strongest signals, whereas the hybridizations of the remaining species were weak. The only species which showed very low affinity with A. glandulifera at any DNA concentration was Arachis decora, which belongs to the small group of species having 2n = 18 chromosomes.
Discussion
Genomic inferences by means of chromosome analysis consider that species with homologous genomes may show similar karyotypes and display similar patterns of chromosome markers as opposed to those with dissimilar genomic backgrounds. Based on this, we used molecular cytogenetic techniques to explore the chromosomes of A. glandulifera and obtain valuable information to test the uniqueness of its genome within section Arachis, and whether-or -not any karyotype affinity with other species could be established. The bulk of chromosome markers found allowed the unequivocal identification of all the complement pairs and the construction of the first wholly-resolved Arachis ideogram, which could not only be a useful reference for the location of new chromosomal markers but also to correlate the Arachis genetic linkage map with physical chromosomes.
The karyotype formula of 8 m + 4 sm + 8 st for A. glandulifera revealed by FISH was similar to that reported by Fernández and Krapovickas (1994). The small differences in chromosome morphology observed could be explained as an artifact caused by the proteinase treatment used for chromosome permeation (Schwarzacher and Heslop-Harrison, 2000).
The unimodality of the A. glandulifera karyotype, shown by a low A2 index is a character shared with all other species of the section, although the moderate degree of intrachromosomal asymmetry (A1) is a distinguishing trait of this taxon.
Our DAPI banding analysis demonstrated a very characteristic pattern of heterochromatin distribution. The presence of big heterochromatic blocks at pericentromeric and interstitial positions on the subtelocentric chromosomes, including up to one third of the length of the longest chromosomes of the karyotype, were not observed in any other species of Arachis. In spite of these large blocks, the percentage of total heterochromatin per haploid karyotype (13.09%) is just below that observed for other A or B genome diploid species with heterochromatic bands (Seijo et al., 2004). The maintenance of the amount of heterochromatin per haploid genome in A. glandulifera resides in the fact that two pairs of its complement have no DAPI+ bands.
It has been shown that Arachis species usually have all, or almost all, the chromosomes of the complement with pericentromeric bands (A genome species) or without bands (B genome species) (Raina and Mukai, 1999; Seijo et al., 2004). Within the latter group, A. batizocoi is an exception since it has heterochromatic bands in all chromosome pairs except one (Seijo et al., 2004). This feature, together with the fact that the small A chromosomes are absent in D genome species, show that the complement of A. batizocoi is the most similar to that of A. glandulifera.
The analysis of 45S rRNA genes demonstrated that A. glandulifera has the highest number of sites so far described for any diploid species of Arachis. The larger 45S rDNA locus on the active nucleolar-organizing regions of chromosome D2 is similar in size and position to the active sites of other species of the section. However, the interstitial position of the non-active sites in chromosomes with bands is a special feature of A. glandulifera. In other species, when interstitial sites were observed, they were exclusively borne by one pair of unbanded chromosomes (Seijo et al., 2004). The only exception is A. batizocoi, which has interstitial loci of 45S rRNA genes on two chromosome pairs with heterochromatic bands. Therefore, according to the chromosome mapping of these genes, A. batizocoi also appears as the species having the most similar karyotype to A. glandulifera. The 5S rRNA gene clusters have always been reported in paracentromeric position in all the Arachis species so far analyzed (Seijo et al., 2004), thus the distal position of these loci on the long arms of chromosome pair D5 is also an exclusive character of A. glandulifera.
The FISH signal strength of a particular locus is positively related to the number of copies of the repeated sequences present in the cluster (Moscone et al., 1999 and references included in it). Taking in account this relationship, the fact that signal intensity of the 45S rDNA sites on chromosome pairs D1 and D6 of A. glandulifera accession SeSn 3263 was very poor may indicate that these clusters have a low number of copies. Moreover, according to this rationale, loci number differences between accessions of different provenance could be attributed to either true polymorphism or the presence of loci with copy number below the minimum sequence size resolved by in situ hybridization.
Chromosome homeologies have been established between species of the same genome type, and to a less extent between species of the A and B genome groups (Seijo et al., 2004). Comparison of the A. glandulifera ideogram with those so far published for other Arachis species revealed very few homeologies with all A genome species and with those species included in the B genome that lack heterochromatic bands. Although some homeologies could be established between A. glandulifera and A. batizocoi, there are still many gross karyotype differences that support the criteria for keeping A. glandulifera as having a different genome, the D type.
Molecular markers have shown that A. glandulifera is more distantly related to the A genome species than to the B genome species (Milla et al., 2005; Tallury et al., 2005). Within the latter group, A. batizocoi appears as the species with higher genome affinity with A. glandulifera. These data are in agreement with our analysis on gross karyotype features and with the chromosome markers as well. However, dot blot hybridization challenges those results, since A. glandulifera DNA showed less genomic affinity with A. batizocoi than with any other species of the B genome group and even than the species included in A genome group. Considering the B genome taxa, the fact that A. glandulifera DNA showed strongest hybridization with A. williamsi followed by A. ipaensis, resembles the results obtained with the analysis of the plastid trnT-L region, in which A. glandulifera clustered in a sister clade to that formed by A. batizocoi and some other B genome species (Tallury et al., 2005). Moreover, in that analysis A. williamsi was joined by a polytomy to the cluster of D genome species, whereas A. ipaensis was included (although with a low bootstrap value) into the base of the clade of the B genome species. On the other hand, the weaker hybridization of A. glandulifera DNA with A. benensis is in accordance with the phylogenetic analysis based on amplified fragment length polymorphism (AFLP) since these species clustered in different clades (Milla et al., 2005). The strong hybridization of A. glandulifera DNA with A. trinitensis, A. kuhlmannii and A. kempff-mercadoi, which grouped into the cluster of the A genome entities by AFLP analysis (Milla et al., 2005; Tallury et al., 2005; Moretzsohn et al., 2004), may reflects an intermediate position of A. glandulifera between the A and B genome clades, as was proposed from the analyses of the plastid trnT-L region (Tallury et al., 2005).
Dot blot analysis in plants relies largely on the hybridization of genome repetitive sequences since they are a major component of genomes. Rapid evolution of those sequences can lead to changes in sequence motif and/or abundance of a particular sequence even between narrowly related species (Schmidt and Heslop-Harrison, 1998; Alkhimova et al., 2004), without being necessarily related to changes in the gross karyotype morphology (Ugarkovic and Plohl, 2002). This fact may explain, at least in part, the incongruence between molecular and chromosome data, reflecting differences in the rate and direction of evolution at each level.
In summary, our results have revealed the special genomic identity of A. glandulifera and although the data were not conclusive in determining the most related extant species to A. glandulifera the data did show a general similarity between the karyotype of A. glandulifera and A. batizocoi.
Acknowledgments
This work was supported by the European Commission, INCO-DEV Contract no. ICA4-CT-2001-10072; Consultative Group on International Agricultural Research, Challenge Program, subprogram "Trait capture for crop improvement", period 2005-2008; Consenjo Nacional de Investigaciones Científicas y Técnicas (CONICET), Argentina; PICT 2005 n. 34458, ANPCyT, Argentina. We would like to thanks Dirección general de biodiversidad, Ministerio de desarrollo sostenible y planificación, Bolivia, for authorizing botanical collections.
Internet Resources
Received: June 29, 2007; Accepted: November 22, 2007.
Associate Editor: Marcelo Guerra
- Alkhimova OG, Mazurok NA, Potapova TA, Zakian SM, Heslop-Harrison JS and Vershinin AV (2004) Diverse patterns of the tandem repeats organization in rye chromosomes. Chromosoma 113:42-52.
- Burow MD, Simpson CE, Starr JL and Paterson A (2001) Transmission genetics of chromatin from a synthetic amphidiploid to cultivated peanut (Arachis hypogaea L.): Broadening the gene pool of a monophyletic polyploid species. Genetics 159:823-837.
- Fernández A and Krapovickas A (1994) Cromosomas y evolución en Arachis (Leguminosae). Bonplandia 8:187-220.
- Gregory WC and Gregory MP (1976) Groundnut. Arachis hypogaea (Leguminosae-Papilionatae). In: Simmonds NW (ed) Evolution of Crop Plants. Longman Group Ltd, London, pp151-154.
- Gregory MP and Gregory WC (1979) Exotic germplasm of Arachis L. interspecific hybrids. J Hered 70:185-193.
- Greilhuber J and Speta F (1976) C-banded karyotypes in the Scilla hohenackeri group, S. persica and Puschkinia (Liliaceae). Plant Syst Evol 126:149-188.
- Jiang J and Gill BS (1994) New 18S-26S ribosomal RNA gene loci: Chromosomal landmarks for the evolution of polyploid wheats. Chromosoma 103:179-185.
- Krapovickas A and Gregory WC (1994) Taxonomía del género Arachis (Leguminosae). Bonplandia 8:1-186.
- Lavia GI (1996) Estudios cromosómicos en Arachis (Leguminosae). Bonplandia 9:111-120.
- Lavia GI (2000) Chromosome studies of wild Arachis (Leguminosae). Caryologia 53:177-181.
- Levan A, Fredga K and Sandberg AA (1964) Nomenclature for centromeric position on chromosomes. Hereditas 52:201-220.
- Lim KY, Matyasek R, Lichtenstein CP and Leitch AR (2000) Molecular cytogenetic analyses and phylogenetic studies in the Nicotiana section Tomentosae Chromosoma 109:245-258.
- Mallikarjuna N (2002) Gene introgression from Arachis glabrata into A. hypogaea, A. duranensis and A. diogoi Euphytica 124:99-105.
- Mallikarjuna N, Pande S, Jadhav DR, Sastri DC and Rao JN (2004) Introgression of disease resistance genes from Arachis kempff-mercadoi into cultivated groundnut. Plant Breed 123:573-576.
- Milla SR, Isleib TG and Stalker HT (2005) Taxonomic relationships among Arachis sect. Arachis species as revealed by AFLP markers. Genome 48:1-11.
- Moretzsohn MC, Hopkins MS, Mitchell SE, Kresovich S, Valls JFM and Ferreira ME (2004) Genetic diversity of peanut (Arachis hypogaea L.) and its wild relatives based on the analysis of hypervariable regions of the genome. BMC Plant Biol 4:11.
- Moscone EA, Matzke MA and Matzke AJM (1996) The use of combined FISH/GISH in conjunction with DAPI counterstaining to identify chromosomes containing transgene inserts in amphidiploid tobacco. Chromosoma 105:231-236.
- Moscone EA, Klein F, Lambrou M, Fuchs J and Schweizer D (1999) Quantitative karyotyping and dual-color FISH mapping of 5S and 18S-26S rDNA probes in the cultivated Phaseolus species (Leguminosae). Genome 42:1224-1233.
- Nakamura R, Kitamura S, Inoue M, Ohmido N and Fukui K (2001) Karyotype analysis of Nicotiana kawakamii Y. Ohashi using DAPI banding and rDNA FISH. Theor Appl Genet 102:810-814.
- Peñaloza A and Valls JFM (2005) Chromosome number and satellited chromosome morphology of eleven species of Arachis (Leguminosae). Bonplandia 14:65-72.
- Raina SN and Mukai Y (1999) Detection of a variable number of 18S-5.8S-26S and 5S ribosomal DNA loci by fluorescent in situ hybridization in diploid and tetraploid Arachis species. Genome 42:52-59.
- Schmidt T and Heslop-Harrison JS (1998) Genomes, genes and junk: The large-scale organization of plant chromosomes. Trends Plant Sci 3:195-199.
- Schwarzacher T, Ambros P and Schweizer D (1980) Application of Giemsa banding to orchid karyotype analysis. Plant Syst Evol 134:293-297.
- Seijo JG, Lavia GI, Fernández A, Krapovickas A, Ducasse D and Moscone EA (2004) Physical mapping of 5S and 18S-25S rRNA genes evidences that Arachis duranensis and A. ipaensis are the wild diploid species involved in the origin of A. hypogaea (Leguminosae). Amer J Bot 91:1294-1303.
- Seijo JG, Lavia GI, Fernández A, Krapovickas A, Ducasse DA, Bertioli DJ and Moscone EA (2007) Genomic relationships between the cultivated peanut (Arachis hypogaea, Leguminosae) and its close relatives revealed by double GISH. Amer J Bot 94:1963-1971.
- Schwarzacher T and Heslop-Harrison P (2000) Practical in situ Hybridization. Bios, Oxford, 203 pp.
- Simpson CE (2001) Use of wild Arachis species / introgression of genes into A. hypogaea L. Peanut Sci 28:114-116.
- Singh AK (1986) Utilization of wild relatives in the genetic improvement of Arachis hypogaea L. Part 8. Synthetic amphidiploids and their importance in interspecific breeding. Theor Appl Genet 72:433-439.
- Singh AK and Moss JP (1982) Utilization of wild relatives in genetic improvement of Arachis hypogaea L. 2. Chromosome complements of species of section Arachis Theor Appl Genet 61:305-314.
- Singh AK and Moss JP (1984) Utilization of wild relatives in genetic improvement of Arachis hypogaea L. 5. Genome analysis in section Arachis and its implications in gene transfer. Theor Appl Genet 68:355-364.
- Singh AK and Smartt J (1998) The genome donors of the groundnut/peanut (Arachis hypogaea L.) revisited. Genet Res Crop Evol 45:113-118.
- Smartt J, Gregory WC and Gregory MP (1978) The genomes of Arachis hypogaea 1. Cytogenetic studies of putative genome donors. Euphytica 27:665-675.
- Stalker HT (1991) A new species section Arachis of peanuts with D genome. Amer J Bot 78:630-637.
- Tallury SP, Hilu KW, Milla SR, Friend SA, Alsaghir M, Stalker HT and Quandt D (2005) Genomic affinities in Arachis section Arachis (Fabaceae): Molecular and cytogenetic evidence. Theor Appl Genet 111:1229-1237.
- Ugarkovic D and Plohl M (2002) Variation in satellite DNA profiles-causes and effects. EMBO Journal 21:5955-5959.
- Valls JFM and Simpson CE (2005) New species of Arachis from Brazil, Paraguay, and Bolivia. Bonplandia 14:35-64.
- MicroMeasure 3.3 program, http://www.colostate.edu/Depts/Biology/MicroMeasure/
Send correspondence to:
Publication Dates
-
Publication in this collection
18 Aug 2008 -
Date of issue
2008
History
-
Accepted
22 Nov 2007 -
Received
29 June 2007