Abstract
The allelic frequencies of 12 short tandem repeat loci were obtained from a sample of 307 unrelated individuals living in Macapá, a city in the northern Amazon region, Brazil. These loci are the most commonly used in forensics and paternity testing. Based on the allele frequency obtained for the population of Macapá, we estimated an interethnic admixture for the three parental groups (European, Native American and African) of, respectively, 46%, 35% and 19%. Comparing these allele frequencies with those of other Brazilian populations and of the Iberian Peninsula population, no significant distances were observed. The interpopulation genetic distances (F ST coefficients) to the present database ranged from F ST = 0.0016 between Macapá and Belém to F ST = 0.0036 between Macapá and the Iberian Peninsula.
allelic frequencies; Brazilian Amazon population; interethnic admixture
SHORT COMMUNICATION
Allelic frequencies and statistical data obtained from 12 codis STR loci in an admixed population of the Brazilian Amazon
Pablo Abdon da Costa FrancezI, II; Elzemar Martins Ribeiro RodriguesII; Gleycianne Furtado FrazãoIII; Nathalia Danielly dos Reis BorgesIII; Sidney Emanuel Batista dos SantosII
ILaboratório de Genética Forense, Departamento de Laboratórios Forenses, Polícia Técnico-Científica do Amapá, Macapá, AM, Brazil
IILaboratório de Genética Humana e Médica, Departamento de Patologia, Universidade Federal do Pará, Belém, PA, Brazil
IIIFaculdade SEAMA, Macapá, AM, Brazil
Send correspondence to Send correspondence to: Pablo A.C. Francez. Laboratório de Genética Humana e Médica, Instituto de Ciências Biológicas Cidade Universitária Prof. José da Silveira Netto, Rua Augusto Corrêa 01, Guamá Caixa Postal 8615, 66075-970 Belém, PA, Brazil E-mail: pabdon@uol.com.br.
ABSTRACT
The allelic frequencies of 12 short tandem repeat loci were obtained from a sample of 307 unrelated individuals living in Macapá, a city in the northern Amazon region, Brazil. These loci are the most commonly used in forensics and paternity testing. Based on the allele frequency obtained for the population of Macapá, we estimated an interethnic admixture for the three parental groups (European, Native American and African) of, respectively, 46%, 35% and 19%. Comparing these allele frequencies with those of other Brazilian populations and of the Iberian Peninsula population, no significant distances were observed. The interpopulation genetic distances (FST coefficients) to the present database ranged from FST = 0.0016 between Macapá and Belém to FST = 0.0036 between Macapá and the Iberian Peninsula.
Key words: allelic frequencies; Brazilian Amazon population; interethnic admixture.
The population of the Amazon region originated from the miscegenation of three large ethnic groups: Native American, European colonizers and Africans. Archeological studies have estimated that the first humans which reached the Amazon region were Paleoindians coming from the north and west of the American continent about 12,000 years ago (Salzano and Bortolini , 2002).
The mixture between Europeans and Native Americans from the Amazon region started soon after the arrival of the first European colonizers. After their settling in the new territory, the Europeans began using the indigenous labor force for the occupation and exploitation of the Amazon region. Along the 17th century, the indigenous slave labor force decreased and, as of the mid-18th century, Africans were introduced as slave labor force, representing the third migration wave into the region (Curtin, 1969; Cunha, 1995).
In the State of Amapá, the first documented records of contact between Europeans and Native Americans go back to 1499, when Americo Vespucci, who took part in the expedition of Alonso de Hojeda, under the orders of the Catholic sovereigns of Spain Fernando and Isabel (Castela and Aragon), traveled along its coast, passing the Cavian, the Pigs and the Pará islands, which face the current capital of the State of Amapá. An important record of the arrival of Africans in Amapá was made in 1764, during the construction of the Fortress of São José de Macapá, where Africans and Tucuju, Aruan, Aruaque and other natives living in the delta of the Amazon River and on the island of Marajó were used as labor force (Morais and Morais, 2000).
Defining from the genetic point of view what it means to be Brazilian is a difficult task, mainly if one considers that this is one of the most heterogeneous populations in the world. Countless scientific studies have attempted to provide answers as to the contribution of Natives Americans, of Europeans and of Africans to the shaping of the current Brazilian population, but the only consensus is that the crossbreeding dynamics that occurred in Brazil are unique and present great complexity.
The main purpose of this work was to estimate population parameters based on the allele frequencies obtained for 12 polymorphic autosomal STR loci investigated in a sample of the population of Macapá, and to compare the results with others, of different Brazilian populations and of the Iberian Peninsula. This study was approved by the SEAMA College Research Ethics Committee (REC Resolution nº. 023/2007).
After obtaining informed consent, 3 mL samples of peripheral blood were collected from 307 unrelated healthy individuals (185 women, 122 men; mean age 22.3 years; range 18 to 80 years) who live in the city of Macapá (0°02'20" N; 51°03'59" W), state of Amapá, northern Brazil, and were recruited upon routine examinations at the Macapá UNILAB Clinical Analysis Laboratory. Genomic DNA was extracted using the phenol-chloroform protocol described by Sambrook at al. (1989), and DNA quantification was done with a NANODROP 1000 spectrophotometer (Thermo Scientific, Wilmington, DE, USA). 1-5 ng of target DNA were used to co-amplify the 12 short tandem repeats (D8S1179, D21S11, D7S820, CSF1PO, TH01, D13S317, D16539, vWA, TPOX, D1851, D5S818, FGA) investigated in this study. The PCR primer sequences and DNA amplification conditions used were previously described (Ribeiro-Rodrigues et al., 2007). Electrophoresis and genotyping were performed in an ABI 3130 Avant Automated Sequencer (Applied Biosystems, Foster City, CA, USA). Data acquisition was performed with the ABI PRISM 3130 - Avant Data Collection v2.0 software (Applied Biosystems) and for profile analysis we used the GeneMapper ID v3.2 software (Applied Biosystems). Genotyping quality and allele designations were assured by simultaneous electrophoretic analysis of a control sample of known size. Allele designations were made by using the ABIGS ROX 500 reference ladder (Applied Biosystems) as size standard and according to published nomenclature and in concordance with the National Institute of Standards and Technology for forensic STR analysis (NIST).
Allele frequencies, heterozygosity (H), polymorphism information content (PIC), power of discrimination (PD), power of exclusion (PE) and deviation probability from the Hardy-Weinberg equilibrium (P) were obtained using the Arlequin Version 2.000 software (Schneider et al., 2000). Matching probability (MP) and typical paternity index (TPI) were calculated for each locus using the Powerstats V12 software (Tereba, 1999). Interethnic admixture was calculated using the ADMIX 95 software. Genetic distance FST coefficients were determined from the allelic frequencies using the DISPAN software (Ota, 1993) for the 12 loci analyzed. The FST matrix and UWPGMA (Unweighted Pair Group Method of Analysis) tree analysis were performed using the GDA program (Lewis and Zaykin, 2001). The tree was displayed by means of the TreeView software (Page, 1996).
All the analyzed loci were in Hardy-Weinberg equilibrium in the studied population (p > 0.05), including D8S1179 (p = 0.036), D21S11 (p = 0.006) and FGA (p = 0.033), once, after applying the Bonferroni correction, even the differences observed for these three loci (D8S1179, p = 0.356; D21S11, p = 0.069; and FGA, p = 0.331) proved not to be statistically significant.
The forensic parameters investigated show high average values: polymorphism information content (PIC) = 77%; power of discrimination (PD) = 93%; power of exclusion (PE) = 61%; observed heterozygosity (Ho) = 80%; cumulative matching probability (MP) = 0.000000000000095 (probability of finding another person with the same genetic profile using these 12 markers), and cumulative typical paternity index (TPI) = 73,200.00 (index based on Bayesian statistics that indicates the ratio between the possibility of the alleged father being the true parent versus the possibility of the alleged father not being the true parent, using the 12 analyzed markers).
The FGA marker showed the highest level of heterozygosity (89.5%), and the TPOX marker showed the lowest (71.3%). The power of discrimination and the power of exclusion for the 12 STRs studied were 99.9999999999992% and 99.9991%, respectively (Table 1).
By comparing the allele frequencies obtained for the 12 STR-autosome systems investigated in the population of Macapá (Table 1) with the frequencies described in the three parental ethnic groups (Ribeiro-Rodrigues EM, 2003, Dissertação de Mestrado do Curso de Genética Molecular da Universidade Federal do Pará, Belém), using the ADMIX 95 program, we were able to estimate the European, African and Native American contributions at 0.46 ± 0.0261, 0.19 ± 0.0262, and 0.35 ± 0.0264, respectively.
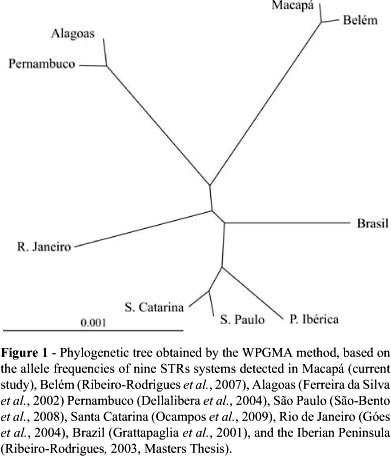
However, when the ancestry percentages estimated for the population of Macapá are compared with the percentages described in other Brazilian populations, it becomes clear that there is a regional variation regarding the dynamics of crossbreeding in Brazil. Thus, by comparing the results obtained in the population of Macapá with those of populations of different geopolitical regions of Brazil (Grattapaglia et al., 2001; Ferreira da Silva et al., 2002; Dellalibera et al., 2004; Góes et al., 2004; Ribeiro-Rodrigues et al., 2007; São-Bento et al, 2008; Ocampos et al., 2009 Ribeiro-Rodrigues et al., 2007; as well as Godinho NMO, 2008, Tese de Doutorado, Curso de Ciências Biológicas da Universidade de Brasília, DF) and with populations of the Iberian Peninsula (Ribeiro-Rodrigues EM, 2003, Dissertação de Mestrado, Curso de Genética Molecular, Universidade Federal do Pará, Belém) (Table 2 and Figure 1), the population of Macapá showed to be closer, in terms of genetic distances, to the population of Belém (FST = 0.0016), in strict accordance with their geographic location and history of colonization. The Iberian Peninsula (FST = 0.0036) is clearly the most distinct population, as well as the one of São Paulo (FST = 0.0029). These results agree with other population studies and historical data and are consistent with the anthropological origins (Caucasian, African and Native American) of the Brazilian populations tested.
Figure 1 shows that there is a clear-cut grouping among the populations of cities or states which are geographically closer to each other, as in the case of Macapá and Belém, Santa Catarina and São Paulo, and Pernambuco and Alagoas, respectively. These results are in agreement with other studies (Handley et al, 2007) indicating that the gene flow among population groups is inversely proportional to the geographic distance between them. These results also agree with the fact that, due to the special occupation policies of such a vast territory, the admixture process occurred in different ways in different geographic regions of the country. The data in Table 2 are in agreement with those of Salzano and Bortolini (2002), indicating that in northeastern Brazil the African contribution is high and the Native American component is low; in the North, the contribution of Native Americans is pronounced, whereas in the South the Native American and African influence is reduced compared to all the other geographic regions.
The absence of significant differences between the genetic distances among the population of Macapá and other Brazilian populations observed in this study is due to the fact that the markers used have low values of FST between different human ethnic groups. This characteristic was deliberately selected and is important, because these markers are used in human identification studies, including civil and criminal forensic investigations. It is therefore not desirable that they present significant differences in gene frequencies among different population groups, since this could increase the risk of statistical errors, such as overestimation of the paternity index arising from populational substructuring.
Acknowledgments
The authors wish to thank the persons who agreed to participate in this study and the Universidade Federal do Pará (UFPA) and POLITEC-AP for financial support.
Internet Resources
Received: May 12, 2010; Accepted: September 23, 2010.
Associate Editor: Francisco Mauro Salzano
License information: This is an open-access article distributed under the terms of the Creative Commons Attribution License, which permits unrestricted use, distribution, and reproduction in any medium, provided the original work is properly cited.
- Cunha MC (1995) História dos Índios no Brasil. Companhia das Letras/FAPESP/SMC-PMSP, São Paulo, 611 pp.
- Curtin PD (1969) The Atlantic Slave Trade: A Census. University of Wisconsin Press, Madison, 457 pp.
- Dellalibera E, Havro MLB, Souza M, Kajihara K, Mauricio-da-Silva L and Silva RS (2004) Genetic analysis of 13 STR loci in the population from the State of Pernambuco, northeast Brazil. Forensic Sci Int 146:57-59.
- Ferreira da Silva LA, Pimentel BJ, Azevedo DA, Silva ENP and Santos SS (2002) Allele frequencies of 9 STR loci - D16S539, D7S820, D13S317, CSF1PO, TPOX, TH01, F13A01, FESPS and vWA, in the population from Alagoas, north-eastern Brazil. Forensic Sci Int 130:187-188.
- Goes ACS, Silva DA, Gil EHF, Silva MTD, Pereira RW and Carvalho EF (2004) Allele frequencies data and statistic parameters for 16 STR loci - D19S433, D2S1338, CSF1PO, D16S539, D7S820, D21S11, D18S51, D13S317, D5S818, FGA, Penta E, TH01, vWA, D8S1179, TPOX, D3S1358 - in the Rio de Janeiro population, Brazil. Forensic Sci Int 140:131-132.
- Grattapaglia D, Schmidt AB, Costa e Silva C, Stringher C and Fernandes AP (2001) Brazilian population database for the 13 STR loci of the AmpFlSTR® Profile Plus and Cofiler multiplex kits. Forensic Sci Int 118:91-94.
- Handley LJL, Manica A, Goudet J and Balloux F (2007) Going the distance: Human population genetics in the clinal world. Trends Genet 23:432-439.
- Leite FPN, Menegassi FJ, Schwengber SP, Raimann PE and Albuquerque TK (2003) STR data 09 autosomal STR markers from Rio Grande do Sul (southern Brazil). Forensic Sci Int 132:223-224.
- Morais PD and Morais J D (2000) O Amapá em Perspectiva: Uma abordagem Histórico-Geográfica. Editora Valcan, Macapá, 200 pp.
- Ocampos M, Fernandes RC, Latorre AFS, Dornelles DS, Korndorfer FP, Giamarusti AC and Menezes ME (2009) 15 STR loci frequencies in the population from Santa Catarina, Southern Brazil. Forensic Sci Int Genet 3:367-369.
- Page RD (1996) TreeView: An application to display phylogenetic trees on personal computers. Comput Appl Biosci 12:357-358.
- Ribeiro-Rodrigues EM, Palha TJBF and Santos SEB (2007) Allele frequencies data and statistic parameters for 13 STR loci in a population of the Brazilian Amazon Region. Forensic Sci Int 168:244-247.
- Salzano FM and Bortolini MC (2002) The Evolution and Genetics of Latin American Populations. Cambridge University Press, Cambridge, 512 pp.
- Sambrook J, Fritsch EF and Maniatis T (1989) Isolations of DNA from mammalian cells. In: Ford N, Nolan C and Ferguson M (eds) Molecular Cloning. Cold Spring Harbor Laboratory Press, New York, pp 916-919.
- São-Bento M, Carvalho M, Andrade L, Lopes V, Serra A, Gamero JJ, Corte-Real F, Vide MC and Anjos MJ (2008) STR data for the 15 AmpFlSTR1 IdentifilerTM loci in the Brazilian population of São Paulo State. Forensic Science International: Genetics Supplement Series 1:367-369.
- Schneider S, Roessli D and Excoffier L (2000) Arlequin: A Software for Population Genetics Data Analysis, v. 2.000. Genetics and Biometry Laboratory, Department of Anthropology.
- ADMIX 95 Software, http://www.genetica.fmed.edu.uy (July 5, 2008).
- Lewis PO and Zaykin D (2001) Genetic data analysis: Computer program for the analysis of allelic data, http://www.eeb.uconn.edu/people/plewis/software.php (September 10, 2009).
- National Institute of Standards and Technology for forensic STR analysis (NIST): http://www.cstl.nist.gov/div831/strbase/ (April 20, 2008).
» link - Ota T (1993) DISPAN: Genetic Distance and Phylogenetic Analysis, http://www.bio.psu.edu/people/faculty/Nei/Lab/dispan2.htm (October 7, 2009).
- Tereba A (1999) Tools for analysis of population statistics. Profile in DNA 14-16. Free software distributed by the authors at website http://www.promega.com/geneticidtools/
Publication Dates
-
Publication in this collection
28 Jan 2011 -
Date of issue
2011
History
-
Received
12 May 2010 -
Accepted
23 Sept 2010