Abstract
This report describes the construction of integrated genetic maps in pearl millet involving certain purple phenotype and simple sequence repeat (SSR) markers. These maps provide a direct means of implementing DNA marker-assisted selection and of facilitating "map-based cloning" for engineering novel traits. The purple pigmentation of leaf sheath, midrib and leaf margin was inherited together 'en bloc' under the control of a single dominant locus (the 'midrib complex') and was inseparably associated with the locus governing the purple coloration of the internode. The purple panicle was caused by a single dominant locus. Each of the three characters (purple lamina, purple stigma and purple seed) was governed by two complementary loci. One of the two loci governing purple seed was associated with the SSR locus Xpsmp2090 in linkage group 1, with a linkage value of 22 cM, while the other locus was associated with the SSR locus Xpsmp2270 in linkage group 6, with a linkage value of 23 cM. The locus for purple pigmentation of the midrib complex was either responsible for pigmentation of the panicle in a pleiotropic manner or was linked to it very closely and associated with the SSR locus Xpsmp2086 in linkage group 4, with a suggestive linkage value of 21 cM. A dominant allele at this locus seems to be a prerequisite for the development of purple pigmentation in the lamina, stigma and seed. These findings suggest that the locus for pigmentation of the midrib complex might regulate the basic steps in anthocyanin pigment development by acting as a structural gene while other loci regulate the formation of color in specific plant parts.
gene tagging; pearl millet; pigmentation genetics
Genetic architecture of purple pigmentation and tagging of some loci to SSR markers in pearl millet, Pennisetum glaucum (L.) R. Br.
Pusapati VaralakshmiI; Surya S Mohan Dev TavvaI; Palakollu V Arjuna RaoI; Muktinutalapati V Subba RaoI; Charles T HashII
IPlant Cytogenetics and Biotechnology Laboratory, Botany Department, Andhra University, Visakhapatnam, India
IIGlobal Theme-Biotechnology, ICRISAT, Patancheru, India
Send correspondence to Send correspondence to: M.V. Subba Rao. Botany Department, Andhra University 530003 Visakhapatnam, India. E-mail: millet genome and those of other cultivated graminaceous
ABSTRACT
This report describes the construction of integrated genetic maps in pearl millet involving certain purple phenotype and simple sequence repeat (SSR) markers. These maps provide a direct means of implementing DNA marker-assisted selection and of facilitating "map-based cloning" for engineering novel traits. The purple pigmentation of leaf sheath, midrib and leaf margin was inherited together 'en bloc' under the control of a single dominant locus (the 'midrib complex') and was inseparably associated with the locus governing the purple coloration of the internode. The purple panicle was caused by a single dominant locus. Each of the three characters (purple lamina, purple stigma and purple seed) was governed by two complementary loci. One of the two loci governing purple seed was associated with the SSR locus Xpsmp2090 in linkage group 1, with a linkage value of 22 cM, while the other locus was associated with the SSR locus Xpsmp2270 in linkage group 6, with a linkage value of 23 cM. The locus for purple pigmentation of the midrib complex was either responsible for pigmentation of the panicle in a pleiotropic manner or was linked to it very closely and associated with the SSR locus Xpsmp2086 in linkage group 4, with a suggestive linkage value of 21 cM. A dominant allele at this locus seems to be a prerequisite for the development of purple pigmentation in the lamina, stigma and seed. These findings suggest that the locus for pigmentation of the midrib complex might regulate the basic steps in anthocyanin pigment development by acting as a structural gene while other loci regulate the formation of color in specific plant parts.
Key words: gene tagging, pearl millet, pigmentation genetics.
Introduction
Integrated genetic maps involving molecular and phenotypic markers provide a direct means for investigating the number of genes influencing a trait, their location along the chromosomes and the effects of variation in their dosage. These maps also provide the information needed to implement DNA marker-assisted selection, an approach of growing importance in plant and animal improvement that facilitates "map-based cloning" for engineering novel traits. However, accurate genotyping and phenotyping of the materials is required for the successful application of this information (Zhou, 2010). The phenotypic characters related to pigmentation have been the most frequently used genetic markers in plants. These markers have been widely used to study the genetic basis of phenotypic diversity associated with evolutionary changes and with the processes of tolerance to abiotic stress and disease resistance.
Pearl millet [Pennisetum glaucum (L.) R. Br. = P. americanum (L.) Leeke = P. typhoides S&H; 2n = 14] is an important cereal of traditional farming systems in tropical and subtropical Asia and sub-Saharan Africa. This millet, which is a staple food grain and a source of feed, fodder, fuel and construction material, is grown on 29 million hectares (FAO, 2005) and supports millions of poor rural families in the hottest and driest drought-prone semi-arid regions of Africa and the Indian sub-continent, where rainfed agriculture is practiced. Despite the considerable attention that pearl millet has received from agronomists, plant breeders and cytogeneticists, and the availability of molecular maps, the tagging of genes that can be used as molecular markers for various characters in this cereal is still in its initial stages. The first RFLP-based genetic linkage map in pearl millet was reported by Liu et al. ( (1994) and has since been updated by the addition of more RFLP and SSR markers (Qi et al. (, 2004). These markers have improved our understanding of the complex relationship between the pearl millet genome and those of other cultivated graminaceous species (Devos et al. (, 2000), in addition to being useful in studies of aspects such as marker-assisted breeding (Hash, 2004; Serraj et al. (, 2005).
A review of earlier studies on the genetics of phenotypic markers in pearl millet, especially those related to pigmentation (Al-Fakhry et al. (, 1965; Singh et al., 1967; Athwal and Gill, 1966; Gill, 1969; Phul et al. (, 1969; Gill and Athwal, 1970; Koduru and Krishna Rao, 1979; Manga et al. (, 1988; Hanna and Burton, 1992), revealed certain apparently contradictory findings and "several of these early publications do not provide adequate descriptions of the mutant phenotypes to permit comparison by other researchers" (Anand Kumar and Andrews, 1993).
In view of these gaps in our knowledge of this crop plant, the present work was undertaken to provide a detailed description of some of the purple phenotype markers with reference to a standard color code, to report their genetic basis and to describe their linkage relationships. We also provide accurate phenotyping and genotyping of the accessions used and have tagged the loci to SSR markers. A model is suggested to explain the genetic architecture underlying the purple pigmentation; this model may also help to resolve the contradictory findings of earlier studies.
Materials and Methods
Plant material
Two inbred lines of pearl millet, i.e., green dwarf (d2) and purple (IP3128), were used in this work. Green dwarf (d2d2) seeds were obtained from ICRISAT, Patancheru, India. The purple plant was originally identified in 1981 in a population of 500 plants derived from combined mutagenic treatment with a 20 Kr dose of gamma rays and a 0.1% aqueous solution of ethyl methane sulphonate (EMS). Both of these accessions have been maintained through selfing and/or sib mating. Parents and F1s were checked randomly at meiosis in pollen mother cells to eliminate those carrying chromosomal aberrations.
Seeds were germinated on moist filter paper in 4-inch diameter plastic petri dishes and after 2-3 days germinated seeds were transferred to earthenware pots filled with sterilized soil. After 25-30 days, seedlings were transplanted into the field in rows spaced 60 cm apart, with plants within each row spaced 30 cm apart. The specific color/pigmentation was described based on the Royal Horticultural Society color codes (RHS) and the IBPGR and ICRISAT (1993) descriptors for pearl millet. Gene names and symbols were defined based on the criteria established for Arabidopsis (Anonymous, 2005).
DNA isolation
Genomic DNA was isolated from fresh leaf tissue using the CTAB method of Saghai-Maroof et al. ( (1984). Isopropanol-precipitated DNA was washed with 70% ethanol, air dried, dissolved in 200 /L of TE buffer (10 mM Tris, 1 mM EDTA, pH 8.0) and stored at 4 °C. RNAse
(Sigma-Aldrich, USA) was added to the DNA solution (final concentration: 50 /g/mL, from a stock solution of 10 mg/mL) and the mixture incubated at 37 °C for 15 min. DNA was re-precipitated with 250 /L of 7.5 M ammonium acetate and 1 mL of absolute ethanol, collected, washed in 70% ethanol, dried and re-suspended in 100 /LofTE buffer prior to storage at 4 °C.
Primers
61 simple sequence repeats (SSRs; see supplementary material Table S1 for details), expected to map across all of the seven possible linkage groups in pearl millet, were used in this work. The nucleotide sequences of the primers (PSMP for primers and Xpsmp for SSR loci) used to amplify these SSR markers were developed at the John Innes Institute (Qi et al. (, 2004) and were made available to the authors by ICRISAT.
Polymerase chain reaction (PCR)
Polymerase chain reactions (PCR) were done in 96-well plates using a model PTC 220 DNA engine DYAD Peltier thermal cycler (MJ Research Inc., USA). The reactions were done in a final volume of 20 /L that consisted of 2.5 /L of DNA (5 ng/mL), 2 /L of 10X PCR buffer (100 mM Tris-HCl, pH 8.3, 500 mM KCl, 15 mM MgCl2, 0.01% gelatin), 2 /L of 2 mM dNTP, 0.5 /LoF25mM Mg2+,1 /L of primer (30 ng//L), 1.5 /L of Bioline Taq polymerase (1 U//L) (Bioline Reagents Ltd. UK) and 9.5 /L of distilled water. The PCR involved initial denaturation of the template DNA at 94 °C for 3 min followed by 35 cycles of denaturation at 94 °C for 1 min, annealing at 48, 58 or 61 °C (depending on the melting temperature of the primer) for 1 min and extension at 72 °C for 1 min.
Post-PCR gel electrophoresis
PCR products were separated on 7.7% polyacrylamide gels in 10X TBE buffer. The gel was pre-run for at least 10 min at 5 V/cm (600 V, 9 W). Urea gels were used to separate the amplification products of primers PSMP 2089, PSMP 2068, PSMP 2246, PSMP 2220 and PSMP 2251. The urea gels were run at 50 °C and 100 W for 45-60 min. 4 /L of each PCR product was loaded onto the gels, along with 2 /L of 100 bp standard molecular weight marker (50 ng//L; Qiagen) which was also loaded in the first and last lanes of the gel. The gels were run at 600-650 V in 0.5X TBE buffer for 3-3.5 h using a Bio-Rad sequencing gel apparatus. After the run, the gels were silver stained, as described by Tegelstrom (1992). Only bands in the 100300 bp range were considered. The most anodal band was considered as band 1.
Data analysis
Data were collected from the segregating populations (F2 and Testcross) derived from a minimum of four separate parental crosses. The corresponding data were pooled after checking the homogeneity of their variances and the pooled data are presented in the tables. The deviations between the observed and expected ratios and homogeneity of the Chi-square values for different segregating populations corresponding to a cross were checked with the Chi-square test, as described by Snedecor and Cochran (1967). The logarithm of odds (LOD) scores were calculated using the methods of Morton (1955) and Lathrop and Lalouel (1984). The odds ratio was calculated for the observed proportion of each category of data versus that expected on the basis of independent assortment of the markers. Only those cases for which the Chi-square value deviated significantly at a probability level of 0.05 and an LOD = 2.8 were taken as indicative of linkage.
Results
Inheritance patterns of phenotypic markers
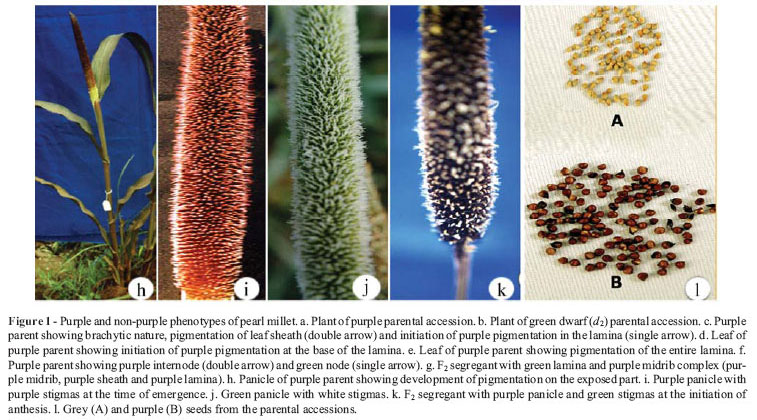
The inheritance patterns of purple pigmentation of the leaf, panicle, stigma and seed coat were studied individually and in combinations using reciprocal crosses between plants of the two parental lines, viz., green dwarf (d2) and purple (IP3128; Figure 1a,b). A common feature of inheritance noted for all of these phenotypic markers was the lack of reciprocal differences as judged from the F1,F2 and testcross progeny phenotypes.
Description and inheritance patterns of individual phenotypic markers
Purple foliage (purple pigmentation of leaves)
Plants of the parental purple accession showed deep purple pigmentation (purple group 79B of RHS) throughout their leaves (sheath, lamina, midrib and margin) while those of the green dwarf parental accession were green. The development of purple pigmentation was initially detected at the base of the leaf sheath in 12-15-day-old seedlings and extended over the entire leaf within 30 days after transplantation, starting at the base of the lamina and gradually spreading towards the leaf tip (Figure 1c-e). For the sake of consistency, the lamina color was recorded 55-58 days after sowing (or 30 days after seedling transplantation).
Reciprocal crosses between plants with purple leaf blades and those with green leaf blades produced F1 plants, all of which showed purple leaves, indicating the dominant nature of the purple phenotype. These F1 plants were selfed and also crossed to the green parental accession. The data on segregation pattern of foliage color are presented in Table 1. Three phenotypic categories were identified in the F2 and testcross progeny, namely,
1) Category 1 – plants with purple leaves resembling those of the purple parent and F1,
2) Category 2 – plants with a green lamina but a purple sheath, midrib and margin (Figure 1f),
3) Category 3 – plants with completely green leaves resembling those in the green parent.
The frequencies of these three phenotypic categories showed a good fit to a 9:3:4 ratio while the testcross progeny showed a good fit to a 1:1:2 ratio (Table 1). When the F2 and testcross progeny were scored for lamina pigmentation only (purple lamina: green lamina, i.e., category 1: categories 2+3), irrespective of the type of pigmentation present in the leaf sheath, midrib and leaf margin, they showed a good fit to 9:7 and 1:3 ratios, respectively (p > 0.05). For further genetic analysis of the category 2 phenotype, F2 plants with a green lamina and purple pigmentation in the leaf sheath, midrib and margin were randomly selected and selfed. One third of this population (data not shown) bred true, indicating that these plants were homozygous at the loci governing this phenotype, while two-thirds segregated in a 3:1 ratio of category 2: category 3 plants.
To analyze lamina pigmentation alone, plants of the purple accession were crossed to true breeding plants of category 2. Purple pigmentation of the sheath, midrib and margin was common to both of the parents. The F1 plants showed complete purple foliage. The F2 progeny segregated (3:1 ratio) into plants with complete purple foliage and those with a green lamina and purple sheath, midrib and margin. The test cross progeny segregated in a 1:1 ratio for these characters. These results suggested that purple pigmentation of the lamina was a monogenic dominant character.
To analyze the pigmentation of the leaf sheath, midrib and margin, the progeny of true breeding plants of category 2 that had a green lamina and purple leaf sheath, midrib and leaf margin were crossed to plants from the green parental line. The F1 plants resulting from this cross had green lamina but a purple leaf sheath, midrib and leaf margin. These F1 plants were selfed and also test crossed to the green dwarf. The F2 progeny segregated in a 3:1 ratio of plants having green lamina with a purple sheath, midrib and margin and those with completely green leaf parts. In the testcross progeny, these two types segregated in a 1:1 ratio.
In none of the progeny resulting from either F2 or testcross populations of any of the above crosses was there any separation of pigmentation in the leaf sheath, midrib and margin. In all of these cases, internode pigmentation was also associated with the pigmentation of these three parts of leaf, i.e., whenever the leaf sheath, midrib and margin were purple, the internode was also purple (Figure 1g) and whenever these parts were green, the internode was also green. Thus, purple pigmentation of the internode, leaf sheath, midrib and leaf margin was apparently inherited en bloc and determined by a dominant allele at a single locus. For the sake of convenience, the purple pigmentation in these four plant parts (internode, leaf sheath, midrib and leaf blade margin) is denoted hereafter as pigmentation of the 'midrib complex'.
Purple panicle
Plants of the green parental accession had green panicles. In plants of the purple parental accession, the panicles were green when they were still inside the boot leaf. The purple color started developing as the panicles gradually emerged from the boot leaf, beginning first at the tip and gradually extending towards the base of the inflorescence (Figure 1h). The panicle color was recorded after complete emergence of the stigmas and corresponded to purple group 79B of RHS. After formation of the seed, the purple panicle turned purplish black (corresponding to No. 9 of pearl millet descriptors). Reciprocal crosses between plants with purple panicles and those with green panicles produced F1 plants having purple panicles. The segregation ratios observed in the F2 (599:222) and testcross (120:101) progeny were a good fit to purple:green ratios of 3:1 and 1:1, respectively.
Purple stigma
The stigma color was recorded after its complete emergence and before anthesis. The green parental accession had white stigmas while the purple parental accession showed purple ones (Figure 1i-k). Reciprocal crosses between plants of these two accessions produced F1 plants, all of which had purple stigmas. The F2 progeny segregated in a 9:7 ratio (447 purple : 305 white) and testcross progeny in a ratio of 58:162 (1:3; p > 0.05).
Purple pigmentation of seed coat
Seed color was recorded at the harvesting stage. In the purple parental accession, the seed was purple (purple group T9B of RHS) at earlier stages but turned purplish black at the harvesting stage (No. 9 of pearl millet descriptors; Figure 1a). The purple pigmentation was confined to the seed coat only and the endosperm was white; however, this character is referred to here as 'seed color' for the sake of presentation. The seeds of the green parental accession were grey colored (grey group 201 of RHS; Figure1 lB) with a white endosperm.
Crosses between purple-seeded and grey-seeded plants of the two parental lines revealed that the color of the F1 seed depended on the genotype of the female parent used in the cross. For example, the F1 seeds were grey if the female parent had grey seed and were purple when the female parent had purple seeds. Upon sowing, these two types of seeds produced F1 plants, all of which had purple seeds after selfing or in controlled pollination using pollen from either purple-or grey-seeded parent plants. These purple-seeded F1 plants were selfed to produce F2 seeds. The F2 plants produced by sowing these F2 seeds segregated for panicles producing purple seeds (411) and those producing grey seeds (330) in a 9:7 ratio (p > 0.05). The testcrosses involving F1 plants (bearing purple seeds) and the grey-seeded parental line resulted in progeny that included 62 purple seed plants and 143 grey seed plants (1:3; p > 0.05).
Joint segregation patterns of phenotypic markers
Purple midrib complex with purple panicle, stigma and seed
Analysis of the joint segregation pattern of the purple midrib complex with panicle pigmentation revealed the presence of only two phenotypic categories in the F2 and testcross progeny, viz., (1) plants with a purple midrib complex and purple panicle and (2) plants with a green midrib complex and green panicle. The frequencies of these two phenotypic categories showed a good fit to a 3:1 ratio in the F2 generation and a 1:1 ratio in the testcross generation (Table 2).
The combined inheritance of the purple midrib complex and purple stigma traits revealed three phenotypic categories in the F2 and testcross progeny that included (1) the purple midrib complex and purple stigma, (2) the purple midrib complex and white stigma, and (3) the green midrib complex and white stigma (Table 2). The theoretically expected fourth category (green midrib complex and purple stigma) was not observed. The F2 data showed a good fit to a 9:3:4 ratio for these three categories, while the corresponding testcross progeny segregated in a 1:1:2 ratio. The LOD scores for the F2 and testcross progeny were < 2.
The pattern of joint segregation of the purple midrib complex and purple seed was similar to that for purple pigmentation of the stigma, i.e., only three phenotypic categories were observed in the F2 and testcross progeny, namely,
(1) the purple midrib complex and purple seed, (2) the purple midrib complex and grey seed, and (3) the green midrib complex and grey seed. The ratios of these three phenotypic categories were 9:3:4 and 1:1:2 in the F2 and testcross progeny, respectively (Table 3). The LOD score values in all these cases were also < 2.
Purple panicle with purple lamina, stigma and seed
The joint segregation pattern of purple panicle (character 1) with any of the other three pigmentation traits as the second character (purple lamina or purple stigma or purple seed) was similar to that observed in the case of the midrib complex described above in that only three phenotypic categories were detected in either the F2 or testcross progeny. These categories were: (1) both characters 1 and 2 being purple, (2) purple for character 1 and non-purple for character 2 (green for lamina, white for stigma, grey for seed), and (3) both characters green. The frequencies of these three phenotypic categories showed good fits to 9:3:4 (F2) and 1:1:2 (testcross) ratios and the corresponding LOD scores were < 2 (Table 2).
Purple lamina with purple stigma and purple seed
The co-segregation of lamina and stigma pigmentation resulted in four phenotypic categories (Table 2), namely:
1) plants with purple lamina, purple midrib complex and purple stigma,
2) plants with purple lamina, purple midrib complex and white stigma,
3) plants with green lamina, purple midrib complex and purple stigma,
4) plants with green lamina, green midrib complex and white stigmas.
The frequencies of these four categories deviated significantly from the expected 81:63:63:49 ratio in F2 and 1:3:3:9 ratio in the testcross progeny based on the involvement of four independent/unlinked loci acting in two complementary pairs, with each pair segregating in a 9:7 ratio in F2. The corresponding LOD score values were > 3 (Table 2). In the joint segregation of lamina and seed pigmentation, only four phenotypic classes similar to those described above deviated from the expected ratios in the F2 and testcross progeny. The LOD scores were also > 3.
Purple stigma with purple seed
When the joint segregation of stigma and seed pigmentation was considered, the four phenotypic classes observed were (1) purple seed and stigma, (2) purple stigma and grey seed, (3) white stigma and purple seed, and (4) white stigma and grey seed. Their frequencies also deviated from the expected 81:63:63:49 ratio in F2 and 1:3:3:9 in testcross progeny, with the corresponding LOD scores being > 3 (Table 2).
SSR patterns and their inheritance
When DNA samples from the two parental lines were amplified using the 61 primer pairs, only 18 pairs produced banding patterns that differed from the amplicons of the two parental lines. The remaining primers were monomorphic, i.e., their amplicon banding patterns were similar to the two parents, and were not included in the present analysis. Of the 18 polymorphic primer pairs, two (PSMP2251 for LG 3 and PSMP2274 for LG 5) yielded patterns that differed from the parental lines but could not be distinguished in the F1 hybrids, perhaps because of the occurrence of recombinant bands that made scoring difficult. For this reason, these two SSR markers were not considered for further analysis. As a result, only 16 primer pairs were used for further investigation. Table 3 summarizes the basic amplicon band patterns observed in the two parents with these 16 primers. For 13 of these 16 SSR primer pairs the segregation pattern of the amplicons in the F2 progeny corresponded to the codominant segregation ratio of 1:2:1 (p > 0.05). The segregation pattern in the F2 progeny with the remaining three primer pairs (PSMP2068, PSMP2220 and PSMP2273) deviated significantly from
1:2:1 (p < 0.05). Consequently, these three markers that showed skewed allelic frequencies or segregation distortion were not included in the subsequent joint segregation analysis.
Joint segregation patterns of the SSRs and purple phenotypic markers
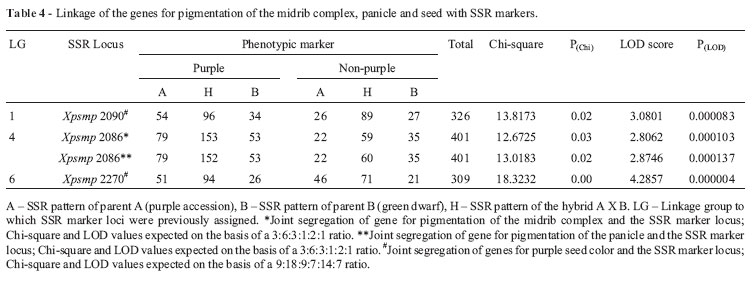
Data on the joint segregation of pigmentation of the midrib complex with the 13 SSR markers showed a good fit to the 3:6:3:1:2:1 ratio expected based on independent assortment of these two types of markers. In all of these cases, the LOD scores were < 2. In the case of the SSR locus Xpsmp2086 (LG IV), the frequencies of the marker combination deviated significantly from the expected ratio (p < 0.05; Table 4) and the LOD score was 2.806.
The joint segregation pattern of purple pigmentation of leaf lamina with the 13 SSR loci was a good fit to the
9:18:9:7:14:7 ratio expected based on independent assortment of these markers (p > 0.05; data not shown). The LOD scores were < 2.4. Similarly, data for the joint segregation of panicle pigmentation with the 13 SSR markers (except Xpsmp2086) showed good correspondence to the
3:6:3:1:2:1 ratio (p > 0.05; data not shown). The corresponding LOD scores were < 2.2. The co-segregation of panicle pigmentation with Xpsmp2086 deviated significantly from the ratio expected for independent assortment (p < 0.05; Table 4). The LOD score was 2.87.
The joint segregation of purple stigma with the SSR markers showed a ratio of 9:18:9:7:14:7. Only one SSR locus (Xpsmp2206) deviated significantly from this ratio (p < 0.05; data not shown) with an LOD score of 2.613; there was no significant deviation with the other SSRs; the LOD values for joint segregation were < 2.2.
In the case of purple seed and SSR markers, joint segregation yielded a ratio of 9:18:9:7:14:7. Chi-square analysis indicated significant deviation (p < 0.05; Table 4) from the expected ratio when the SSR locus Xpsm2090on LG1 was involved and the LOD value was 3.08. Another SSR locus, Xpsmp2270 (LG 6), also showed significant deviation (p < 0.05) and the LOD value was 4.29. For all of the other SSR markers used here, the observed values showed a good fit to the expected segregation ratios and gave LOD values < 2 (data not shown).
Recombination frequencies and map distances between the linked markers
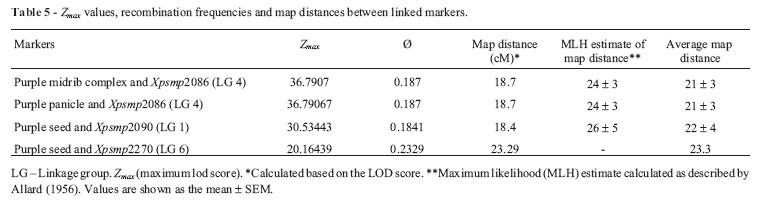
The joint segregation patterns for purple seed and the SSR locus Xpsmp2090 (LG 1) and purple seed and the SSR locus Xpsmp2270 (LG 6) deviated significantly from independent assortment, as shown by Chi-square analysis and the LOD scores(see supplementary material Table S4 for details). Recombination frequencies for Xpsmp2090 were calculated using the Maximum Likelihood method of Allard (1956), as well as the method of Maximization of LOD scores (Snustad et al. (, 1997); the averages of these two values are shown in Table 5. For the SSR locus Xpsmp2270, Allard's formula gave a linkage value of 50 that differed considerably from the results for the Chi-square and LOD analyses; hence this value was not considered here. When the LOD score threshold was set at 2.8, two more characters (purple midrib complex and purple panicle, see supplementary material Tables S2 & S3 for details) showed linkages with the SSR locus Xpsmp2086 (LG 4). The map distances for both of these phenotypic markers from Xpsmp2086 were the same (24 ± 3 cM; Table 5).

Discussion
Plants for which the parents and F1 progeny had purple foliage also generally showed pigmentation in the leaf sheath, midrib and lamina (including the margin). However, pigmentation of the lamina segregated from that of the leaf sheath, midrib and margin in the F2 and testcross progeny. The 9:3:4 ratio of these three phenotypic categories in the segregating progeny indicated a recessive epistatic mode of gene interaction involving two loci. Pigmentation of the midrib, margin and sheath showed no separation in any of the progeny and was inherited en bloc in these three parts. When this character alone was analyzed using suitable crosses, a single dominant gene control of pigmentation was inferred. Similar conclusions regarding the en bloc inheritance and monogenic dominant nature of pigmentation in these plant parts have been reported by Manga et al. ( (1988).
Purple sheath and leaf were analyzed separately by Athwal and Gill (1966), Singh et al. ( (1968), Gill (1969) and Gill and Athwal (1970). Based on these earlier studies, Manga et al. ( (1988) inferred that pigmentation of the midrib, margin and sheath may reflect the close linkage of separate genes and proposed the gene symbols Pmi, Pmg and Psh for purple midrib, purple margin and purple sheath, respectively. Since the results described here were similar to those obtained by Manga et al. ( (1988) we chose to use the symbols defined by these authors. However, for the sake of convenience, PmiCx (purple) is used hereafter to denote Pmi, Pmg and Psh, whereas pmiCx (green) is used to denote pmi, pmg and psh.
Athwal and Gill (1966), Gill (1969) and Gill and Athwal (1970) reported two-loci complementary gene control for purple leaf color and described this character under the term 'purple foliage'. The purple parent in the present study showed complete purple foliage, i.e., purple sheath and lamina, including the midrib and margin. When lamina color alone was considered (purple or green) irrespective of that of the midrib, margin and sheath, the segregation ratio was 9:7 in F2 and 1:3 in the testcrosses, suggesting the role of two complementary loci, in agreement with earlier studies of purple foliage.
When the homozygotes for purple sheath, midrib, margin and green lamina (isolated from the F2 progeny) were crossed with the original purple parent (showing purple pigmentation in all of these parts), a 3:1 ratio for purple lamina versus green lamina was obtained in the F2 generation. Since purple pigmentation in the leaf sheath, midrib and margin was a common character of these two parents segregation of these three parts was not expected. Hence, the single gene that segregated for lamina color must have been different from the gene controlling purple pigmentation in the other three parts. We propose the gene symbol 'Pl' for the dominant allele governing the purple color of the lamina and 'pl' for its recessive allele (green lamina).
Plants with a purple lamina and purple midrib complex represented nine sixteenths of the F2 population and must have involved at least one dominant allele at each of the two loci. Using the gene symbols Pl and PmiCx, to designate the two characters, the genotype of this complete purple foliage in F2 could be represented as Pl – PmiCx –.As such, the genotype of plants with only a purple midrib complex (the lamina being green) would be pl pl PmiCx –. The remaining two genotypes, Pl – pmiCx pmiCx and pl pl pmiCx pmiCx result in completely green foliage (in the lamina and midrib complex). The recessive locus pmiCx therefore exerts epistatic control on the Pl locus.
The purple internode character was inferred by Manga et al. ( (1988) to be controlled by a single dominant locus that was very close (2.17 map units) to the block of genes governing purple midrib, margin and sheath. Gill (1969) also studied the inheritance of purple internode (purple stem) and described the recessive nature of the purple pigmentation and the involvement of two loci with a dominant-recessive interaction. In contrast, Koduru and Krishna Rao (1979) suggested the presence of two dominant genes with a complementary action. These various patterns of genetic control can be attributed to differences in the genotypes used in these studies and suggest a more complicated genetic control than that revealed so far in the foregoing cases and in the present study. The gene symbol Ps proposed by Koduru and Krishna Rao (1979) is used here to describe this genetic control.
The results described here indicate that pigmentation in the four parts (internode, leaf sheath, midrib and margin) was inherited en bloc and behaved as if it were under the control of a single dominant locus. Since the purple parent used here was derived from mutagenic treatment (EMS and
y-rays) of the same line as used by Manga et al. ( (1988) it is possible that this treatment may have induced an inversion involving this genomic region, thereby bringing the 'Ps'locus still closer (< 2.17 map units) to the PmiCx locus. The inversion may have been pericentric or so cryptic that it was not identifiable by the presence of bridges and fragments in the anaphase stage of PMC meiosis. This inversion may have also reduced or suppressed recombination in this region, resulting in linkage disequilibrium of the two loci such that only the combinations of alleles causing pigmentation (or lack of it) in these four anatomical parts were able to segregate whereas the theoretically expected recombinants were not observed.
The purple pigmentation of panicles was inferred to be governed by a single dominant gene based on the 3:1 ratio in F2 and 1:1 ratio in the testcrosses. We propose the gene symbol 'Pp' for this locus. Interestingly, the purple panicle character co-segregated with the purple internode complex and their joint segregation showed a 3:1 ratio in F2 and 1:1 ratio in the testcrosses. Only the parental combinations (purple midrib complex + purple panicle and green midrib complex + green panicle) appeared in these segregating generations; no recombinants were observed. Two possible explanations could account for this type of cosegregation: (1) the gene for purple panicle may be located very close to the loci for purple pigmentation of the midrib complex or, alternately, (2) one of the loci involved in the midrib complex may also govern panicle pigmentation in a pleiotropic manner.
Joint segregation of the purple midrib complex with purple stigma or purple seed revealed the same pattern as observed between the purple midrib complex and purple lamina, i.e., a two-loci recessive epistatic gene interaction. This finding suggested that the locus governing the purple midrib complex was also involved in the purple pigmentation of the stigma and seed. Hence, assuming the same logic as set out above in the case of joint segregation involving the purple midrib complex and purple lamina, the following genotypes could be deduced for plants with purple stigma and purple seeds:
PmiCx , Pst Purple midrib complex and purple stigma (9/16 in F2)
PmiCx , pst pst Purple midrib complex and white stigma (3/16 in F2)
pmiCx pmiCx , Pst and pmiCx pmiCx , pst pst Green midrib complex and white stigma (4/16 in F2)
PmiCx , Psd Purple midrib complex and purple seed (9/16 in F2)
PmiCx , psd psd Purple midrib complex and grey seed (3/16 in F2)
pmiCx pmiCx , Psd , and pmiCx pmiCx , psd psd Green midrib complex and grey seed (4/16 in F2)
When the F2 population was classified into purple and non-purple categories, regardless of the color of the midrib complex, the data provided a good fit to the 9:7 ratio. As a further check, the observed frequencies of the phenotypic categories for each of the three cases of joint segregation of the purple midrib complex with (1) lamina pigmentation, (2) stigma color and (3) seed color were also tested for their conformity to the 27:21:16 ratio expected based on three independent loci (one locus for pigmentation of the midrib complex showing recessive epistasis to two independent complementary loci for each of the other three characters) and to a 27:21:9:7 ratio (without assuming recessive epistatis). The observed frequencies in all three cases deviated significantly from the expected ratios for these two segregation patterns, suggesting that either the three locus model is not applicable or that, if three or more loci are involved, then the purple midrib complex locus must be linked with at least one of the loci governing the other character. Further resolution of these linkage relationships was not possible with the present data. The two locus model, which is simpler, was used in this work.
Each of the joint segregation patterns involving (1) lamina pigmentation and stigma color, (2) lamina pigmentation and seed color, and (3) stigma and seed pigmentation deviated significantly from the 81:63:63:49 ratio expected based on four independent loci (with two complementary loci for each character). If one locus is assumed to be common to the two characters, then the theoretical ratio expected based on complementary gene action involving three loci would be 27:9:9:19 (i.e., both characters purple, first one purple and second green, first one green and second purple and both characters green, respectively). The observed frequencies for these character combinations also deviated from this ratio. The significant deviations from both of these independent assortment expectations, together with the high LOD scores, suggested that more than one locus was involved in the expression of purple color in these parts and that either one of these loci was common to all of these markers or that at least one locus for each might be linked to one for the other characters. The presence of gene interactions meant that it was not possible to identify which of these loci were actually linked or to determine their map distances.
The purple midrib complex in the recessive homozygous state (pmiCx pmiCx) was inferred to prevent lamina pigmentation by acting as a recessive loss-of-function allele. Several dominant inhibitor loci associated with anthocyanin pigmentation have been reported in rice (see Reddy 1996). For example, the dominant allele Ilb in rice inhibits purple color development in the leaf blade. PmiCx of the present work is comparable to Ilb of rice, with the difference that pmiCx is inhibitory in a recessive state while Ilb is inhibitory in a dominant state. Another inhibitory gene that inhibits gene color is C1 in maize (Cone et al. (, 1986). This inhibitory locus encodes a DNA-binding protein that is associated with regulation of the anthocyanin biosynthetic pathway. Such inhibitor alleles may be very useful tools in aiding our understanding of the genetic regulatory mechanisms involved in biosynthetic pathways such as those leading to anthocyanin production (Reddy, 1996).
Based on the foregoing discussion of the joint segregation of pigmentation markers, the following model is suggested for the genetic architecture of purple pigmentation in pearl millet. This model assumes that a functional allele at the PmiCx locus is a prerequisite for the development of purple pigmentation in at least four other parts (lamina, panicle, stigma and seed). With the exception of panicle, pigment development in the remaining plant parts requires additional loci, at least one for each part. Thus, PmiCx may regulate the basic steps in anthocyanin pigment development while other loci control the formation of color in specific plant parts. In rice, the genes associated with anthocyanin pigment development form three groups, namely,
(1) structural genes responsible for pigment development,
(2) regulatory genes responsible for the distribution of pigment in various plant parts, and (3) inhibitory genes responsible for the suppression of pigmentation in specific plant parts.
A similar classification of structural and regulatory genes is also possible in maize, where about 20 genes are reported to be involved in the development of pigmentation in various plant parts (reviewed by Mol et al. (, 1998). About seven structural genes encode the biosynthetic enzymes that are coordinately controlled at the transcriptional level by the products of at least two groups of regulatory genes; these genes are responsible for the development and tissue-specific pigmentation of plant and seed tissues in maize. By analogy with the pigment system in rice and maize, the PmiCx gene in pearl millet is a structural gene responsible for the production of anthocyanin and pmiCx is its recessive allele. The remaining loci (Ps, Pl, Pp, Pst and Psd) may have a regulatory role and control the development of pigment in the internode, lamina, panicle, stigma and seed respectively.
SSR analysis and gene tagging
The pigmentation of lamina did not deviate from the expected values for independent assortment with any of the 13 SSR loci used in this study; indeed, the corresponding LOD scores were < 2, indicating that genes controlling these morphological markers sorted independently of the 13 SSR marker loci. Purple pigmentation of the midrib complex, panicle, stigma and seeded deviated significantly from independent assortment with some of the SSR marker loci, as shown by the Chi-square values. When the threshold value for the LOD score was held at 3, only purple seeds showed linkage with Xpsmp2090 (LG 1) and Xpsmp2270 (LG 6).
While a LOD score threshold of 3 is widely considered as a definite indication of a "significant association" among traits, this threshold is nevertheless somewhat arbitrary (Nyholt, 2000). Lander and Kruglyak (1995) proposed the term 'suggestive linkage' for cases that are not significant (< 3) but point to a certain level of association between the markers and the trait, based on other considerations. Van Ooijen (1999) used the LOD threshold of 2.7 to establish suggestive linkage in F2 populations. With reference to characters involving epistasis, quantitative trait loci (QTL) analysis in maize used LOD scores > 2.2 as indications of linkage (Schön et al. (, 1993; Lübberstedt et al. (, 1998; Cardinal et al. (, 2001; Krakowsky et al. (, 2002). Casley et al. ( (1999) used LOD threshold values of 2-2.8 in their detection of QTLs that affected caffeine metabolism in mice.
In view of these suggestions, when the threshold limit for a significant LOD score was kept at 2.8, two more phenotypic markers could be considered as linked to SSR markers, namely, (1) the purple midrib complex with Xpsmp2086 (LG 4) and (2) purple panicle with Xpsmp2086 (LG 4). Interestingly, genes controlling both of these morphological traits were associated with the same SSR marker. As already discussed above, the locus for purple pigmentation of the midrib complex might either be closely linked to the single locus controlling panicle pigmentation or might also govern the pigmentation of earheads in a pleiotropic manner. In either case, this assumption is supported by the inference that genes associated with both of these morphological markers are associated with the same SSR marker and with the same degree of suggestive linkage. However, even this SSR analysis could not clarify whether these two morphological traits involved close linkage or pleiotropism. The location of PmiCx on LG 4 agreed with the findings of Azhaguvel et al. ( (2003) in pearl millet who inferred 'loose linkage' between the purple foliage locus and RFLP markers on LG 4.
The linkage between genes controlling the purple seed trait and two SSR loci mapping on two independent linkage groups (1 and 2) indicated that two independent loci were likely to be involved in the expression of this trait. This conclusion supports the observation that more than one locus (in addition to the purple midrib complex locus) is involved in controlling seed pigmentation.
The apparent independent assortment observed between some of the markers may indicate either that the locus is not present in the same linkage group, or that its position in the linkage group may be located = 50 recombination units (Ø = 0.5) from other loci. The tentative map locations of the four phenotypic marker loci are depicted in Figure 2.
Acknowledgments
The authors thank ICRISAT for providing access to the generous facilities of the Plant Sciences Research Programme R8183 funded by funded by the UK Department for International Development (DFID) and administered by CAZS Natural Resources for the benefit of developing countries. The general facilities provided by the Department of Botany under the auspices of UGC SAP and COSIST are also gratefully acknowledged. P.V. thanks CSIR, New Delhi, for providing a research fellowship.
References
Al-Fakhry AK, Grogan CO and Sarvella P (1965) Some genetic studies on babala, Pennisetum typhoideum L.(Rich.). Z Pflanzenzuecht 54:182-187.
Allard RW (1956) Formulas and tables to facilitate the calculation of recombination values. Hilgardia 24:235-279.
Allouis S, Qi X, Lindup S, Gale MD and Devos KM (2001) Construction of a BAC library of pearl millet, Pennisetum glaucum. Theor Appl Genet 102:1200-1205.
Anand Kumar K and Andrews DJ (1993) Genetics of qualitative traits in pearl millet: A review. Crop Sci 33:1-19.
Athwal DS and Gill BS (1966) Inheritance of bristling and purple pigmentation in Pennisetum typhoides (Burm.) S&HJRes Punjab Agric Univ 3:253-259.
Azhaguvel P, Hash CT, Rangasamy P and Sharma A (2003) Mapping the d1 and d2 dwarfing genes and purple foliage colour locus P in pearl millet. J Hered 94:155-159.
Cardinal AJ, Lee M, Sharpova N, Woodman-Clikeman WL and Long MJ (2001) Genetics, mapping and analysis of quantitative trait loci for resistance to stalk tunneling by the European corn borer in maize. Crop Sci 41:835-845.
Casley WL, Menzies JA, Whitehouse LW and Moon TW (1999) Detection of quantitative trait loci affecting caffeine metabolism by internal mapping in a genome-wide scan of C3H/He J X APN F2 mice. Drug Metab Dispos 27:13751380.
Cone KC, Burr FA and Burr B (1986) Molecular analysis of the maize anthocyanin regulatory locus C1. Proc Natl Acad Sci USA 83:9631-9635.
Devos KM, Pittaway TS, Renolds A and Gale MD (2000) Comparative mapping reveals a complex relationship between the pearl millet genome and those of foxmail millet and rice. Theor Appl Genet 100:190-198.
Gill BS (1969) Inheritance of pigmentation in some plant parts in pearl millet. Ind J Genet 29:468-472.
Gill BS and Athwal DS (1970) Genetics of some ear characters and some plant pigmentation in pearl millet. Ind J Genet 30:519-525.
Hanna WW and Burton GW (1992) Genetics of red and purple plant color in pearl millet. J Hered 83:386-388.
Hash CT (2004) Molecular markers and marker-assisted selection for pearl millet in India. In: Raney T (ed) The State of Food and Agriculture 2003-04. Part I. Agricultural Biotechnology: Meeting the Needs of the Poor? FAO, Rome, pp 14.
IBPGR and ICRISAT (1993) Descriptors for pearl millet, Pennisetum glaucum (L.) R. Br. IBPGR, Rome, and ICRISAT, Patancheru, pp 1-48.
Koduru PRK and Krishna Rao M (1979) Inheritance of anthocyanin and waxy stem in Pennisetum. J Cytol Genet 14:18-21.
Krakowsky MD, Brinkman MJ, Woodman-Clikeman WL and Lee M (2002) Genetic components of resistance to stalk tunneling by the European corn borer in maize. Crop Sci. 42:1309-1315.
Lander ES and Kruglyak L (1995) Genetic dissection of complex traits: Guidelines for interpreting and reporting linkage results. Nat Genet 11:241-247.
Lathrop GM and Lalouel JM (1984) Easy calculation of LOD scores and genetic risks on small computers. Am J Hum Genet 198:460-465.
Liu CJ, Witcombe JR, Pittaway TS, Nash M, Hash CT, Busso CS and Gale MD (1994) An RFLP-based genetic map of pearl millet (Pennisetum glaucum). Theor Appl Genet 89:481487.
Lübberstedt T, Klein D and Melchinger AE (1998) Comparative QTL mapping of resistance to Ustilago maydes across four populations of European flint maize. Theor Appl Genet 97:1321-1330.
Manga V, Saideswara Rao Y, Raju NSN and Subba Rao MV (1988) Inheritance and linkage of genes controlling some purple phenotypes in pearl millet, Pennisetum americanum (L.) leeke. Genet Iberica 40:133-141.
Mol J, Grotewold E and Koes R (1998) How genes paint flowers and seeds. Trends Plant Sci 3:212-217.
Morton NE (1955) Sequential tests for the detection of linkage. Am J Hum Genet 7:277-318.
Nyholt DR (2000) All LODs are not created equal. Am J Hum Genet 67:282-288.
Phul PS, Athwal BS and Gill BS (1969) Genetics of grain color in pearl millet. Ind J Genet Plant Breed 29:438-445.
Qi X, Pittaway TS, Lindup S, Liu H, Waterman E, Padi FK, Hash CT, Zhu J, Gale MD and Devos KM (2004) An integrated genetic map and a new set of simple sequence repeat marker for pearl millet, Pennisetum glaucum. Theor Appl Genet 109:1485-1493.
Reddy AR (1996) Genetic and molecular analysis of the anthocyanin pigmentation pathway in rice. Rice genetics III. Proceedings of the Third International Rice Genetics Symposium,16-20 October, 1995. Manila, pp 341-352.
Saghai-Maroof MA, Soliman KM, Jorgensen RA and Allard RW (1984) Ribosomal DNA spacer length polymorphisms in barley: Mendelian inheritance, chromosomal location and population dynamics. Proc Natl Acad Sci USA 81:80148018.
Schön CC, Lee M, Melchinger AE, Guthriew D and Woodman WL (1993) Mapping and characterization of quantitative trait loci affecting resistance against second-generation European corn borer in maize with the aid of RFLPs. Heredity 70:648-659.
Serraj R, Hash CT, Rizvi SMH, Sharma A, Yadav RS and Bidinger FR (2005) Recent advances in marker-assisted selection for drought tolerance in pearl millet. (Proceedings of the Fifth Asian Crop Science Conference). Plant Prod Sci 8:334-337.
Singh D, Mishra SW, Singh AB and Singh SP (1967) Inheritance in pearl millet. Ind J Genet 27:426-428.
Singh D, Lal S and Yadav HR (1968) Inheritance of certain qualitative characters in pearl millet (Pennisetum typhoides S&H). J Indian Bot Soc 47:388-395.
Snedecor GW and Cochran WG (1967) Statistical Methods. Oxford and IBH Publishing Company, New Delhi, 503 pp. Snustad DP, Simmons MJ and Jenkins JB (1997) Principles of Genetics. John Wiley and Sons Inc., New York, 740 pp.
Tegelstrom H (1992) Detection of mitochondrial DNA fragments. In: Hoelzel AR (ed) Molecular Genetic Analysis of Populations: A Practical Approach. IRL Press, Oxford, pp 89-114.
Van Ooijen JW (1999) LOD significance thresholds for QTL analysis in experimental populations of diploid species. Heredity 83:613-624.
Zhou M (2010) Genotyping and phenotyping errors are the two major reasons that reduce the accuracy of QTL results. Plant Breed 130:203-208.
Internet Resources
Anonymous (2005) Arabidopsis nomenclature. http://www. arabidopsis.org/info/guidelines.jsp. (November 10, 2007).
FAO (2005) Global network on integrated soil management for sustainable use of salt-affected soils. Rome, Italy: FAO Land and Plant Nutrition Management Service. http://www.fao.org/ag/agl/agll/spush. (November 10, 2007).
Supplementary Material
The following online material is available for this article: Table S1: List of 61 SSR primers. Table S2: Linkage assessment of the gene for midrib
complex color and pearl millet SSR marker loci. Table S3 : Linkage assessment of the gene for panicle pigmentation and SSR marker loci. Table S4: Linkage assessment of the genes for purple seed color with SSR marker loci. This material is available as part of the online article from http://www.scielo.br/gmb.
Received: May 4, 2011; Accepted: October 24, 2001.
Associate Editor: Everaldo Gonçalves de Barros
License information: This is an open-access article distributed under the terms of the Creative Commons Attribution License, which permits unrestricted use, distribution, and reproduction in any medium, provided the original work is properly cited.
- Al-Fakhry AK, Grogan CO and Sarvella P (1965) Some genetic studies on babala, Pennisetum typhoideum L.(Rich.). Z Pflanzenzuecht 54:182-187.
- Allard RW (1956) Formulas and tables to facilitate the calculation of recombination values. Hilgardia 24:235-279.
- Allouis S, Qi X, Lindup S, Gale MD and Devos KM (2001) Construction of a BAC library of pearl millet, Pennisetum glaucum Theor Appl Genet 102:1200-1205.
- Anand Kumar K and Andrews DJ (1993) Genetics of qualitative traits in pearl millet: A review. Crop Sci 33:1-19.
- Athwal DS and Gill BS (1966) Inheritance of bristling and purple pigmentation in Pennisetum typhoides (Burm.) S&HJRes Punjab Agric Univ 3:253-259.
- Azhaguvel P, Hash CT, Rangasamy P and Sharma A (2003) Mapping the d1 and d2 dwarfing genes and purple foliage colour locus P in pearl millet. J Hered 94:155-159.
- Cardinal AJ, Lee M, Sharpova N, Woodman-Clikeman WL and Long MJ (2001) Genetics, mapping and analysis of quantitative trait loci for resistance to stalk tunneling by the European corn borer in maize. Crop Sci 41:835-845.
- Casley WL, Menzies JA, Whitehouse LW and Moon TW (1999) Detection of quantitative trait loci affecting caffeine metabolism by internal mapping in a genome-wide scan of C3H/He J X APN F2 mice. Drug Metab Dispos 27:13751380.
- Cone KC, Burr FA and Burr B (1986) Molecular analysis of the maize anthocyanin regulatory locus C1 Proc Natl Acad Sci USA 83:9631-9635.
- Devos KM, Pittaway TS, Renolds A and Gale MD (2000) Comparative mapping reveals a complex relationship between the pearl millet genome and those of foxmail millet and rice. Theor Appl Genet 100:190-198.
- Gill BS (1969) Inheritance of pigmentation in some plant parts in pearl millet. Ind J Genet 29:468-472.
- Gill BS and Athwal DS (1970) Genetics of some ear characters and some plant pigmentation in pearl millet. Ind J Genet 30:519-525.
- Hanna WW and Burton GW (1992) Genetics of red and purple plant color in pearl millet. J Hered 83:386-388.
- Hash CT (2004) Molecular markers and marker-assisted selection for pearl millet in India. In: Raney T (ed) The State of Food and Agriculture 2003-04. Part I. Agricultural Biotechnology: Meeting the Needs of the Poor? FAO, Rome, pp 14.
- IBPGR and ICRISAT (1993) Descriptors for pearl millet, Pennisetum glaucum (L.) R. Br. IBPGR, Rome, and ICRISAT, Patancheru, pp 1-48.
- Koduru PRK and Krishna Rao M (1979) Inheritance of anthocyanin and waxy stem in Pennisetum J Cytol Genet 14:18-21.
- Krakowsky MD, Brinkman MJ, Woodman-Clikeman WL and Lee M (2002) Genetic components of resistance to stalk tunneling by the European corn borer in maize. Crop Sci. 42:1309-1315.
- Lander ES and Kruglyak L (1995) Genetic dissection of complex traits: Guidelines for interpreting and reporting linkage results. Nat Genet 11:241-247.
- Lathrop GM and Lalouel JM (1984) Easy calculation of LOD scores and genetic risks on small computers. Am J Hum Genet 198:460-465.
- Liu CJ, Witcombe JR, Pittaway TS, Nash M, Hash CT, Busso CS and Gale MD (1994) An RFLP-based genetic map of pearl millet (Pennisetum glaucum). Theor Appl Genet 89:481487.
- Lübberstedt T, Klein D and Melchinger AE (1998) Comparative QTL mapping of resistance to Ustilago maydes across four populations of European flint maize. Theor Appl Genet 97:1321-1330.
- Manga V, Saideswara Rao Y, Raju NSN and Subba Rao MV (1988) Inheritance and linkage of genes controlling some purple phenotypes in pearl millet, Pennisetum americanum (L.) leeke. Genet Iberica 40:133-141.
- Mol J, Grotewold E and Koes R (1998) How genes paint flowers and seeds. Trends Plant Sci 3:212-217.
- Morton NE (1955) Sequential tests for the detection of linkage. Am J Hum Genet 7:277-318.
- Nyholt DR (2000) All LODs are not created equal. Am J Hum Genet 67:282-288.
- Phul PS, Athwal BS and Gill BS (1969) Genetics of grain color in pearl millet. Ind J Genet Plant Breed 29:438-445.
- Qi X, Pittaway TS, Lindup S, Liu H, Waterman E, Padi FK, Hash CT, Zhu J, Gale MD and Devos KM (2004) An integrated genetic map and a new set of simple sequence repeat marker for pearl millet, Pennisetum glaucum. Theor Appl Genet 109:1485-1493.
- Reddy AR (1996) Genetic and molecular analysis of the anthocyanin pigmentation pathway in rice. Rice genetics III. Proceedings of the Third International Rice Genetics Symposium,16-20 October, 1995. Manila, pp 341-352.
- Saghai-Maroof MA, Soliman KM, Jorgensen RA and Allard RW (1984) Ribosomal DNA spacer length polymorphisms in barley: Mendelian inheritance, chromosomal location and population dynamics. Proc Natl Acad Sci USA 81:80148018.
- Schön CC, Lee M, Melchinger AE, Guthriew D and Woodman WL (1993) Mapping and characterization of quantitative trait loci affecting resistance against second-generation European corn borer in maize with the aid of RFLPs. Heredity 70:648-659.
- Serraj R, Hash CT, Rizvi SMH, Sharma A, Yadav RS and Bidinger FR (2005) Recent advances in marker-assisted selection for drought tolerance in pearl millet. (Proceedings of the Fifth Asian Crop Science Conference). Plant Prod Sci 8:334-337.
- Singh D, Mishra SW, Singh AB and Singh SP (1967) Inheritance in pearl millet. Ind J Genet 27:426-428.
- Singh D, Lal S and Yadav HR (1968) Inheritance of certain qualitative characters in pearl millet (Pennisetum typhoides S&H). J Indian Bot Soc 47:388-395.
- Snedecor GW and Cochran WG (1967) Statistical Methods. Oxford and IBH Publishing Company, New Delhi, 503 pp.
- Snustad DP, Simmons MJ and Jenkins JB (1997) Principles of Genetics. John Wiley and Sons Inc., New York, 740 pp.
- Tegelstrom H (1992) Detection of mitochondrial DNA fragments. In: Hoelzel AR (ed) Molecular Genetic Analysis of Populations: A Practical Approach. IRL Press, Oxford, pp 89-114.
- Van Ooijen JW (1999) LOD significance thresholds for QTL analysis in experimental populations of diploid species. Heredity 83:613-624.
- Zhou M (2010) Genotyping and phenotyping errors are the two major reasons that reduce the accuracy of QTL results. Plant Breed 130:203-208.
- Anonymous (2005) Arabidopsis nomenclature. http://www. arabidopsis.org/info/guidelines.jsp. (November 10, 2007).
- FAO (2005) Global network on integrated soil management for sustainable use of salt-affected soils. Rome, Italy: FAO Land and Plant Nutrition Management Service. http://www.fao.org/ag/agl/agll/spush (November 10, 2007).
Publication Dates
-
Publication in this collection
16 Feb 2012 -
Date of issue
2012
History
-
Received
04 May 2011 -
Accepted
04 Oct 2001