Abstract
The most critical step in any proteomic study is protein extraction and sample preparation. Better solubilization increases the separation and resolution of gels, allowing identification of a higher number of proteins and more accurate quantitation of differences in gene expression. Despite the existence of published results for the optimization of proteomic analyses of soybean seeds, no comparable data are available for proteomic studies of soybean leaf tissue. In this work we have tested the effects of modification of a TCA-acetone method on the resolution of 2-DE gels of leaves and roots of soybean. Better focusing was obtained when both mercaptoethanol and dithiothreitol were used in the extraction buffer simultaneously. Increasing the number of washes of TCA precipitated protein with acetone, using a final wash with 80% ethanol and using sonication to ressuspend the pellet increased the number of detected proteins as well the resolution of the 2-DE gels. Using this approach we have constructed a soybean protein map. The major group of identified proteins corresponded to genes of unknown function. The second and third most abundant groups of proteins were composed of photosynthesis and metabolism related genes. The resulting protocol improved protein solubility and gel resolution allowing the identification of 122 soybean leaf proteins, 72 of which were not detected in other published soybean leaf 2-DE gel datasets, including a transcription factor and several signaling proteins.
proteomics; Glycine max; 2-DE; protein extraction; leaf proteome
RESEARCH ARTICLE
Method optimization for proteomic analysis of soybean leaf: improvements in identification of new and low-abundance proteins
Rosilene Oliveira MesquitaI; Eduardo de Almeida SoaresI; Everaldo Gonçalves de BarrosII; Marcelo Ehlers LoureiroI
IDepartamento de Biologia Vegetal, Universidade Federal de Viçosa, Viçosa, MG, Brazil
IIDepartamento de Biologia Geral, Universidade Federal de Viçosa, Viçosa, MG, Brazil
Send correspondence to Send correspondence to: Marcelo Ehlers Loureiro Laboratório Fisiologia Molecular de Plantas, Departamento de Biologia Vegetal, Universidade Federal de Viçosa Av. Peter Henry Rolfs s/n, Prédio do CCBII, 4º andar, sala 418 36571-000 Viçosa, MG, Brazil E-mail: mehlers@ufv.br
ABSTRACT
The most critical step in any proteomic study is protein extraction and sample preparation. Better solubilization increases the separation and resolution of gels, allowing identification of a higher number of proteins and more accurate quantitation of differences in gene expression. Despite the existence of published results for the optimization of proteomic analyses of soybean seeds, no comparable data are available for proteomic studies of soybean leaf tissue. In this work we have tested the effects of modification of a TCA-acetone method on the resolution of 2-DE gels of leaves and roots of soybean. Better focusing was obtained when both mercaptoethanol and dithiothreitol were used in the extraction buffer simultaneously. Increasing the number of washes of TCA precipitated protein with acetone, using a final wash with 80% ethanol and using sonication to ressuspend the pellet increased the number of detected proteins as well the resolution of the 2-DE gels. Using this approach we have constructed a soybean protein map. The major group of identified proteins corresponded to genes of unknown function. The second and third most abundant groups of proteins were composed of photosynthesis and metabolism related genes. The resulting protocol improved protein solubility and gel resolution allowing the identification of 122 soybean leaf proteins, 72 of which were not detected in other published soybean leaf 2-DE gel datasets, including a transcription factor and several signaling proteins.
Key words: proteomics; Glycine max, 2-DE, protein extraction, leaf proteome.
Introduction
Two-dimensional polyacrylamide gel electrophoresis (2-DE) is the most widely used method for comparison of quantitative changes in the protein proles of cells, tissues or whole organisms (Herbert et al., 2001). 2-DE is capable of resolving hundreds, and in some cases thousands, of proteins in a single separation procedure.
One of the major limitations of 2-DE methods in proteomics is the fact that low-abundance proteins are rarely seen in traditional 2-D maps, whilst most proteins in vivo are present at low abundance. These low-abundance proteins obviously perform very important roles and include transcription factors, signal transduction proteins and receptors. This limitation of 2-DE methods could be due either to the presence of overwhelming quantities of abundant soluble proteins which obscure the detection of lowabundance proteins or to the fact that these low-abundance proteins may not be completely solubilized prior to 2-DE. Efficient solubilization of protein samples is critical for high performance 2-D electrophoresis.
The most critical step in any proteomics study is protein extraction and sample preparation (Rose et al., 2004). Protein extraction methods can vary widely in reproducibility and representation of the total proteome. Better solubilization increases the separation and resolution of gels allowing identification of a higher number of proteins and more accurate quantification of differences in gene expression. Plant tissues, when compared to animal tissues, often contain lower protein concentrations and extraction is often rendered difficult by the presence of interfering compounds, such as secondary metabolites, phenolic compounds, lipids, nucleic acids, the cell wall and storage polysaccharides. Some of these compounds may interact with proteins and give poor resolution and high background in 2-DE gels. Phenol extraction methods have been developed to overcome some of these problems, but this method may reduce protein yield, is time consuming and requires the use of toxic phenol.
Several publications detailing soybean proteomics are available, with the majority of these publications addressing changes in the proteome of seeds, roots, nodules and hypocotyls (Mooney et al., 2004; Hajduch et al., 2005; Wan et al., 2005; Natarajan et al., 2005, 2006; Djordjevic et al., 2007; Arai et al., 2008; Oehrle et al., 2008; Brechenmacher et al., 2009; Nanjo et al., 2010; Komatsu et al., 2010, 2011; Zhang et al., 2011). Some of these results are also contained in the Soybean Proteome Database (Sakata et al., 2009). Proteomic analyses of soybean leaf, on the other hand, are scarce. In the Soybean Database, only one gel is available, which presents poor resolution and sequencing of only 17 peptides (one peptide per spot) via Edman degradation. Krishnan and Natarajan (2009), using a phenol extraction method, have reported a fractionation technique using 10 mM Ca2+ and 10 mM phytate to precipitate Rubisco from soybean leaf soluble protein extract, and identified only 52 proteins. Ahsan et al. (2010), using a TCA/acetone method, reported the identification of 54 proteins in leaves under heat stress, the majority of these proteins being chaperones.
No published work exists where different methods are compared or optimized for analysis of the leaf proteome in soybean, and despite the great number of proteins expressed in leaves, the results together do not allow identification of more than 100 proteins in this organ. Here we report an improved method for soybean leaf proteome analysis and the identification of 122 leaf proteins, 72 of which, based on published articles and the soybean proteomics web site, have not previously been detected in leaves.
Material and Methods
The TCA/acetone protein extraction method was chosen for optimization (Shen et al., 2002). Around 0.2 g of insoluble PVP (PVPP) was added to 1 g fresh weight of frozen leaves and this mixture was ground under liquid nitrogen. Immediately before thawing, 2 mL of a modified extraction buffer was added (Tris-HCl 40 mM (pH 7.5) 250 mM sucrose, 10 mM EDTA, 1% Triton X-100, 1 mM PMSF; 1 mM DTT; 2% (v/v) f-mercaptoethanol) and extraction was performed for2hat4ºC. Cellular debris was removed by centrifugation at 6,000 x g for 15 min at 4 ºC, and a second centrifugation of the supernatant was performed to completely remove any insoluble components. The precipitation of soluble proteins was performed by adding trichloroacetic acid (TCA) to a final concentration of 10% (w/v) in cold acetone for 16 h at -20 ºC. The protein pellet was harvested by centrifugation at 6,000 x g for 15 min at 4 ºC. The sediment was washed 4 times with cold acetone (10 mL each), and a final wash with ethanol 80% was carried out to remove the excess acetone and to improve the further steps of solubilization of the pellet. The pellet was dried by vacuum centrifugation at room temperature, and re-suspended in a modified 2-DE buffer (7 M urea, 2 M thiourea, 2% CHAPS, 100 mM DTT and 2% IPG buffer (pH 4-7, ampholytes)). Complete solubilization was achieved by sonication with three pulses of 15 s at 1500 Hz. Protein concentration was determined by the Bradford method (Bradford, 1976), using BSA to construct a calibration curve.
The first-dimension IEF was performed using 24 cm linear IPG strips (pH 4-7) in the IPGphor system (GE Healthcare). All IPG strips were rehydrated for 16 h with 250 µL of rehydration buffer (8 M urea, 2% CHAPS, 0.5% ampholytes, 0.002% bromophenol blue) containing 1 mg of protein. Voltage settings for IEF were 250 V for 1 h, 500 V for 1 h, followed by a gradient from 1000-7000 V until achievement of a total of 5.2 kVh, followed by running at 8000 V to achieve 40 kVh. The focused strips were either electrophoresed runned immediately on a 2-D gel or stored at -80 ºC until further use. For the 2-D gel electrophoresis, the gel strips were incubated with equilibration buffer 1 [50 mM Tris-HCl (pH 8.8), 6 M urea, 30% glycerol, 2% SDS, 0.002% bromophenol blue, 1% DTT] and equilibration buffer 2 [50 mM Tris-HCl (pH 8.8), 6 M urea, 30% glycerol, 2% SDS, 0.002% bromophenol blue, 2.5% iodoacetamide] for 15 min each and subsequently placed onto 12.5% polyacrylamide gel (26 x 32 cm) with a Trisglycine buffer system as described by Laemmli (1970). Strips were overlaid with agarose sealing solution (0.25 M Tris base, 1.92 M glycine, 1% SDS, 0.5% agarose, 0.002% bromophenol blue) using an Ettan Daltsix electrophoresis system (GE Healthcare). the initial 2D eletrophoresis setting was 5 W (constant and maximal 20 mA), followed by a separation run for 6 h using 12 W per gel (constant and maximal 50 mA). The 2D-PAGE gels were visualized by staining with colloidal Coomassie blue G-250 as described by Newsholme et al. (2000). The gels were fixed overnight in 50% ethanol and 3% phosphoric acid and then washed three times for 30 min with distilled water. Gels were pre-stained for 1 h in 34% methanol, 17% ammonium sulfate and 3% phosphoric acid and then stained for 2 days in the same solution containing Coomassie blue G-250 (0.066%). Image acquisition was done using an ImageScanner III (GE Healthcare) and images were analyzed using ImageMaster 2D Platinum v. 7 software (GE Healthcare).
Protein spots were excised from the stained gels and washed first with distilled water to remove ammonium sulfate and then with 50% acetonitrile containing 25 mM ammonium bicarbonate to destain the gel plugs. The gel plugs were dehydrated with 100% acetonitrile, dried under vacuum, and then re-swollen with 20 µL of 10 µg/mL trypsin (modified porcine trypsin, sequencing grade, Promega, Madison, WI, USA) in 25 mM ammonium bicarbonate. Digestion was performed overnight at 37 ºC. The resulting tryptic fragments were extracted by sonication in 50% acetonitrile and 5% trifluoroacetic acid. The extracts were dried and then dissolved in 50% acetonitrile and 0.1% trifluoroacetic acid.
MALDI-TOF-MS analysis of tryptic peptides was performed using a Bruker UltraFlexIII spectrometer. Samples were co-crystallized with CHCA matrix and spectra acquired with 40 shots of a 337 nm nitrogen laser operating at 20 Hz. Protein identification was done by searching the National Center for Biotechnology Information (NCBI) non-redundant database using the Mascot search engine and a probability-based scoring system (Perkins et al., 1999). The following parameters were used for database searches with MALDI-TOF peptide mass fingerprinting data: monoisotopic mass, 25 ppm mass accuracy, trypsin as digesting enzyme with one missed cleavage allowed, carbamidomethylation of cysteine as a fixed modification, oxidation of methionine, N-terminal pyroglutamic acid from glutamic acid or glutamine according to variable modifications.
For database searches with MS/MS spectra, the following parameters were used: average mass; 1.5 Da peptide and MS/MS mass tolerance; peptide charge of +1, +2 or +3; trypsin as digesting enzyme with 1 missed cleavage allowed; carbamidomethylation of cysteine as a fixed modification; oxidation of methionine, N-terminal pyroglutamic acid from glutamic acid or glutamine according to variable modifications. For MALDI-TOF-MS data to qualify as a positive identification, a protein's score had to equal or exceed the minimum significant score (Perkins et al., 1999). Positive identification of proteins by MS/MS analysis required a minimum of two unique peptides, with at least one peptide having a significant ion score.
Results and Discussion
To evaluate the effect of the modifications to the TCA/acetone method, protein extractions were carried out using leaves and roots of soybean plants collected five weeks after germination. The phenol-base method (Wang et al., 2003), the original TCA/acetone method and the modified TCA/acetone method described here were tested using three biological replicates (three different extracts for each method from three different plants). An example of the 2-DE gels using 1 mg protein extract is shown in Figure 1.
As evidenced in Figure 1 A and C, the phenol-based method resulted in a higher level of subunits of the enzyme ribulose 1,5 bisphosphate carboxylase oxygenase (Rubisco). Furthermore, lower resolution was observed. This result is important for attempts to help improve the detection of low-abundance proteins in 2-DE gels of leaf protein. In leaves, Rubisco represents around 50% and 30% of total protein in C3 and C4 plants respectively (Feller et al., 2008). This high abundance hinders proteomic assessment of low-abundance proteins (Xi et al., 2006) and masks the ability of neighboring proteins to be detected (Corthalis et al., 2000; Shaw and Riederer, 2003; Cho et al., 2008). It also significantly limits the dynamic resolution of the gel (Herman et al., 2003). Krishnan and Natarajan (2009) described a method using a TCA/acetone extraction procedure together with a phytic acid treatment to deplete Rubisco in soybean leaf 2-DE gels. However, the number of proteins detected by these authors was in fact lower than that obtained when using the unmodified TCA/acetone method (511 spots versus 582 when using the phenol method). These results suggest that additional changes to the protocol, besides Rubisco depletion, are needed to increase the number of detectable proteins. In contrast to the situation with leaf tissue, the unmodified TCA/acetone method increases the number of spots detected in roots (634 spots using the phenol method versus 705). These differences support the inference that different sample preparation methods are required to produce optimal 2-DE results from different plant organs.
The effect of the modifications to the TCA/acetone method can be observed in Figure 2. A comparison between Figures 2A and 2B indicates that the modifications made to the TCA/acetone method improved both the solubilization of proteins and gel resolution, as indicated by the increase in spot number by 57% and 5.4% in leaf and root respectively (in leaves, 802 spots in modified method versus 511, and 743 to 705 in roots). No significant differences in the content of the large and small Rubisco subunits were observed with the modification of this method. These results ilustrate that significant increase in protein detection in 2D gels could be obtained by increase in solubilizatio besides no changes in Rubisco content. Particularly interesting is the increase in low molecular weight proteins in leaves resulting from the introduced modifications. These differences were reproducible and seen in all three repetitions for each method (data not shown). Effects of the modified method on the root proteome were also observed (Figures 2C, D), although the improvement was not as clear as that observed for leaf tissue. In roots, the number of spots also increased with the modifications made to the method, but the problem of low resolution in the region of low PI/higher molecular weight still remained, despite the improvement in resolution for higher pI proteins and the fact that more proteins were detected overall.

The improvements in the resolution of 2-DE gels for leaf tissue (Figure 3) were reflected by the successful identification of 122 proteins, based on the peptides matched in the NCBI protein bank, as described in Table 1. Figure 3 also shows that proteins coding for the large subunit of Rubisco are separated into several spots around the 53 KDa region of the gels.
Although several additional proteins could potentially be identified, we used a Mowse score of 40 as a minimum confidence threshold for identification in this study. This score varied from 44 to 175 across identified proteins, with an average of 80 in this dataset (a score greater than 67% means identification is significant at p < 0.05), while the number of peptide matches/protein identified varied between 4 and 27 (average of 11), and the sequence coverage varied between 13% and 100% (average of 35%).
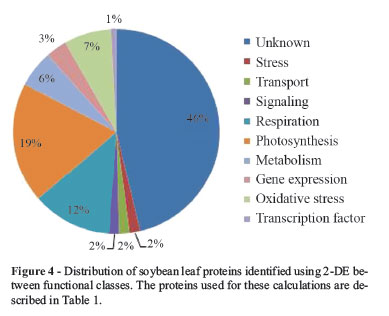
The functional classification of the identified proteins is presented in Figure 4. Almost 50% of the identified proteins corresponded to proteins with unknown function, these representing the largest group. Proteins involved in primary metabolism represented the second largest group, which includes genes involved in photosynthesis, respiration and biosynthetic metabolism, the latter mainly represented by enzymes involved in amino acid biosynthesis.
The fact that a transcription factor and some proteins involved in signaling were present in the small part of the leaf proteome analyzed indicates that some low-abundance proteins could be quantified using the 2-DE method presented herein. For yeast, the most abundant proteins are present at around 2,000,000 copies per cell, which represents 4% of total protein, whereas the least abundant proteins, which likely includes transcription factors and signaling proteins (Futcher et al., 1999), are present at around 100 copies per cell (a difference of four orders of magnitude). Low-abundance proteins are generally considered difficult or even impossible to detect using 2-D gel electrophoresis (Görg et al., 2004; Krishnan and Natarajan, 2009), while genes of unknown function typically encode low-abundance proteins. Taken together, these facts are indicative that the modifications made to the TCA/acetone method allow increased detection of proteins expressed at low levels. This in turn can be partially explained by both increases in protein solubility. Based on published results and those available in the Soybean Proteomic Database that describe soybean leaf proteins (Krishnan and Natarajan, 2009; Sakata et al., 2009; Ahsan et al., 2010), we were able to add 72 new proteins to the soybean 2-DE profile, the majority of these being proteins of low abundance.
Acknowledgments
We would like to thank Dr. Thomas Christopher Rhys Williams for critical reading of the manuscript, and CNPq for financial support of the Genosoja network project.
Internet Resources
Soybean Database, http://proteome.dc.affrc.go.jp/Soybean/ (accessed January 10, 2010).
License information: This is an open-access article distributed under the terms of the Creative Commons Attribution License, which permits unrestricted use, distribution, and reproduction in any medium, provided the original work is properly cited.
- Ahsan N, Donnart T, Nouri MZ and Komatsu S (2010) Tissue-specific defense and thermo-adaptive mechanisms of soybean seedlings under heat stress revealed by proteomic approach. J Proteome Res 9:4189-4204.
- Arai Y, Hayashi M and Nishimura M (2008) Proteomic analysis of highly purified peroxisomes from etiolated soybean cotyledons. Plant Cell Physiol 49:526-539.
- Brechenmacher L, Lee J, Sachdev S, Song Z, Nguyen TH, Joshi T, Oehrle N, Libault M, Mooney B, Xu D et al. (2009) Establishment of a protein reference map for soybean root hair cells. Plant Physiol 149:670-682.
- Bradford MM (1976) A rapid and sensitive method for the quantitation of microgram quantities of protein utilizing the principle of dye binding. Anal Biochem 72:248-254.
- Cho JH, Hwang H, Cho MH, Kwon YK, Jeon JS, Bhoo SH and Hahn TR (2008) The effect of DTT in protein preparations for proteomic analysis: Removal of a highly abundant plant enzyme, ribulose bisphosphate carboxylase/oxygenase. J Plant Biol 51:297-301.
- Corthalis GL, Wasinger VC, Hochstrasser DF and Sanchez JC (2000) The dynamic range of protein expression: A challenge for proteomic research. Electrophoresis 21:1104-1115.
- Djordjevic MA, Oakes M, Li DX, Hwang CH, Hocart CH and Gresshoff PM (2007) The glycine max xylem sap and apoplast proteome. J Proteome Res 6:3771-3779.
- Feller U, Anders I and Mae T (2008) Rubiscolytics: Fate of Rubisco after its enzymatic function in a cell is terminated. J Exp Bot 59:1615-1624.
- Futcher B, Latter GI, Monardo P, McLaughlin CS and Garrels JI (1999) A sampling of the yeast proteome. Mol Cell Biol 19:7357-7368.
- Görg A, Weiss W and Dunn MJ (2004) Current two-dimensional electrophoresis technology for proteomics. Proteomics 4:3665-3885.
- Hajduch M, Ganapathy A, Stein JW and Thelen JJ (2005) A systematic proteomic study of seed filling in soybean: Establishment of high-resolution two-dimensional reference maps, expression profiles, and an interactive proteome database. Plant Physiol 137:1397-1419.
- Herbert BR, Harry JL, Packer NH, Gooley AA, Pedersen SK and William KL (2001) What place for polyacrylamide in proteomics? Trends Biotechnol 19:S3-S9.
- Herman EM, Helm RM, Jung R and Kinney AJ (2003) Genetic modification removes an immunodominant allergen from soybean. Plant Physiol 132:36-43.
- Komatsu S, Kobayashi Y, Nishizawa K, Nanjo Y and Furukawa K (2010) Comparative proteomics analysis of differentially expressed proteins in soybean cell wall during flooding stress. Amino Acids 39:1435-1449.
- Komatsu S, Yamamoto A, Nakamura T, Nouri MZ, Nanjo Y, Nishizawa K and Furukawa K (2011) Comprehensive analysis of mitochondria in roots and hypocotyls of soybean under flooding stress using proteomics and metabolomics techniques. Proteome Res 10:3993-4004.
- Krishnan HB and Natarajan SS (2009) A rapid method for depletion of Rubisco from soybean (Glycine max) leaf for proteomic analysis of lower abundance proteins. Phytochemistry 70:1958-1964.
- Laemmli U (1970) Cleavage of structural proteins during the assembly of the head of the bacteriophage T4. Nature 227:680-685.
- Mooney BP, Krishnan HB and Thelen JJ (2004) High-throughput peptide mass fingerprinting of soybean seed proteins: Automated workflow and utility of UniGene expressed sequence tag databases for protein identification. Phytochemistry 65:1733-1744.
- Nanjo Y, Skultety L, Ashraf Y and Komatsu S (2010) Comparative proteomic analysis of early-stage soybean seedlings responses to flooding by using gel and gel-free techniques. J Proteome Res 9:3989-4002.
- Natarajan S, Xu C, Caperna TJ and Garrett WM (2005) Comparison of protein solubilization methods suitable for proteomic analysis of soybean seed proteins. Anal Biochem 342:214-220.
- Natarajan SS, Xu C, Bae H, Caperna TJ and Garrett WM (2006) Characterization of storage proteins in wild (Glycine soja) and cultivated (Glycine max) soybean seeds using proteomic analysis. J Agric Food Chem 54:3114-3120.
- Newsholme SJ, Maleeft BF, Steiner S, Anderson NL and Schwartz LW (2000) Two-dimensional electrophoresis of liver proteins: Characterization of a drug-induced hepatomegaly in rats. Electrophoresis 21:2122-2128.
- Oehrle NW, Sarma AD, Waters JK and Emerich DW (2008) Proteomic analysis of soybean nodule cytosol. Phytochemistry 69:2426-2438.
- Perkins DN, Pappin DJC, Creasy DM and Cottrell JS (1999) Probability-based protein identification by searching sequence databases using mass spectrometry data. Electrophoresis 20:3551-3567.
- Rose JK, Bashir S, Giovannoni JJ, Jahn MM and Saravanan RS (2004) Tackling the plant proteome: Practical approaches, hurdles and experimental tools. Plant J 39:715-733.
- Sakata K, Ohyanagi H, Nobori H, Nakamura T, Hashiguchi A, Nanjo Y, Mikami Y, Yunokawa H and Komatsu S (2009) Soybean Proteome Database: A data resource for plant differential omics. J Proteome Res 8:3539-3548.
- Shaw MM and Riederer BM (2003) Sample preparation for twodimensional gel electrophoresis. Proteomics 3:1408-1417.
- Shen S, Matsubae M, Takao T, Tanaka N and Komatsu S (2002) A proteomic analysis of leaf sheaths from rice. J Biochem 132:613-620.
- Wan J, Torres M, Ganapathy A, Thelen J, Dague BB, Mooney B, Xu D and Stacey G (2005) Proteomic analysis of soybean root hairs after infection by Bradyrhizobium japonicum Mol Plant Microbe Interact 18:458-467.
- Wang W, Scali M, Vignani R, Spadafora A, Sensi E, Mazzuca S and Cresti M (2003) Protein for two-dimensional electrophoresis from olive leaf, a plant tissue containing hight levels of interfering compounds. Electrophoresis 24:2369-2375.
- Zhang YM, Zhao JM, Xiang Y, Bian XC, Zuo QM, Shen Q, Gai JY and Xing H (2011) Proteomics study of changes in soybean lines resistant and sensitive to Phytophthora soja Proteome Sci 9:52-59.
- Xi J, Wang X, Li S, Zhou X, Yue L, Fan J and Hao D (2006) Polyethylene glycol fractionation improved detection of lowabundant proteins by two-dimensional electrophoresis analysis of plant proteome. Phytochemistry 67:2341-2348.
Send correspondence to:
Publication Dates
-
Publication in this collection
01 June 2012 -
Date of issue
2012