
Abstract
The objectives of this study were to 1) compare four models for breeding value prediction using genomic or pedigree information and 2) evaluate the impact of fixed effects that account for family structure. Comparisons were made in a Nellore-Angus population comprising F2, F3 and half-siblings to embryo transfer F2 calves with records for overall temperament at weaning (TEMP; n = 769) and Warner-Bratzler shear force (WBSF; n = 387). After quality control, there were 34,913 whole genome SNP markers remaining. Bayesian methods employed were BayesB ( π = 0.995 or 0.997 for WBSF or TEMP, respectively) and BayesC (π = 0 and π), where π is the ideal proportion of markers not included. Direct genomic values (DGV) from single trait Bayesian analyses were compared to conventional pedigree-based animal model breeding values. Numerically, BayesC procedures (using π) had the highest accuracy of all models for WBSF and TEMP ( ρgg = 0.843 and 0.923, respectively), but BayesB had the least bias (regression of performance on prediction closest to 1, βy,x = 2.886 and 1.755, respectively). Accounting for family structure decreased accuracy and increased bias in prediction of DGV indicating a detrimental impact when used in these prediction methods that simultaneously fit many markers.
Bayesian inference; crossbred cattle; genomic prediction; model comparison
Comparison of breeding value prediction for two traits in a Nellore-Angus crossbred population using different Bayesian modeling methodologies
Lauren L. Hulsman HannaI, * Correspondence: David G. Riley Department of Animal Science Texas A&M University College Station, Texas 77843, USA E-mail: david-riley@tamu.edu; Dorian J. GarrickII; Clare A. GillI; Andy D. HerringI; James O. SandersI; David G. RileyI
IDepartment of Animal Science, Texas A&M University, College Station, Texas, USA
IIDepartment of Animal Science, Iowa State University, Ames, Iowa, USA
Correspondence Correspondence: David G. Riley Department of Animal Science Texas A&M University College Station, Texas 77843, USA E-mail: david-riley@tamu.edu
ABSTRACT
The objectives of this study were to 1) compare four models for breeding value prediction using genomic or pedigree information and 2) evaluate the impact of fixed effects that account for family structure. Comparisons were made in a Nellore-Angus population comprising F2, F3 and half-siblings to embryo transfer F2 calves with records for overall temperament at weaning (TEMP; n = 769) and Warner-Bratzler shear force (WBSF; n = 387). After quality control, there were 34,913 whole genome SNP markers remaining. Bayesian methods employed were BayesB ( π = 0.995 or 0.997 for WBSF or TEMP, respectively) and BayesC (π = 0 and π), where π is the ideal proportion of markers not included. Direct genomic values (DGV) from single trait Bayesian analyses were compared to conventional pedigree-based animal model breeding values. Numerically, BayesC procedures (using π) had the highest accuracy of all models for WBSF and TEMP ( ρgg = 0.843 and 0.923, respectively), but BayesB had the least bias (regression of performance on prediction closest to 1, βy,x = 2.886 and 1.755, respectively). Accounting for family structure decreased accuracy and increased bias in prediction of DGV indicating a detrimental impact when used in these prediction methods that simultaneously fit many markers.
Keywords: Bayesian inference, crossbred cattle, genomic prediction, model comparison.
Introduction
Expected progeny differences (EPD) are widely used for selection in the US beef cattle industry. Current international research efforts are focused on incorporating genomic prediction methods into national evaluations that produce EPD (Hayes et al., 2009b; VanRaden and Sullivan, 2010; Saatchi et al., 2011, 2012, 2013; Rius-Vilarrasa et al., 2012). The landmark paper by Meuwissen et al. (2001) described genomic predictions using Bayesian inference that they believed capitalized on linkage disequilibrium (LD) between observed markers and unobserved quantitative trait loci (QTL).
For these methods, prediction procedures can be a two-part process using the Bayesian framework of 1) training to calculate substitution effects of markers in historical data using both phenotypes and genotypes; and 2) using markers genotyped in individuals outside the training data to calculate direct genomic values (DGV) based on substitution effects estimated in training. The size of the reference (i.e., training) population and its relationship to the prediction population are important considerations to achieve higher precision (accuracy) of genomic breeding values in animals with only genomic information available (de Roos et al., 2009; Ibáñez-Escriche et al., 2009; Habier et al., 2010, 2013; Kizilkaya et al., 2010; Saatchi et al., 2010; Toosi et al., 2010).
Relatedness among animals and between breeds (in crossbred or composite populations) can directly impact prediction accuracy (de Roos et al., 2009; Ibáñez-Escriche et al., 2009), at least in part due to inconsistent LD patterns among cattle breeds (Gautier et al., 2007; Bovine HapMap Consortium, 2009). Few studies have investigated the use of genomic prediction models using field or research data from crossbred populations (Hayes et al., 2009a; Snelling et al., 2012). The objectives of this study were to 1) evaluate and compare four models (three Bayesian using genomic information and a pedigree-based animal model) in predicting genetic merit using all animals in the training population; and 2) evaluate the effects on genetic merit prediction of including or excluding fixed effects to account for family structure. These objectives were investigated using single trait analyses of two traits measured in a Nellore-Angus crossbred population.
Materials and Methods
Cattle, genotypes, and traits
The cattle population, genotypes, and traits used in this study were previously described in Hulsman Hanna et al. (2014). Briefly, the cattle population consisted of Nellore-Angus F2 (embryo transfer and natural service reciprocal crosses), F3 and natural service half-siblings to embryo transfer F2 animals. The population was characterized by 3 distinct cycles (designated as Cycle 1, 2, and 3), where Cycle 1 included embryo transfer Nellore-Angus F2 and natural service half-sibling calves, Cycle 2 included natural service F2 calves, and Cycle 3 included natural service F3 calves. All procedures involving animals were approved by the Texas A&M Institutional Care and Use Committee. Animals were genotyped on the Bovine SNP50 Version 1 & 2 assays (Illumina Inc., San Diego, CA) and, after quality edits, had 34,913 SNP available for genomic prediction analyses.
Overall temperament at weaning (TEMP), a subjective measurement on a 1 to 9 scale, where 1 is docile and 9 is wild or unruly (n = 772) was used in this study. Four evaluators scored each animal in this study for TEMP, but average TEMP score across all evaluators was used in subsequent analyses. Warner-Bratzler shear force (WBSF), a quantitative measurement using a United Testing machine (United 5STM-500, Huntington Beach, CA) with a 11.3 kg load cell and a v-notch WBSF attachment, was used to measure the peak force required to shear each core and reflect meat tenderness. Only electrically-stimulated data was available for all steers in Cycles 1, 2, and 3 and were therefore used. The average shear value of the electrically stimulated side of each steer, averaged across all shears per steak, for 14-d aged steaks (n = 390) were used for analyses in this study.
Statistical analysis
In a previous study with these animals, Hulsman Hanna et al. (2014) fitted a model for TEMP that included fixed effects of sex (n = 2), family nested within sire (n = 31), birth year-season combinations (n = 10), and temperament scoring pen nested within birth year-season combinations (n = 42). The corresponding model for WBSF included fixed effects of type of cross (an effect based upon the combination of sire and dam breeds, n = 12) and date of shear (n = 16).
Fixed effects that accounted for family structure such as family nested within sire or type of cross may complement or be confounded with genomic information in association analyses; the effect of inclusion of such effects on accuracy of prediction of breeding values is unknown. Genotype frequency differences between families could result in false associations while training markers for prediction of breeding values using Bayesian methods (Lander and Schork, 1994; Marchini et al., 2004; Janss et al., 2012). Previous cattle studies typically include polygenic effects to account for family (e.g., Michal et al., 2006; Alexander et al., 2009). In addition, studies with the current cattle population (Riley et al., 2013; Hulsman Hanna et al., 2014) utilized fixed effects to account for family structure in association analyses, but as the effect on genomic predictions of including those effects is unknown, analyses in this study were evaluated with or without significant family structure fixed effects. A traditional animal model that accounted for family in the conventional manner using pedigree was also fitted as a control.
For both traits, only those animals with phenotypes, genotypes and all relevant fixed effects required in the model were used in the study (n = 769 or 387 for TEMP or WBSF, respectively). Correlations between TEMP and WBSF phenotype records were previously calculated using either Pearson's or Spearman's Rank correlation coefficients in Hulsman Hanna et al. (2014), and TEMP and WBSF were not found to be correlated in either analysis (p > 0.05).
Bayesian methods employed
BayesB (Meuwissen et al., 2001) and BayesC (Kizilkaya et al., 2010; Habier et al., 2011) methods were utilized in this study as in Hulsman Hanna et al. (2014). Both methods require that π, a proportion of markers not contributing to the trait of interest, is known. The best fitting π (designated as  ) was determined in Hulsman Hanna et al. (2014) as the value that accounted for the majority of genetic variation with the fewest number of markers. For TEMP and WBSF, was determined to be 0.997 and 0.995, respectively. An additional analysis was run using BayesC procedures with π = 0 (i.e., all markers were included in the model). Analyses were performed using GenSel software (see Internet References section) to generate DGV for animals included in the training group by summing across posterior means of random marker effects multiplied by the centered number of copies of the B allele for each individual. All animals with data available were used in the training population for comparison purposes, where cross-validation procedures were conducted following this study and will be reported separately. For each trait, comparisons were made between DGV and estimated breeding values (EBV) produced using a traditional animal model (i.e., traditional pedigree-based Best Linear Unbiased Predictions). Estimated breeding values from an animal model were generated using ASReml software (see Internet References section), fitting the same fixed effects as used in genomic analyses, but with random animal effects with variance-covariance determined from pedigree information, and random uncorrelated residuals.
Comparison criteria for breeding value prediction
Pearson correlation coefficients (r) between true breeding values (BV) and direct genomic values (DGV; i.e., BV based on genomic prediction) can be used in simulations to assess accuracy (Meuwissen et al., 2001). Simple correlation coefficients between de-regressed EBV and DGV can be used to assess accuracy with field data, but that correlation underestimates true accuracy (Saatchi et al., 2012). Accuracy of EBV (or DGV) predicted in this study was calculated following the standardization method proposed by Saatchi et al. (2011) to adjust for underestimation, and takes the form of:
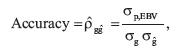
where  is the covariance of phenotype or trait with either EBV or DGV,
  is the standard deviation of the additive genetic effects estimated from the training population reported as the posterior mean or variance estimate (i.e., the mean estimate over the iterations or chains run) of the analysis conducted, and
  is the standard deviation of the additive genetic effects from the population (i.e., animals with phenotypic and genotypic information), which is the expected additive genetic effects of that population for the given trait and is calculated as:
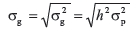
where h2 is the heritability of the trait calculated during the analyses (e.g., the genomic heritability for Bayesian methods and based on variance components for the animal model), and  is the phenotypic variance calculated from animals with genotypic data. The simple linear regression coefficient (
 ), which can be used to give an indication of biasedness (Saatchi et al., 2013) was calculated. The simple linear regression coefficient () is the regression of phenotype on EBV (or DGV) and takes the form of:

where  is the covariance of EBV (or DGV) and phenotype and
  is the variance of the EBV (or DGV) calculated from the DGV or EBV produced in that respective analysis using the sample variance function in Microsoft Excel 2013. This regression parameter should be 1 if unbiased (Saatchi et al., 2011, 2013).
The relative ranking of EBV (or DGV) is critical in determining candidates that will be selected and this was assessed in two ways: 1) using Spearman Rank correlation coefficients and 2) coarser assessments of rank changes calculated as the percentage and number of individuals whose EBV (or DGV) were in different quartiles from distinct analyses.
Results
Breeding value prediction
The estimates of heritability for WBSF and TEMP using an animal model (single trait analysis, additive genetic component only) were 0.055 ± 0.091 and 0.35 ± 0.115, respectively. Originally, the type of cross effect was fitted for WBSF analyses using the animal model. This resulted in a heritability estimate of zero, however, and was subsequently excluded from runs using the animal model. Posterior means of genomic heritability estimated through Bayesian methods were higher for WSBF, but lower for TEMP (Table 1).
EBV from animal models for WBSF and TEMP were compared to DGV from three Bayesian methods with and without inclusion of fixed effects to account for significant family structure (Tables 2-4). Numerically, BayesC models with  had the highest accuracy for either trait, regardless whether fixed effects for family structure were included or not (Table 1). The simple linear regression coefficient (
 ) of DGV on phenotype was closest to 1 for BayesB for both traits and either statistical model, indicating less bias for that method. All analyses had significant Spearman rank correlation coefficients (Table 4) for trait breeding values predicted from the fitted models. Inclusion of fixed effects to account for family structure resulted in lower Spearman Rank correlation coefficients for DGV from any Bayesian model compared with EBV from a traditional animal model excluding such fixed effects. Spearman Rank correlation coefficients for EBV with DGV were always lower than those among DGV from the fitted Bayesian models. In general, correlation coefficients for DGV estimated from models that included fixed effects for family structure were lower, indicating substantial influence of that effect on the relative ranking of animals.
No more than 2% of individuals had EBV in different analyses that were more than 2 quartiles apart for WBSF or TEMP (Tables 2 and 3). When fixed effects accounting for family structure were included in the model, WBSF and TEMP were similar in the percentage of animals that changed n quartiles, although that percentage for WBSF was typically numerically lower than TEMP. When the statistical model did not include fixed effects for family structure, TEMP had a larger reduction in the number of animals (and, therefore, lower percentage) that changed n quartiles.
When the statistical model included fixed effects accounting for family structure, between Bayesian analyses more than 71% of the DGV remained in the same quartile for either trait, but less than 55% were in the same quartile when comparing DGV from any Bayesian analysis to EBV from the animal model for that respective trait (Tables 2 and 3). Exclusion of fixed effects for family resulted in more stable (relative to quartile ranks) across-analysis estimation, where over 80% were estimated in the same quartile with the Bayesian analyses, and approximately 71% for any Bayesian estimation with those from animal models (Tables 2 and 3).
Discussion
The heritability estimate for WBSF is low in comparison to most values reported for Bos taurus cattle with electrically-stimulated carcasses, which have ranged from 0.11 to 0.53 depending on breed or cross and number of measured animals (Shackelford et al., 1994; reviewed by Minick et al., 2004). Although the estimate of heritability for WBSF did not differ from zero in the present study, others have reported low values using Bos indicus cattle due to an apparently low additive genetic component for this trait in these types of cattle (Riley et al., 2003; Smith et al., 2007). The effect of electrical stimulation on these carcasses could be reducing variation in WBSF resulting in lower estimates of heritability. Reported estimates of heritability for temperament measured as flight speed have been reported as high as 0.40 (Burrow, 2001) and the estimate of 0.35 using an animal model from the present study is consistent with those estimates.
Traditional animal models account for family structure using pedigree information (Henderson, 1973, 1975), but with the inclusion of genomic information, differences in genotype frequency due to family structure could lead to false associations, and therefore impact the accuracy of DGV. Results from the present study indicated that inclusion of fixed effects to account for differences between families decreased accuracy and increased bias associated with prediction of DGV in this crossbred population. When fixed effects for family structure were not included, Bayesian methods were more accurate, had less bias, and had less re-ranking between analyses compared to an animal model.
As all animals with data available were included in the training population, accuracy was expected to be moderately high, even though the sample sizes were lower than 1,000 individuals (the typical standard minimum for running genetic evaluations) because the information used to estimate effects were from those animals. Without including family structure fixed effects, accuracy for Bayesian and animal model analyses were higher than may typically be expected given the sample sizes, but training population accuracies are not typically reported and, therefore, comparisons are not available. Although all analyses showed bias in the estimates, it was reduced when the sample size increased (e.g., TEMP vs. WBSF), which was expected.
Habier et al. (2013) investigated genomic BLUP and its ability to capture relationships, model LD and exploit cosegregation (the deviation from independent segregation of alleles if loci are linked). They found that genomic BLUP can exploit LD, cosegregation, and additive-genetic relationships captured by SNP, but suggest that Bayesian methods with t-distributed priors (e.g., BayesB or BayesC in this study) may be more beneficial to account for rapid decay in LD. This would explain why the Bayesian methods utilized in this study did not need fixed effects to account for family structure and further suggested that inclusion of those fixed effects detrimentally impacted the ability of Bayesian methods to utilize genomic information from the current population.
Simulation studies have reported superior accuracy values from Bayesian methods relative to traditional animal models (e.g., Meuwissen et al., 2001; Piyasatian et al., 2006). Habier et al. (2011) concluded that the optimal Bayesian modeling method to use was trait dependent when they compared six Bayesian models. In the case of TEMP and WBSF, there was little difference between Bayesian models, although BayesC procedures using had numerically higher accuracies, but larger bias than BayesB for both traits.
As accuracy and the regression coefficient were calculated using genetic parameter estimates from the respective analyses (see Table 1), it is interesting to note the differences seen when comparing the variance of the breeding values estimated ( ; either DGV or EBV, which are technically estimates of additive genetic effects and should be equivalent to
  ) to the additive genetic variance calculated through the analysis (
 ). When family structure fixed effects were included in Bayesian analyses, the ratio of to ranged from 0.246 to 0.289, which was much lower than when excluded (0.544 to 0.561 for Bayesian models and 0.479 for the animal model) of TEMP. This difference was not observed for WBSF, most likely due to sample size.
Furthermore, the estimate (either the posterior mean or variance component) of additive genetic variance ( ) was always lower than what was expected (
 ). Ultimately, the differences found between the three variance parameters of
  and provide an assessment of the estimation procedure, as
  is the value
  and
and  are expected to be. This is not surprising or novel, as these models do not take into account interactions between or within causative loci for a given trait, thereby creating missing variance (e.g., see Zuk et al. (2012) discussion on phantom heritability). Differences may have been strongly influenced by sample size available for this study. The results from this study show, however, that the variance estimated from the analysis (
 ) compared to the expected variance (
 ) are relatively similar, the difference is consistent across the models within a trait, and the use of family structure fixed effects in the model should not be included for prediction of genetic merit.
Acknowledgments
This project was partially supported by National Research Initiative competitive grant no. 2008-35205-18767 from the USDA National Institute of Food and Agriculture Animal Genome Program, by Texas AgriLife Research, and the Beef Checkoff. The authors wish to express their appreciation for this support. The authors also appreciate the contributions of J.E. Sawyer, B.D. Johnson, D.A. Gann, Jr., J. Miller, and all personnel at the Texas A&M AgriLife McGregor Research Center. This study was included in the dissertation submitted in partial fulfillment of the doctoral degree requirements of the first author.
Internet Resources
Bos taurus 6.1 on NCBI, http://www.ncbi.nlm.nih.gov/ projects/mapview/map_search.cgi?taxid = 9913 (April 8, 2013).
GenSel software, http://taurus.ansci.iastate.edu/gensel (April 8, 2013).
ASReml software, www.vsni.co.uk (April 8, 2013).
Received: March 27, 2014
Accepted: July 23, 2014
Associate Editor: Bertram Brenig
License information: This is an open-access article distributed under the terms of the Creative Commons Attribution License, which permits unrestricted use, distribution, and reproduction in any medium, provided the original work is properly cited.
* Present address: Department of Animal Sciences, North Dakota State University, Fargo, North Dakota 58108, USA.
- Alexander LJ, Kuehn LA, Smith TPL, Matukumalli LK, Mote B, Koltes JE, Reecy J, Geary TW, Rule DC and MacNeil MD (2009) A Limousin specific myostatin allele affects longissimus muscle area and fatty acid profiles in a Wagyu-Limousin F2 population. J Anim Sci 87:1576-1581.
- Bovine HapMap Consortium (2009) Genome-wide survey of SNP variation uncovers the genetic structure of cattle breeds. Science 324:528-532.
- Burrow HM (2001) Variances and covariances between productive and adaptive traits and temperament in a composite breed of tropical beef cattle. Liv Prod Sci 70:213-233.
- de Roos APW, Hayes BJ and Goddard ME (2009) Reliability of genomic predictions across multiple populations. Genetics 183:1545-1553.
- Gautier M, Faraut T, Moazami-Gaudarzi K, Navratil V, Foglio M, Grohs C, Boland A, Garnier J-G, Biochard D, Lathrop GM et al. (2007) Genetic and haplotypic structure in 14 European and African cattle breeds. Genetics 177:1059-1070.
- Habier D, Tetens J, Seefried FR, Lichtner P and Thaller G (2010) The impact of genetic relationship information on genomic breeding values in German Holstein cattle. Genet Sel Evol 42:5.
- Habier D, Fernando R, Kizilkaya K and Garrick D (2011) Extension of the Bayesian alphabet for genomic selection. BMC Bioinf 12:e186.
- Habier D, Fernando RL and Garrick DJ (2013) Genomic BLUP decoded: A look into the blackbox of genomic prediction. Genetics 194:597-607.
- Hayes BJ, Bowman PJ, Chamberlain AC, Verbyla K and Goddard ME (2009a) Accuracy of genomic breeding values in multi-breed dairy cattle populations. Genet Sel Evol 41:51.
- Hayes BJ, Bowman PJ, Chamberlain AJ and Goddard ME (2009b) Invited review: Genomic selection in dairy cattle: Progress and challenges. J Dairy Sci 92:433-443.
- Henderson CR (1973) Sire evaluation and genetic trends. J Anim Sci 1973:10-41.
- Henderson CR (1975) Use of relationships among sires to increase accuracy of sire evaluation. J Dairy Sci 58:1731-1738.
- Hulsman Hanna LL, Garrick DJ, Gill CA, Herring AD, Riggs PK, Miller RK, Sanders JO and Riley DG (2014) Genome-wide association study of temperament and tenderness using different Bayesian approaches in a Nellore-Angus crossbred population. Livest Sci 161:17-27.
- Ibáñez-Escriche N, Fernando RL, Toosi A and Dekkers JCM (2009) Genomic selection of purebreds for crossbred performance. Genet Sel Evol 41:12-22.
- Janss L, de los Campos G, Sheehan N and Sorensen D (2012) Inferences from genomic models in stratified populations. Genetics 192:693-704.
- Kizilkaya K, Fernando RL and Garrick DJ (2010) Genomic prediction of simulated multibreed and purebred performance using observed fifty thousand single nucleotide polymorphism genotypes. J Anim Sci 88:544-551.
- Lander ES and Schork NJ (1994) Genetic dissection of complex traits. Science 265:2037-2048.
- Marchini J, Cardon LR, Phillips MS and Donnelly P (2004) The effects of human population structure on large genetic association studies. Nat Genet 36:512-517.
- Meuwissen THE, Hayes BJ and Goddard ME (2001) Prediction of total genetic value using genome-wide dense marker maps. Genetics 157:1819-1829.
- Michal JJ, Zhang ZW, Gaskins CT and Zhang Z (2006) The bovine fatty acid binding protein 4 gene is significantly associated with marbling and subcutaneous fat depth in Wagyu x Limousin F2 crosses. Anim Genet 37:400-402.
- Minick JA, Dikeman ME, Pollak EJ and Wilson DE (2004) Heritability and correlation estimates of Warner-Bratzler shear force and carcass traits from Angus-, Charolais-, Hereford-, and Simmental-sired cattle. Can J Anim Sci 84:599-609.
- Piyasatian N, Fernando RL and Dekkers JCM (2006) Genomic selection for composite line development using low density marker maps. In: Proceedings from 8th World Congress on Genetics Applied to Livestock Production, Belo Horizonte, MG, Brazil, pp. 22-65.
- Riley DG, Chase CC, Hammond AC, West RL, Johnson DD, Olson TA and Coleman SW (2003) Estimated genetic parameters for palatability traits of steaks from Brahman cattle. J Anim Sci 81:54-60.
- Riley DG, Welsh Jr TH, Gill CA, Hulsman LL, Herring AD, Riggs PK, Sawyer JE, and Sanders JO (2013) Whole genome association of SNP with newborn calf cannon bone length. Livest Sci 155:186-196.
- Rius-Vilarrasa E, Brøndum RF, Strandén I, Guldbrandtsen B, Strandberg E, Lund MS and Fikse WF (2012) Influence of model specifications on the reliabilities of genomic prediction in a Swedish-Finnish red breed cattle population. J Anim Breed Genet 2012:1-11.
- Saatchi M, Miraei-Ashtiani SR, Nejati Javaremi A, Moradi-Shahrebabak M and Mehrabani-Yeghaneh H (2010) The impact of information quantity and strength of relationship between training set and validation set on accuracy of genomic estimated breeding values. Afr J Biotech 9:438-442.
- Saatchi M, McClure MC, McKay SD, Rolf MM, Kim J, Decker JE, Taxis RM, Chapple RH, Romey HR, Northcutt SL et al. (2011) Accuracies of genomic breeding values in American Angus beef cattle using K-means clustering for cross-validation. Genet Sel Evol 43:40.
- Saatchi M, Schnabel RD, Rolf MM, Taylor JF and Garrick DJ (2012) Accuracy of direct genomic breeding values for nationally evaluated traits in US Limousin and Simmental beef cattle. Genet Sel Evol 44:1-10.
- Saatchi M, Ward J and Garrick DJ (2013) Accuracies of direct genomic breeding values in Hereford beef cattle using national or international training populations. J Anim Sci 91:1538-1551.
- Shackelford SD, Koohmaraie M, Cundiff LV, Gregory KE, Rohrer GA and Savell JW (1994) Heritabilities and phenotypic and genetic correlations for bovine postrigor calpastatin activity, intramuscular fat content, Warner-Bratzler shear force, retail product yield, and growth rate. J Anim Sci 72:857-863.
- Smith T, Domingue JD, Paschal JC, Franke DE, Bidner TD and Whipple G (2007) Genetic parameters for growth and carcass traits of Brahman steers. J Anim Sci 85:1377-1384.
- Snelling WM, Cushman RA, Fortes MRS, Reverter A, Bennett GL, Keele JW, Keuhn LA, McDaneld TG, Thallman RM and Thomas MG (2012) Physiology and Endocrinology Symposium: How single nucleotide polymorphism chips will advance our knowledge of factors controlling puberty and aid in selecting replacement beef females. J Anim Sci 90:1152-1165.
- Toosi A, Fernando RL and Dekkers JCM (2010) Genomic selection in admixed and crossbred populations. J Anim Sci 88:32-46.
- VanRaden PM and Sullivan PG (2010) International genomic evaluation methods for dairy cattle. Genet Sel Evol 42:7.
- Zuk O, Hechter E, Sunyaev SR and Lander ES (2012) The mystery of missing heritability: Genetic interactions create phantom heritability. Proc Natl Acad Sci USA 109:1193-1198.
Publication Dates
-
Publication in this collection
14 Nov 2014 -
Date of issue
Dec 2014
History
-
Accepted
23 July 2014 -
Received
27 Mar 2014


