Abstract
Different types of water bodies, including lakes, streams, and coastal marine waters, are often susceptible to fecal contamination from a range of point and nonpoint sources, and have been evaluated using fecal indicator microorganisms. The most commonly used fecal indicator is Escherichia coli, but traditional cultivation methods do not allow discrimination of the source of pollution. The use of triplex PCR offers an approach that is fast and inexpensive, and here enabled the identification of phylogroups. The phylogenetic distribution of E. coli subgroups isolated from water samples revealed higher frequencies of subgroups A1 and B2(3) in rivers impacted by human pollution sources, while subgroups D1 and D2 were associated with pristine sites, and subgroup B1 with domesticated animal sources, suggesting their use as a first screening for pollution source identification. A simple classification is also proposed based on phylogenetic subgroup distribution using the w-clique metric, enabling differentiation of polluted and unpolluted sites.
E. coli; phylogenetic groups; pollution sources; interaction networks; social network analysis
Clustering of water bodies in unpolluted and polluted environments based on Escherichia coli phylogroup abundance using a simple interaction database
Nancy de Castro StoppeI,II; Juliana Saragiotto SilvaII,III; Tatiana Teixeira TorresII,IV; Camila CarlosI; Elayse Maria HachichV; Maria Inês Zanoli SatoV; Antonio Mauro SaraivaII,VI; Laura Maria Mariscal OttoboniI
ICentro de Biologia Molecular e Engenharia Genética, Universidade Estadual de Campinas, Campinas, SP, Brazil
IINúcleo de Pesquisa em Biodiversidade e Computação, Universidade de São Paulo, São Paulo, SP, Brazil
IIIInstituto Federal de Educação, Ciência e Tecnologia de Mato Grosso, Cuiabá, MT, Brazil
IVDepartamento de Genética e Biologia Evolutiva, Instituto de Biociências, Universidade de São Paulo, São Paulo, SP, Brazil
VDepartamento de Análises Ambientais, Companhia de Tecnologia de Saneamento Ambiental, São Paulo, SP, Brazil
VIDepartamento de Engenharia de Computação e Sistemas Digitais, Escola Politécnica, Universidade de São Paulo, São Paulo, SP, Brazil
Send correspondence to Send correspondence to: Nancy de Castro Stoppe Centro de Biologia Molecular e Engenharia Genética, Universidade Estadual de Campinas Caixa Postal 6010 13083-875 Campinas, SP, Brazil E-mail: ncstoppe@gmail.com
ABSTRACT
Different types of water bodies, including lakes, streams, and coastal marine waters, are often susceptible to fecal contamination from a range of point and nonpoint sources, and have been evaluated using fecal indicator microorganisms. The most commonly used fecal indicator is Escherichia coli, but traditional cultivation methods do not allow discrimination of the source of pollution. The use of triplex PCR offers an approach that is fast and inexpensive, and here enabled the identification of phylogroups. The phylogenetic distribution of E. coli subgroups isolated from water samples revealed higher frequencies of subgroups A1 and B23 in rivers impacted by human pollution sources, while subgroups D1 and D2 were associated with pristine sites, and subgroup B1 with domesticated animal sources, suggesting their use as a first screening for pollution source identification. A simple classification is also proposed based on phylogenetic subgroup distribution using the w-clique metric, enabling differentiation of polluted and unpolluted sites.
Keywords:E. coli, phylogenetic groups, pollution sources, interaction networks, social network analysis.
Introduction
The microbiological quality of water is usually evaluated by means of fecal indicator microorganisms, and Escherichia coli has often been used because it is a normal inhabitant of the intestinal tracts of most warm-blooded animals. However, the traditional methods used hitherto have not allowed differentiation among host sources. Reliable and accurate source identification methods are extremely important for the control of fecal contamination from relevant animal origins, to protect recreational water users from waterborne pathogens, and to preserve the integrity of drinking water supplies (Roslev and Bukh, 2011; USEPA, 2005).
Clermont et al. (2000) developed a method for the assignment of E. coli isolates to four major phylogenetic groups: A, B1, D, and B2. Because of its si mplicity and rapidity, it has been widely used for purposes including ecological niche differentiation, propensity to cause diseases, and fecal source tracking (Johnson et al., 2004; Escobar- Paramo et al., 2004; Orsi et al., 2007, 2008; Walk et al., 2007; Gordon et al., 2008; Carlos et al., 2010; Ratajczak et al., 2010; Figueira et al., 2011). The technique is based on triplex PCR and uses a combination of three loci (chuA, yjaA, and TspE4.C2). In order to improve the discriminative power of analyses when several isolates per sample were considered, Escobar-Páramo et al. (2006) proposed the use of all the combinations of genetic markers, resulting in the definition of seven subgroups (A0, A1, B1, B22, B23, D1, and D2).
Algorithms, metrics, and computational resources for analyzing interaction networks can be used as important tools to systematically measure interdependencies among molecular markers and water bodies. The conceptual foundations of these tools are the same as in Social Network Analysis (SNA), which provides algorithms and metrics to characterize the network structure and to identify cohesive subgroups.
The aim of this work was to develop a classification of E. coli strains isolated from water bodies, based on phylogenetic subgroups, and to try to associate it with the pollution sources by means of the w-clique metric.
Materials and Methods
Sample collection
Water samples from twelve rivers and reservoirs with different pollution levels in the State of São Paulo (Figure 1 and Table 1) were collected in sterilized bottles according to Standard Methods (APHA, 2010). The sampling locations belonged to the surface water monitoring network established by CETESB (the São Paulo State environmental agency), whose Surface Water Monitoring (SWM) program includes physical, chemical, and biological analysis of water in the twenty-two Watershed Management Units (WMU) located in the State of São Paulo, Brazil. Two indices are currently used for the evaluation of domestic effluent dilution and the trophic state of the water bodies. The water quality index (WQI) is derived from a combined set of variables including pH, dissolved oxygen, biological oxygen demand, E. coli, water temperature, total nitrogen, total phosphorus, total suspended matter, and turbidity. The trophic state index (TSI), on the other hand, is based on the concentrations of chlorophyll and phosphorus. The WQI values range from 0 to 100, with five intervals to indicate the water quality: 0-19 (very bad); 20-36 (bad); 37-51 (acceptable); 52-79 (good); and 80-100 (very good). The TSI ranges from < 47 to > 67, with five intervals indicating the condition of the environment: < 47 (ultraoligotrophic); 48-52 (oligotrophic); 53-59 (mesotrophic); 60-63 (eutrophic); and > 67 (hypereutrophic). The SWM program has been operated by CETESB since 1974, and all the measurements since that time have been recorded. Point pollution sources are recorded in the São Paulo State Point Source Pollution Inventory. Furthermore, events that could influence the analysis (such as animals at the sampling site, or illegal sewage discharges) are reported in the sample collection form and then recorded in the water-monitoring database. The present study used all the historical data in order to identify the main pollution source at each site. The samples were collected bimonthly between July 2009 and April 2010 (CETESB, 2010, 2011).
Isolation of strains
Samples were analyzed using the membrane filter technique according to U.S. Environmental Protection Agency Method 1603 (USEPA, 2002). Briefly, 0.01100 mL volumes of water were filtered onto a 0.45 µm membrane and incubation was performed using modified mTEC agar (at 35 ± 0.5 ºCfor 2h and at44.5 ± 0.2 ºC for 22-24 h). Approximately ten typical colonies (red to magenta in color) from each sample (12 sites and five collections) were streaked onto Endo agar LES (Difco), incubated for 24 h at 35 ºC, and tested for citrate utilization, lactose fermentation, oxidase, L-lysine decarboxylase, motility, glucose and sucrose fermentation, tryptophan deamination, indole production, urea hydrolysis, and sulfide production. A typical E. coli profile was re-isolated on nutrient agar, incubated for 24 h at 35 ºC, and kept at -70 ºC in tryptic soy broth (Difco) with 10% (v/v) glycerol prior to further analysis (ATCC, 2010).
Phylogenetic grouping
Genomic DNA from the strains was isolated with the Wizard Genomic DNA Purification Kit (Promega), used according to the manufacturer's instructions, and the phylogenetic grouping of E. coli strains was determined as previously described by Clermont et al. (2000). The strains were assigned to the seven phylogenetic subgroups according to the combination of PCR products of the genes chuA, yjaA, and DNA fragment TspE4.C2, as follows: A0 (-/-/-); A1 (-/+/-); B1 (-/-/+); B22 (+/+/-); B23 (+/+/+); D1 (+/-/-); and D2 (+/-/+) (Escobar-Páramo et al., 2006).
Statistical analysis
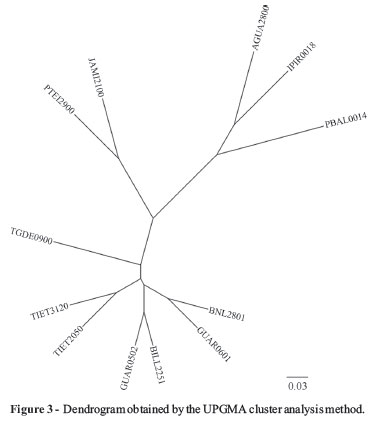
A chi-square test was used to determine whether differences in the distributions of phylogenetic subgroups among rivers and reservoirs were significant. Correlation analysis was performed using the Mantel test, by comparing two dissimilarity matrices, calculated with the vegdist function (with Bray-Curtis index as parameter). These analyses were performed using the community ecology package Vegan for R (Oksanen, 2011). The similarity matrices were then prepared as a complement to the dissimilarity matrices (1-vegdist (matrix, "Bray")). Phylogenetic subgroups were clustered by their similarity matrices using the UPGMA (unweighted pair group method with arithmetic mean) algorithm, and a dendrogram was constructed using the DendroUPGMA computational tool (Garcia-Vallve et al., 1999).
Social Network Analysis metric
The SNA metric w-clique has been used to identify cohesive subgroups (clusters) in network structures (Araújo et al., 2008). A clique is composed of a set of three or more vertices totally connected to each other (Nooy et al., 2005). The w-clique considers vertex groups in which all the vertices are connected to each other by "strong" interactions (the weights of which are higher than the average network weight).
Data analysis
The data used in the present study were obtained from a bipartite microbiological interaction database, composed of a weighted matrix (isolates abundance), in which the rows corresponded to water bodies and the columns corresponded to phylogroups (Table 1). In order to identify cohesive subgroups in a weighted interaction network we used the program "Dieta1" which is based on the complex network theory (Araújo et al., 2008). In this analysis, the data type used was integers, Monte Carlo bootstrapping employed 1000 replications, the diet proportion calculation used numerical sums, and the weight factor was five. A binary matrix (0/1) was obtained in which cells containing the number one represented interactions whose weights were higher than the average network weight (w-cliques).
The Pajek program was used to transform the network from arcs to edges (Batagelj and Mrvar, 1998). The matrix was submitted to the Ucinet program for identifying w-cliques. Two output files were generated, one showing the cliques found (identification of the individual memberships) and the other with the cluster diagram (dendrogram) (Everett and Borgatti, 1998; Borgatti et al., 2002).
Results
A total of 543 strains were isolated from twelve rivers and reservoirs (Figure 1 and Table 1), and were classified according to the phylogenetic subgroups. By selecting 10 colonies from 12 sites in five sampling events we would expect 600 isolated strains. However, for some sites and sampling events, it was not possible to obtain 10 strains because either 10 typical colonies were not grown or 10 typical strains were not obtained in the confirmatory tests.
The observed distribution of the phylogenetic subgroups among rivers (Figure 2) was significantly different from the expected frequencies (χ2 = 217.22, df = 66, p < 0.005). The majority of environmental strains belonged to subgroup A0, even though river and reservoir sites had different sources of pollution.
Only seven strains isolated from different sites (TIET2050, TIET3120, TGDE0900, JAMI02100, PTEI02900, and BILL2801) presented a chuA-, yjaA+, TspE4.C2+ profile (data not shown), and in accordance with Rodrigues-Siek et al. (2005) were assigned as group B1. The lower frequency observed here indicates a rare occurrence of this profile, as was also observed by Higgins et al. (2007), who found it in only one out of 68 strains isolated from surface water samples. Gordon et al. (2008) characterized 662 E. coli strains, including those from different hosts and environmental strains and did not observe any strain matching this profile.
Although most human strains belong to group A, Orsi et al. (2007) and Carlos et al. (2010) suggested the use of group B2 as an indicator of human pollution sources, due to its recurrence in this host. In agreement with these results, the present data also revealed a high prevalence of this group for the sites strongly impacted by human sources (BILL2801, BILL2251, GUAR0502, and GUAR0601).
Ten years ago, group A was the most frequent in the Billings and Guarapiranga Reservoirs, followed by groups B1, D, and B2 (Orsi et al., 2007). The present results also showed a predominance of group A, but a decrease of B1 and a significant increase of the frequency of group B2. This group seemed to be associated with human pollution sources, which have increased in recent years. In the last decade, the populations living in the areas surrounding the dams of the Billings and Guarapiranga Reservoirs have increased by 24% and 30%, respectively. Part of this population has no access to either sewage collection or wastewater treatment, which could explain the observations. Furthermore, at these sites the WQI has changed from good to bad in the last ten years.
The sites where domesticated animal pollution sources were expected did not present similar phylogroup distribution patterns. TIET3120 and TGDE0900 were located downstream of cities that discharge untreated wastewater, as a result of which the phylogroups distribution was analogous to the sites with human pollution sources. Meanwhile, AGUA2800 and JAMI2100 were located in areas with agricultural activities and the seasonal presence of cattle, and the most frequent subgroups were A0 and B1, as observed by others (Higgins et al., 2007; Ishii et al., 2007; Carlos et al., 2010).
Two of the pristine sites (IPIR0018 and PBAL0014) showed a high frequency of group D, as also observed by Higgins et al. (2007) for an unpolluted site, suggesting an association with wildlife. Surprisingly, the other sites in more natural areas (TIET2050 and PTEI2900) showed higher frequencies of groups A and B2, similar to the human source sites. Sites IPIR0018 and PBAL0014 were located inside an environmental protection area (from source to mouth) and were truly pristine, while sites TIET2050 and PTEI2900 might have received some input from anthropogenic sources, despite the good water quality indices obtained for these sites during the study period (Table 1) (CETESB, 2010, 2011). As these sites were not located inside protected areas, they could have been affected by nonpoint pollution sources, or even illegal discharges.
The most abundant subgroup, A0, was not used for classification of the water samples, as a high frequency of incorrect assignments was observed for strains that failed to yield any PCR product in a previous study (Gordon et al., 2008). Higher frequencies of the subgroups A1 and B23 evidenced human contamination, while B1 reflected domesticated animal contamination, and D1 and D2 were characteristic of pristine environments.
The Mantel test for correlation between the quality indices, WQI and TSI, showed only a weak correlation (r = 0.36, p = 0.014), while the phylogenetic subgroup distribution showed no correlation with the WQI and TSI indices (r = 0.2537, p = 0.074). This observation indicates that both indices may have missed important information for pollution evaluation. Since the phylogenetic subgroup distribution seemed to be a suitable tool for identification of sources of pollution, it could be adopted for pollution classification of water bodies.
In an attempt to cluster the rivers according to the source and degree of pollution, the data were evaluated using correspondence analysis; however, a spread distribution was observed (data not shown). A matrix of similarity among the isolates was calculated and clustered by UPGMA, and showed two groups (Figure 3). The first cluster contained two pristine sites (IPIR0018 and PBAL0014) and one animal site (AGUA2800), which was unexpected since these sites did not share similar characteristics. This was also observed in the second group, where sites with different degrees and sources of pollution were clustered, suggesting that this tool was not appropriate for this biological enquiry.
The influence of geographical location appeared to be an important factor in the distribution of phylogenetic subgroups. The w-clique metric clustered the water bodies in two groups (Figure 4). The first group contained the water bodies belonging to the São Paulo Metropolitan Area, and the other clustered those located far from the metropolitan region. The geographical location reflected the degree of pollution, since for many years the São Paulo Metropolitan Area has suffered from air and water pollution. Interestingly, at the sites where nonpoint animal pollution sources were expected (TGDE0900, JAMI2100, and AGUA2800), no specific distribution was observed, suggesting that animal sources were of lesser importance. Similar cluster results were observed when the strains belonging to subgroup A0 were removed (data not shown).
Discussion
The distribution of the phylogenetic subgroups in environmental samples has shown dissimilar patterns. For instance, group B1 was the most common (over 70%) for beaches in California and for environmental waters surrounding sewage treatment plants in Australia (Hamilton et al., 2010; Anastasi et al., 2012). Previous studies of surface waters (lakes and rivers) found that half of the isolates belonged to phylogroup B1, suggesting that this was the most frequent group in environmental media (Power et al., 2005; Hamelin et al., 2007; Walk et al., 2007). Importantly, the structure of an E. coli population in water can be influenced by other factors, such as the hydrological conditions in the watershed and the geographical location (Ratajczak et al., 2010; Tenallion et al., 2010). Some studies reported that subgroup A0 was more environmentally adapted (Higgins et al., 2007; Walk et al., 2009; Figueira et al., 2011), while B22 was the least common subgroup found in rivers and reservoirs (Figueira et al., 2011), in line with the results obtained here.
The two water quality indices, WQI and TSI, were unable to reveal the occurrence of contamination, suggesting that other tools should also be used for pollution evaluation. On the other hand, phylogenetic subgroups could be used as a first screening for pollution source identification (subgroups A1 and B23 for human contamination, B1 for domesticated animal contamination, and D1 and D2 for pristine environments).
A new phylotyping method was recently proposed by Clermont et al. (2013). The most important improvement of the new quadruplex PCR-based method is the ability to detect E. coli strains belonging to phylogroups C, E, F, and clade I. This could have improved the discrimination power of the present analysis. However, the use of network metrics showed that the origin of the samples could be assigned, even without the information for phylogroups C, E, F, and clade I. W-clique subclusters might be obtained by including rare phylogroups.
Gordon et al. (2008) demonstrated that 15-20% of Australian E. coli isolates typed as A0,D1,orD2 using the triplex PCR method were incorrectly assigned. They showed that most of the incorrect assignments were observed for strains that failed to yield any PCR products using the triplex method (Clermont et al., 2000). To circumvent this problem, in the present work the isolates classified as A0 were excluded from the downstream analysis. In the case of the D phylogroups, it is possible that there was a pool of rare strains. However, this would not invalidate the results. As argued by Gordon et al. (2008), the triplex method (Clermont et al., 2000) is still an excellent and cost-effective method for assigning strains of E. coli to phylogroups, because the fraction of strains that cannot be assigned to a phylogroup and are incorrectly assigned is very low.
Using clique identification, it was therefore possible to discover new patterns in a simple interaction database, such as clustering of water bodies (in unpolluted and polluted environments) based on phylogroup abundance. This clustering was not revealed using traditional methods, illustrating the innovative contribution of the proposed approach.
The results demonstrated that the commonly used water quality indices could not address all aspects of the evaluation of domestic effluent dilution and the trophic state of the water bodies, since the TIET2050 and TGDE00900 samples presented good average scores (Table 1), but had phylogenetic group distributions that were more related to polluted sites, according to the w-clique classification. These findings suggest that the w-clique metric could be used as a complementary tool in pollution classification and evaluation of the degree of contamination of inland waters.
Acknowledgments
We thank Dr. Marco Mello for helping with our data analysis. The São Paulo State Research Foundation (FAPESP, project no. 2007/55312-6) supported this work. NCS received a fellowship from FAPESP (project no. 2010/15222-0). TTT received a research fellowship from the National Council for Technological and Scientific Development (CNPq). JSS is a PhD student supported by CAPES, FAPEMAT, and IFMT. The Research Center on Biodiversity and Computing (BioComp) was supported by the USP Provost's Office for Research.
Internet Resources
Received: February 26, 2014
Accepted: June 27, 2014.
Associate Editor: Igor Schneider
- Anastasi EM, Matthews B, Stratton HM and Katouli M (2012) Pathogenic Escherichia coli found in sewage treatment plants and environmental waters. Appl Environ Microbiol 78:5536-5541.
- Araújo MS, Guimarães Jr PR, Svanbäck R, Pinheiro A, Guimarães P, Reis SFD and Bolnick DI (2008) Network analysis reveals contrasting effects of intraspecific competition on individual vs. population diets. Ecology 89:1981-1993.
- Batagelj V and Mrvar A (1998) Pajek -program for large network analysis. Connections 21:47-57.
- Borgatti SP, Everett MG and Freeman LC (2002) Ucinet for Windows: Software for Social Network Analysis. Analytic Technologies, Harvard.
- Carlos C, Pires MM, Stoppe NC, Hachich EM, Sato MZ, Amaral TATG, Amaral LA and Ottoboni LMM (2010) Escherichia coli phylogenetic group determination and application in the identification of the major animal source of fecal contamination. BMC Microbiol 10:e161.
- Clermont O, Bonacorsi S and Bingen E. (2000) Rapid and simple determination of the Escherichia coli phylogenetic group. Appl Environ Microbiol 66:4555-4558.
- Clermont O, Christensonm JK, Denamur E and Gordon DM (2013) The Clermont Escherichia coli phylo-typing method revisited: Improvement of specificity and detection of new phylo-groups. Environ Microbiol Rep 5:58-65.
- Escobar-Páramo P, Grenet K, LeMenac'h A, Rode L, Salgado E, Amorin C, Gouriou S, Picard B, Rahimy C, Andremont A, et al. (2004) Large-scale population structure of human commensal Escherichia coli isolates. Appl Environ Microbiol 70:5698-5700.
- Escobar-Páramo P, LeMenac'h A, LeGall T, Amorin C, Gouriou S, Picard B, Skurnik D and Denamur E (2006) Identification of forces shaping the commensal Escherichia coli genetic structure by comparing animal and human isolates. Environ Microbiol 8:1975-1984.
- Everett MG and Borgatti SP (1998) Analyzing clique overlap. Connections 21:49-61.
- Figueira V, Sera E and Manaia CM (2011) Differential patterns of antimicrobial resistance in population subsets isolated from waste-and surface waters. Sci Total Environ 409:1017-1023.
- Garcia-Vallve S, Palau J and Romeu A (1999) Horizontal gene transfer in glycosyl hydrolases inferred from codon usage in Escherichia coli and Bacillus subtilis Mol Biol Evol 9:1125-1134.
- Gordon DM, Clermont O, Tolley H and Denamur E. (2008) Assigning Escherichia coli strains to phylogenetic groups: Multi-locus sequence typing vs. the PCR triplex method. Environ Microbiol 10:2484-2496.
- Hamelin K, Bruant G, El-Shaarawi A, Hill S, Edge TA, Fairbrother J, Harel J, Maynard C, Masson L and Brouseeau R (2007) Occurrence of virulence and antimicrobial resistance genes in Escherichia coli isolates from different aquatic ecosystems within the St. Clair River and Detroit River areas. Appl Environ Microbiol 73:477-484.
- Hamilton MJ, Hadi AZ, Griffith JF, Ishii S and Sadowsky MJ (2010) Large scale analysis of virulence genes in Escherichia coli strains isolated from Avalon Bay, CA. Water Res 44:5463-5473.
- Higgins J, Hohn C, Hornor S, Frana M, Denver M and Joerger R (2007) Genotyping of Escherichia coli from environmental and animal samples. J Microbiol Methods 70:227-235.
- Ishii S, Meyer KP and Sadowsky MJ (2007) Relationship between phylogenetic groups, genotypic clusters, and virulence factors of Escherichia coli strains form diverse human and animal sources. Appl Environ Microbiol 73:5703-5710.
- Johnson LAK, Brown MB, Carruthers EA, Ferguson JA, Dobek PE and Sadowsky MJ (2004) Sample size, library composition, and genotypic diversity among natural populations of Escherichia coli from different animals influence accuracy of determining sources of fecal pollution. Appl Environ Microbiol 70:4478-4485.
- Nooy W, Mrvar A and Batagelj V (2005) Exploratory Network Analysis with Pajek. Cambridge University Press, Cambridge, 334 pp.
- Orsi RH, Stoppe NC, Sato MIZ, Gomes TAT, Prado PI, Manfio GP and Ottoboni LMM (2007) Genetic variability and pathogenicity potential of Escherichia coli isolated from recreational water reservoirs. Res Microbiol 158:420-427.
- Orsi RH, Stoppe NC, Sato MIZ, Prado PI and Ottoboni LMM (2008) Phylogenetic group distribution among Escherichia coli isolated from rivers in Sao Paulo State, Brazil. World J Microbiol 24:1573-1577.
- Power ML, Littlefield-Wyer J, Gordon DM, Veal DA and Slade MB (2005) Phenotypic and genotypic characterization of encapsulated Escherichia coli isolated from blooms in two Australian lakes. Environ Microbiol 7:631-640.
- Ratajczak M, Laroche E, Berthe T, Clermont O, Pawlak B, Denamur E and Petit F (2010) Influence of hydrological conditions on the Escherichia coli population structure in the water of a creek on a rural watershed. BMC Microbiol 10:e222.
- Rodrigues-Siek K, Giddings CW, Doetkott C, Johnson TJ, Fakhr MK and Nolan LK (2005) Comparison of Escherichia coli isolates implicated in human urinary tract infection and avian colibacillosis. Microbiology 151:2097-2110.
- Roslev P and Bukh AS (2011) State of the art molecular markers for fecal pollution source tracking in water. Appl Microbiol Biotechnol 89:1341-1355.
- Tenallion O, Skurnik D, Picard B and Denamur E (2010) The population genetics of commensal Escherichia coli Nat Rev Microbiol 8:207-217.
- US Environmental Protection Agency (2002) Method 1603 Escherichia coli (E. coli) in water by membrane filtration using modified membrane-thermotolerant Escherichia coli agar (modified m-TEC), EPA 821-R-02-023. U.S Environmental Protection Agency, Cincinatti.
- US Environmental Protection Agency (2005) Microbial source tracking guide document. Office of Research and Development, Washington, DC, EPA-600/R-05/064, 131 pp.
- Walk ST, Alm EW, Calhoun LM, Mladonicky JM and Whittam TS (2007) Genetic diversity and population structure of Escherichia coli isolated from freshwater beaches. Environ Microbiol 9:2274-2288.
- Walk ST, Alm EW, Gordon DM, Ram JL, Toranzos GA, Tiedje JM and Whittam TS (2009) Cryptic lineages of the genus Escherichia Appl Environ Microbiol 75:6534-6544.
- American Public Health Association (2010) Samples. In: Standard Methods for Examination of Water and Wastewater. Section 9060, http://standardmethods.org (accessed Feb 28, 2010).
- American Type Culture Collection (2010) Microbial media and supplements, http://www.atcc.org/CulturesandProducts/Microbiology/MicrobialMediaandSupplements/tabid/186/Default.aspx (accessed Mar 7, 2010).
- Companhia Ambiental do Estado de São Paulo (2010) Relatório de Qualidade das Águas Superficiais no Estado de São Paulo 2009. CETESB, São Paulo, http://www.cetesb.sp.gov.br/publicacoes/publicacoes.asp (accessed Jun 9, 2011).
- Companhia Ambiental do Estado de São Paulo (2011) Relatório de Qualidade das Águas Superficiais no Estado de São Paulo 2010. CETESB, São Paulo, http://www.cetesb.sp.gov.br/publicacoes/publicacoes.asp (accessed Ago 17, 2011).
- Oksanen J (2011) Multivariate analysis of ecological communities in R: Vegan tutorial. Version of Oct 30, 2011 http://cc.oulu.fi/~jarioksa/opetus/metodi/vegantutor.pdf (accessed Oct 8, 2012).
Send correspondence to:
Publication Dates
-
Publication in this collection
03 Nov 2014 -
Date of issue
Dec 2014
History
-
Received
26 Feb 2014 -
Accepted
27 June 2014