Abstract
DNA barcoding helps to identify species, especially when identification is based on parts of organisms or life stages such as seeds, pollen, wood, roots or juveniles. However, the implementation of this approach strongly depends on the existence of complete reference libraries of DNA sequences. If such a library is incomplete, DNA-based identification will be inefficient. Here, we assess if DNA barcoding can already be implemented in species-rich tropical regions. We focus on the tree flora of São Paulo state, Brazil, which contains more than 2000 tree species. Using new DNA sequence data and carefully assembled GenBank accessions, we assembled 12,113 sequences from ten different regions. The ITS, rbcL, psbA-trnH, matK and trnL regions were better represented within the available sequences for São Paulo tree flora. Currently, only 58% of the São Paulo tree flora currently have at least one barcoding sequence available. However, these species represent on average 89% of the trees in São Paulo state forests. Therefore, conservation-oriented and ecological studies can already benefit from DNA barcoding to obtain more accurate species identifications. We present which taxa remain underrepresented for the São Paulo tree flora and discuss the implications of this result for other species-rich tropical regions.
Keywords:
Biodiversity assessment; plant barcoding; species conservation; tree species
Introduction
DNA barcoding consists in telling apart organisms based on specific regions of their DNA. Initially devised as a tool to identify microorganisms, such as bacteria (Woese et al., 1990Woese CR, Kandler O and Wheelis ML (1990) Towards a natural system of organisms: Proposal for the domains Archaea, Bacteria, and Eucarya. Proc Natl Acad Sci U S A 87:4576–4579.), its use can be extended to all life forms, as long as DNA can be extracted from living, dead or fossil material. This approach developed rapidly for animals, for which one gene fragment, the mitochondrial cytochrome oxidase I (COI), was shown to be a reliable barcode in important lineages (Hebert et al., 2003Hebert PD, Ratnasingham S and De Waard JR (2003) Barcoding animal life: Cytochrome c oxidase subunit 1 divergences among closely related species. Philos Trans R Soc Lond B Biol Sci 270:S96-S99.). For land plants, however, the use of COI is inappropriate (Adams and Palmer, 2003Adams KL and Palmer JD (2003) Evolution of mitochondrial gene content: Gene loss and transfer to the nucleus. Mol Phylogenet Evol 29:380-395.) and the search for a substitute barcode has been challenging (Chase et al., 2007Chase MW, Cowan RS, Hollingsworth PM, Van Den Berg C, Madriñán S, Petersen G, Seberg O, Jørgsensen T, Cameron KM, Carine M, et al. (2007) A proposal for a standardised protocol to barcode all land plants. Taxon 56:295-299.; Hollingsworth et al., 2011Hollingsworth PM (2011) Refining the DNA barcode for land plants. Proc Natl Acad Sci U S A 108:19451-19452.; Dong et al., 2015Dong W, Xu C, Li C, Sun J, Zuo Y, Shi S, Cheng T, Guo J and Zhou S (2015) ycf1, the most promising plastid DNA barcode of land plants. Sci Rep 5:8348.). Today, the consensus view is that different genomic regions need to be jointly sequenced to properly identify a plant species (Chase et al., 2007Chase MW, Cowan RS, Hollingsworth PM, Van Den Berg C, Madriñán S, Petersen G, Seberg O, Jørgsensen T, Cameron KM, Carine M, et al. (2007) A proposal for a standardised protocol to barcode all land plants. Taxon 56:295-299.). The chloroplastic rbcL and matK markers were the first proposals of barcodes for land plants (CBOL Plant Working Group, 2009CBOL Plant Working Group (2009) A DNA barcode for land plants. Proc Natl Acad Sci U S A 106:12794-12797.), with further suggestions for the inclusion of ITS region and psbA-trnH as core barcodes (Gonzalez et al., 2009Gonzalez MA, Baraloto C, Engel J, Mori SA, Pétronelli P, Riéra B, Roger A, Thébaud C and Chave J (2009) Identification of Amazonian trees with DNA barcodes. PLoS One 4:e7483.; Hollingsworth, 2011Hollingsworth PM (2011) Refining the DNA barcode for land plants. Proc Natl Acad Sci U S A 108:19451-19452.; Li et al., 2011Li DZ, Gao LM, Li HT, Wang H, Ge XJ, Liu JQ, Chena ZD, Zhoua SL, Chena SL, Yang JB, et al. (2011) Comparative analysis of a large dataset indicates that internal transcribed spacer (ITS) should be incorporated into the core barcode for seed plants. Proc Natl Acad Sci 108:19641-19646;).
DNA barcoding is a powerful tool for a range of applications. It can be used to provide objective identification of allergenic, illegal-trade species or any species relevant to conservation, such as threatened or invasive species (Armstrong and Ball, 2005Armstrong KF and Ball SL (2005) DNA barcodes for biosecurity: invasive species identification. Philos Trans R Soc Lond B Biol Sci 360:1813-1823.; Lahaye et al., 2008Lahaye R, Van Der Bank M, Bogarin D, Warner J, Pupulin F, Gigot G, Maurin O, Duthoit S, Barraclough TG and Savolainen V (2008) DNA barcoding the floras of biodiversity hotspots. Proc Natl Acad Sci U S A 105:2923-2928.; Pryer et al., 2010Pryer KM, Schuettpelz E, Huiet L, Grusz AL, Rothfels CJ, Avent T, Schwartz D and Windham MD (2010) DNA barcoding exposes a case of mistaken identity in the fern horticultural trade. Mol Ecol Resour 10:979-985.; Krishnamurthy and Francis, 2012Krishnamurthy PK and Francis RA (2012) A critical review on the utility of DNA barcoding in biodiversity conservation. Biodivers Conserv 21:1901-1919.). It can also be helpful to identify species in ecological studies (Joly et al., 2014Joly S, Davies TJ, Archambault A, Bruneau A, Derry A, Kembel SW, Peres-Neto P, Vamosi J and Wheeler TA (2014) Ecology in the age of DNA barcoding: The resource, the promise and the challenges ahead. Mol Ecol Resour 14:221-232.), especially in species-rich tropical forests and/or when identification relies on sterile materials or on cryptic life stages, such as seedlings and seeds (Gonzalez et al., 2009Gonzalez MA, Baraloto C, Engel J, Mori SA, Pétronelli P, Riéra B, Roger A, Thébaud C and Chave J (2009) Identification of Amazonian trees with DNA barcodes. PLoS One 4:e7483.; Gomes et al., 2013Gomes A, Andrade A, Barreto-Silva JS, Brenes-Arguedas T, López DC, Freitas CC, Lang C, Oliveira AA, Pérez AJ, Perez R, et al. (2013) Local plant species delimitation in a highly diverse Amazonian forest: Do we all see the same species? J Veg Sci 24:70-79.). For instance, in the Brazilian Atlantic Forest, tree community surveys often result in 5-10% of trees as unidentified or identified at family level, even in regions where the local flora is well studied (e.g., Grombone-Guaratini et al., 1990Grombone-Guaratini MT, Bernacci LC, Meira-Neto JA, Tamashiro JY and Leitão-Filho HF (1990) Estrutura fitossociológica da floresta semidecídua de altitude do Parque Municipal da Grota Funda (Atibaia – estado de São Paulo). Acta Bot Bras 4:47-64.; Ruschel et al., 2009Ruschel AR, Mantovani M, Reis MS and Nodari RO (2009) Caracterização e dinâmica de duas fases sucessionais em floresta secundária da Mata Atlântica. Rev Árvore 33:101-115.). Where the tree flora is less known this fraction can reach up to 20% (e.g., Thomas et al., 2008Thomas WW, Carvalho AMV, Amorim AM, Hanks JG and Santos TS (2008) Diversity of woody plants in the Atlantic coastal forest of southern Bahia, Brazil. In: Thomas WW (ed) The Atlantic coastal forest of northeastern Brazil. The New York Botanical Garden Press, New York, pp 21-66.). Although it has been claimed that DNA barcodes have limited use for taxonomic studies (Rubinoff and Holland, 2005Rubinoff D and Holland BS (2005) Between two extremes: Mitochondrial DNA is neither the panacea nor the nemesis of phylogenetic and taxonomic inference. Syst Biol 54:952-961.; Seberg and Petersen, 2009Seberg O and Petersen G (2009) How many loci does it take to DNA barcode a crocus? PloS One 4:e4598.), they have been used for reconstructing phylogenetic relationships within communities (Kress et al., 2009Kress WJ, Erickson DL, Jones FA, Swenson NG, Perez R, Sanjur O and Bermingham E (2009) Plant DNA barcodes and a community phylogeny of a tropical forest dynamics plot in Panama. Proc Natl Acad Sci U S A 106:18621-18626.; Oliveira et al., 2014Oliveira AA, Vicentini A, Chave J, Castanho CDT, Davies SJ, Martini AM, Lima RAF, Ribeiro RR, Iribar A and Souza VC (2014) Habitat specialization and phylogenetic structure of tree species in a coastal Brazilian white-sand forest. J Plant Ecol 7:134-144: rtt073.), thus providing a significant contribution to the field of ecophylogenetics (Mouquet et al., 2012Mouquet N, Devictor V, Meynard CN, Munoz F, Bersier LF, Chave J, Couteron P, Dalecky A, Fontaine C, Gravel D, et al. (2012) Ecophylogenetics: Advances and perspectives. Biol Rev 87:769–785.). With the advent of high-throughput sequencing, the application of DNA barcodes to environmental samples (e.g., soil samples, feces or stomach contents) has been successfully used in biodiversity surveys (Taberlet et al., 2012Pornon A, Escaravage N, Burrus M, Holota H, Khimoun A, Mariette J, Pellizzari C, Iribar A, Etienne R, Taberlet P, et al. (2016) Using metabarcoding to reveal and quantify plant-pollinator interactions. Sci Rep 6:27282.; Yoccoz et al., 2012Yoccoz NG, Bråthen KA, Gielly L, Haile J, Edwards ME, Goslar T, Von Stedingk H, Brysting AK, Coissac E, Pompanon F, et al. (2012) DNA from soil mirrors plant taxonomic and growth form diversity. Mol Ecol 21:3647-3655.; Ji et al., 2013Ji Y, Ashton L, Pedley SM, Edwards DP, Tang Y, Nakamura A, Kitching R, Dolman PM, Woodcock P, Edwards FA, et. al. (2013) Reliable, verifiable and efficient monitoring of biodiversity via metabarcoding. Ecol Lett 16:1245-1257.; Kress et al., 2015Kress WJ, Erickson DL, Jones FA, Swenson NG, Perez R, Sanjur O and Bermingham E (2009) Plant DNA barcodes and a community phylogeny of a tropical forest dynamics plot in Panama. Proc Natl Acad Sci U S A 106:18621-18626.) and also to unravel species interaction networks (Yu et al., 2012Yu DW, Ji Y, Emerson BC, Wang X, Ye C, Yang C and Ding Z (2012) Biodiversity soup: Metabarcoding of arthropods for rapid biodiversity assessment and biomonitoring. Meth Ecol Evol 3:613-623.; García-Robledo et al., 2013García-Robledo C, Erickson DL, Staines CL, Erwin TL and Kress WJ (2013) Tropical plant–herbivore networks: Reconstructing species interactions using DNA barcodes. PLoS One 8:e52967.; Lima-Mendez et al., 2015Lima-Mendez G, Faust K, Henry N, Decelle J, Colin S, Carcillo F, Chaffron S, Ignacio-Espinosa JC, Roux S, Vincent F, et al. (2015) Determinants of community structure in the global plankton interactome. Science 348:1262073.; Pornon et al., 2016Pornon A, Escaravage N, Burrus M, Holota H, Khimoun A, Mariette J, Pellizzari C, Iribar A, Etienne R, Taberlet P, et al. (2016) Using metabarcoding to reveal and quantify plant-pollinator interactions. Sci Rep 6:27282.).
These applications, however, depend on the existence of complete reference libraries of DNA sequences to which new sequences can be compared with to perform species identification. If a reference library has a poor coverage in terms of species with sequences already available, the implementation of DNA-based identification techniques will remain inefficient. This is a basic issue of the implementation of DNA barcoding, but the limits related to the availability of comprehensive reference libraries have seldom been evaluated empirically. Reference libraries of DNA barcodes are expected to be far from complete in most of the tropics. However, we hypothesize here that in spite of the incompleteness of the reference libraries, DNA barcoding can be implemented if most of the individuals in a given region have reference sequences in the existing reference libraries. This critically depends on the relative abundances of the species under consideration and whether they have a large or restricted geographical distribution.
Here we perform such an assessment for the tree flora in one species-rich tropical region, the State of São Paulo, Brazil. This area has high plant diversity and endemism, but also has high levels of land-use change and forest fragmentation. It is the Brazilian State with the largest level of research funds, which would in theory allow for a thorough survey of its flora. Here, we combine sequences from a large sequencing effort carried out locally with sequences retrieved from GenBank to answer the following questions: (i) How many barcodes are available for the São Paulo tree flora, has this number increased through time, and which taxa still remain underrepresented? (ii) Which DNA markers are better represented among São Paulo tree species? (iii) What proportion of trees in São Paulo forests already has barcode sequences available? (iv) Do species with larger geographical distribution tend to have more information on DNA barcodes? In the light of our results, we finally propose directions to future sequencing efforts to achieve a more complete DNA reference library for São Paulo, which could be applied to other tropical areas.
Materials and Methods
Study site
São Paulo State in south-eastern Brazil (19º47’-25º19’S latitude and 44º10’-53º06’W longitude) has a total area of 248 thousand km2, representing ca. 3% of Brazil. Altitude varies from sea level to nearly 2800 m asl. Climate is mainly characterized by a marked rainy summer and dry winter (Dufek and Ambrizzi, 2008Dufek AS and Ambrizzi T (2008) Precipitation variability in São Paulo State, Brazil. Theor Appl Climatol 93:167-178.). However, Köppen’s climate classification ranges from Aw in the west of the state, Cfa and Cwa in its center, Cfb and Cwb in the mountains to Am and Af near the ocean (Alvares et al., 2013Alvares CA, Stape JL, Sentelhas PC, Moraes G, Leonardo J and Sparovek G (2013) Köppen’s climate classification map for Brazil. Meteor Z 22:711-728.). Mean annual rainfall and temperature for the 645 counties of São Paulo ranges widely from 1226 to 3150 mm and from 17.1 to 25.4 oC (http://www.ciiagro.sp.gov.br). São Paulo is one of the Brazilian states with the highest degree of knowledge in terms of its flora. It shelters 7528 seed plants, mainly within the Atlantic Forest and Cerrado domains, two important biodiversity hotspots of plant and animal endemism (Myers et al., 2000Myers N, Mittermeier RA, Mittermeier CG, Fonseca GA and Kent J (2000) Biodiversity hotspots for conservation priorities. Nature 403:853-858.; The Brazil Flora Group, 2015The Brazil Flora Group (2015) Growing knowledge: An overview of seed plant diversity in Brazil. Rodriguésia 66:1085-1113.).
Species list, abundances, distribution and conservation status
We compiled a list of all native and naturalized woody species occurring in forests of the state of São Paulo, including trees, tall shrubs and arboreal species of palms, ferns, cactus and bamboos. We did not include woody lianas, but we did include woody hemi-epiphytes species of Ficus, Coussapoa, Spirotheca and Oreopanax. Hereafter, we will refer to this checklist as the SP tree flora. This list is based largely on the Brazilian Flora Checklist project (The Brazil Flora Group, 2015The Brazil Flora Group (2015) Growing knowledge: An overview of seed plant diversity in Brazil. Rodriguésia 66:1085-1113.) which provided 91% of species records for the São Paulo tree list. The remaining records came from the NeoTropTree database (Oliveira-Filho, 2014Oliveira-Filho AT (2014) NeoTropTree, Flora arbórea da Região Neotropical: Um banco de dados envolvendo biogeografia, diversidade e conservação. Universidade Federal de Minas Gerais, http://www.neotroptree.info/.
http://www.neotroptree.info/...
), which contains an extensive list of trees and tall shrubs frequently sampled in forest surveys. We manually checked all records in the SP tree flora to ensure that the final list did not contain nomenclatural problems or records for other life forms such as lianas and small shrubs. Here, we considered as doubtful the occurrence Acanthosyris spinescens Griseb. (Santalaceae) in São Paulo, for which we found vouchers only for the state of Rio Grande do Sul in the speciesLink network (http://splink.cria.org.br).
The abundance of tree species in São Paulo forests was obtained from 135 published tree community surveys (Table S1). These surveys were compiled by Lima et al. (2015)Lima RAF, Mori DP, Pitta G, Melito MO, Bello C, Magnago LF, Zwiener VP, Saraiva DD, Marques MCM, Oliveira AA and Prado PI (2015) How much do we know about the endangered Atlantic Forest? Reviewing nearly 70 years of information on tree community surveys. Biodivers Conserv 24:2135-2148. for the Atlantic Forest, and were complemented by additional surveys for Cerrado forests (i.e., Cerradão), obtained using the same search methods. Most of surveys (53%) had total sampling effort ranging from 1 to 10.24 ha and a cut-off criterion of diameter at breast height ≥ 4.8-5.0 cm. Overall, the 135 surveys contained abundance records from around 174 ha of natural forests and 269,000 individuals. These surveys were used to calculate the proportion of individuals in each community belonging to species with DNA barcodes currently available. The distributions of these proportions across sites (and their descriptive statistics) were taken here as a measure of the extent to which DNA barcoding can be used to assist the identification of tree individuals occurring in São Paulo forests. This assessment was carried at species, genus and family levels. Records determined as affinis were considered only at genus level, but species determined as confers were attributed to the suggested species.
The geographical distribution of species was also obtained from the Brazilian Flora Checklist and NeoTropTree projects (Oliveira-Filho, 2014Oliveira-Filho AT (2014) NeoTropTree, Flora arbórea da Região Neotropical: Um banco de dados envolvendo biogeografia, diversidade e conservação. Universidade Federal de Minas Gerais, http://www.neotroptree.info/.
http://www.neotroptree.info/...
; The Brazil Flora Group, 2015The Brazil Flora Group (2015) Growing knowledge: An overview of seed plant diversity in Brazil. Rodriguésia 66:1085-1113.), which provide the occurrence of species at country level and at state level for Brazilian records. We classified species geographical distributions as follows: non-endemic, Eastern South-American endemics (Atlantic Forest, Cerrado and/or Pantanal domains), regional endemic and local endemic. Regional endemics are those species restricted to South and South-eastern Brazil, North-east Argentina and Paraguay. Local endemics are species restricted to the State of São Paulo or to São Paulo and one more neighbor state, e.g., São Paulo and Rio de Janeiro. We obtained the threat status of species at state level based on the São Paulo official red list (Mamede et al., 2007Mamede MCH, Souza VC, Prado J, Barros F, Wanderley MGL and Rando JG (2007) Livro vermelho das espécies vegetais ameaçadas de extinção no Estado de São Paulo. Instituto de Botânica, São Paulo, 165 p.). A species was considered as being under threat of extinction if its current status was vulnerable, endangered, critically endangered, extinct in the wild or extinct, following the IUCN threatened classes.
DNA sequences library
The library of DNA sequences for the SP tree flora was assembled from two sources: local sequencing efforts and sequences retrieved from GenBank. Local sequencing was carried out by collecting up to three samples of all tree and shrub species inside four 10.24-ha (320×320 m) forest plots of the ‘São Paulo Permanent Forest Plots’ project (Rodrigues, 2005Rodrigues RR (2005) Parcelas Permanentes em 40 ha de florestas do Estado de São Paulo: uma experiência multidisciplinar. Universidade de São Paulo, Piracicaba, 714 p.). Together, these plots contained > 60,000 of trees from > 600 species in the four of the major forest types of São Paulo: the savannah forest (locally known as ‘Cerradão‘), the semi-deciduous seasonal forest, white-sand forest (locally known as ‘Restinga‘ forest), and the rain forest over clayey soils. In addition to the tagged trees inside each permanent plot, we also sampled the most abundant shrubs that usually did not reach the 4.8 cm diameter at breast height (mainly Piper spp., Psychotria spp., Geonoma spp. and Leandra spp.). In a second moment, additional sampling campaigns were carried out aiming to collect samples of species from orders and families that were not present in the four 40.96-ha plots. We performed rapid surveys in 40 forest fragments in 38 counties of São Paulo, collecting fertile specimens in the forest border and interior. Species identification was validated by consulting several specialists and taxonomic revisions. Vouchers for all species sampled were deposited at ESA and RB herbaria (acronyms follow Thiers, 2015Thiers B (2015) Index herbariorum: A global directory of public herbaria and associated staff. The New York Botanical Garden, http://sweetgum.nybg.org/science/ih/.
http://sweetgum.nybg.org/science/ih/...
). Finally, for the orders and families that were eventually not found in the field campaigns, we sampled leaf fragments from herbarium specimens deposited at ESA. In total, we obtained more than 2000 leaf samples from the permanent plots, forest fragments and herbarium specimens.
We assembled DNA sequences for rbcL and matK for all families and the ITS region specifically for Myrtaceae and Melastomataceae, two species-rich families in the SP tree flora for which we had low amplification success for both plastid barcodes. Our choice of markers was related to an ongoing initiative funded by the state government to produce a complete reference library of plant DNA barcodes for the entire state of São Paulo, starting with the two core plastid barcodes. The DNA sequences were obtained using classic procedures of DNA extraction (Doyle and Doyle, 1987Doyle JJ and Doyle JL (1987) A rapid DNA isolation procedure from small quantities of fresh leaf tissue. Phytochem Bull 19:11-15.), for all leaf samples collected. For the DNA extracts that could not be easily amplified, we repeated PCRs using slightly different protocols or using purified DNA extracts. These cases generally corresponded to materials sampled at the ESA herbarium, and from latex-containing species (e.g. Euphorbiaceae, Moraceae and Clusiaceae) and those with secondary leaf compounds that may act as PCR inhibitors (Varma et al., 2007Varma A, Padh H and Shrivastava N (2007) Plant genomic DNA isolation: An art or a science. Biotechnol J 2:386.), including Myrtaceae and Lauraceae. Details on DNA extraction and primers choice are provided in Table S2. Scientific permissions to access the studied sites and to sample and transport plant tissues were provided by ‘Instituto Florestal de São Paulo’ (COTEC processed 260108 - 002.446/2011 and 002.089/2014) and the ‘Instituto Brasileiro do Meio Ambiente e dos Recursos Naturais Renováveis’ (IBAMA - License 14BR013854).
We complemented this sequencing effort by compiling all accessions from GenBank (www.ncbi.nlm.nih.gov/genbank) for the valid binomials and synonyms of the SP tree flora recognized by the Brazilian Flora Checklist project. Our search included only accessions deposited until 31 December 2015. It was conducted using the ‘organism’ search field and was restricted to vascular plants. Only accessions verified by GenBank were considered. For each verified accession retrieved, we extracted the information on the date of submission, molecule type, the origin of the specimen, and the gene to which the accession referred to. We then classified genes as barcoding and non-barcoding plant DNA regions. The majority of studies on plant DNA barcodes concentrate on rbcL, matK, the ITS region (i.e. 18S|ITS1|5.8S|ITS2|26S) and psbA-trnH (CBOL Plant Working Group, 2009CBOL Plant Working Group (2009) A DNA barcode for land plants. Proc Natl Acad Sci U S A 106:12794-12797.; Gonzalez et al., 2009Gonzalez MA, Baraloto C, Engel J, Mori SA, Pétronelli P, Riéra B, Roger A, Thébaud C and Chave J (2009) Identification of Amazonian trees with DNA barcodes. PLoS One 4:e7483.; Hollingsworth, 2011Chase MW, Cowan RS, Hollingsworth PM, Van Den Berg C, Madriñán S, Petersen G, Seberg O, Jørgsensen T, Cameron KM, Carine M, et al. (2007) A proposal for a standardised protocol to barcode all land plants. Taxon 56:295-299.; Li et al., 2011Li DZ, Gao LM, Li HT, Wang H, Ge XJ, Liu JQ, Chena ZD, Zhoua SL, Chena SL, Yang JB, et al. (2011) Comparative analysis of a large dataset indicates that internal transcribed spacer (ITS) should be incorporated into the core barcode for seed plants. Proc Natl Acad Sci 108:19641-19646;). However, for the sake of completeness, we also included other five regions suggested as potential barcodes by Hollingsworth et al. (2011)Hollingsworth PM, Graham SW and Little DP (2011) Choosing and using a plant DNA barcode. PloS One 6:e19254., namely atpF-atpH, psbK-psbI, rpoB, rpoC1 and trnL, and finally ycf1, as recently suggested by Dong et al. (2015)Dong W, Xu C, Li C, Sun J, Zuo Y, Shi S, Cheng T, Guo J and Zhou S (2015) ycf1, the most promising plastid DNA barcode of land plants. Sci Rep 5:8348..
Data analysis
We evaluated how fast DNA barcoding data have accumulated for the São Paulo tree flora. To this end, we plotted the cumulative number of sequenced species, genera and families against time. The accumulation curves were fitted using the logistic function [Accumulated sequences = a/(1 + cexp(btime)); see Fattorini et al. (2012)Fattorini S, Maurizi E and Giulio AD (2012) Tackling the taxonomic impediment: A global assessment for ant-nest beetle diversity (Coleoptera: Carabidae: Paussini). Bot J Linn Soc 105:330-339. and citations therein]. Because we know the total number of taxa for the SP tree flora, we fixed the saturation parameter a, so that we could estimate the date when the accumulation curves saturate according to the best logistic fit to data. We fitted functions using non-linear least squares regression (Pinheiro and Bates, 2000Pinheiro J and Bates D (2000) Mixed-Effects Models in S and S-PLUS. Springer, New York, 528 p.). GenBank accessions were restricted to dates until the end of 2015, so we arbitrarily set the date of 16 Jan 2016 for the sequences produced as part of this study. GenBank accessions are not published continuously throughout the year, so accessions were grouped by trimester prior to fit functions to the cumulative number of taxa.
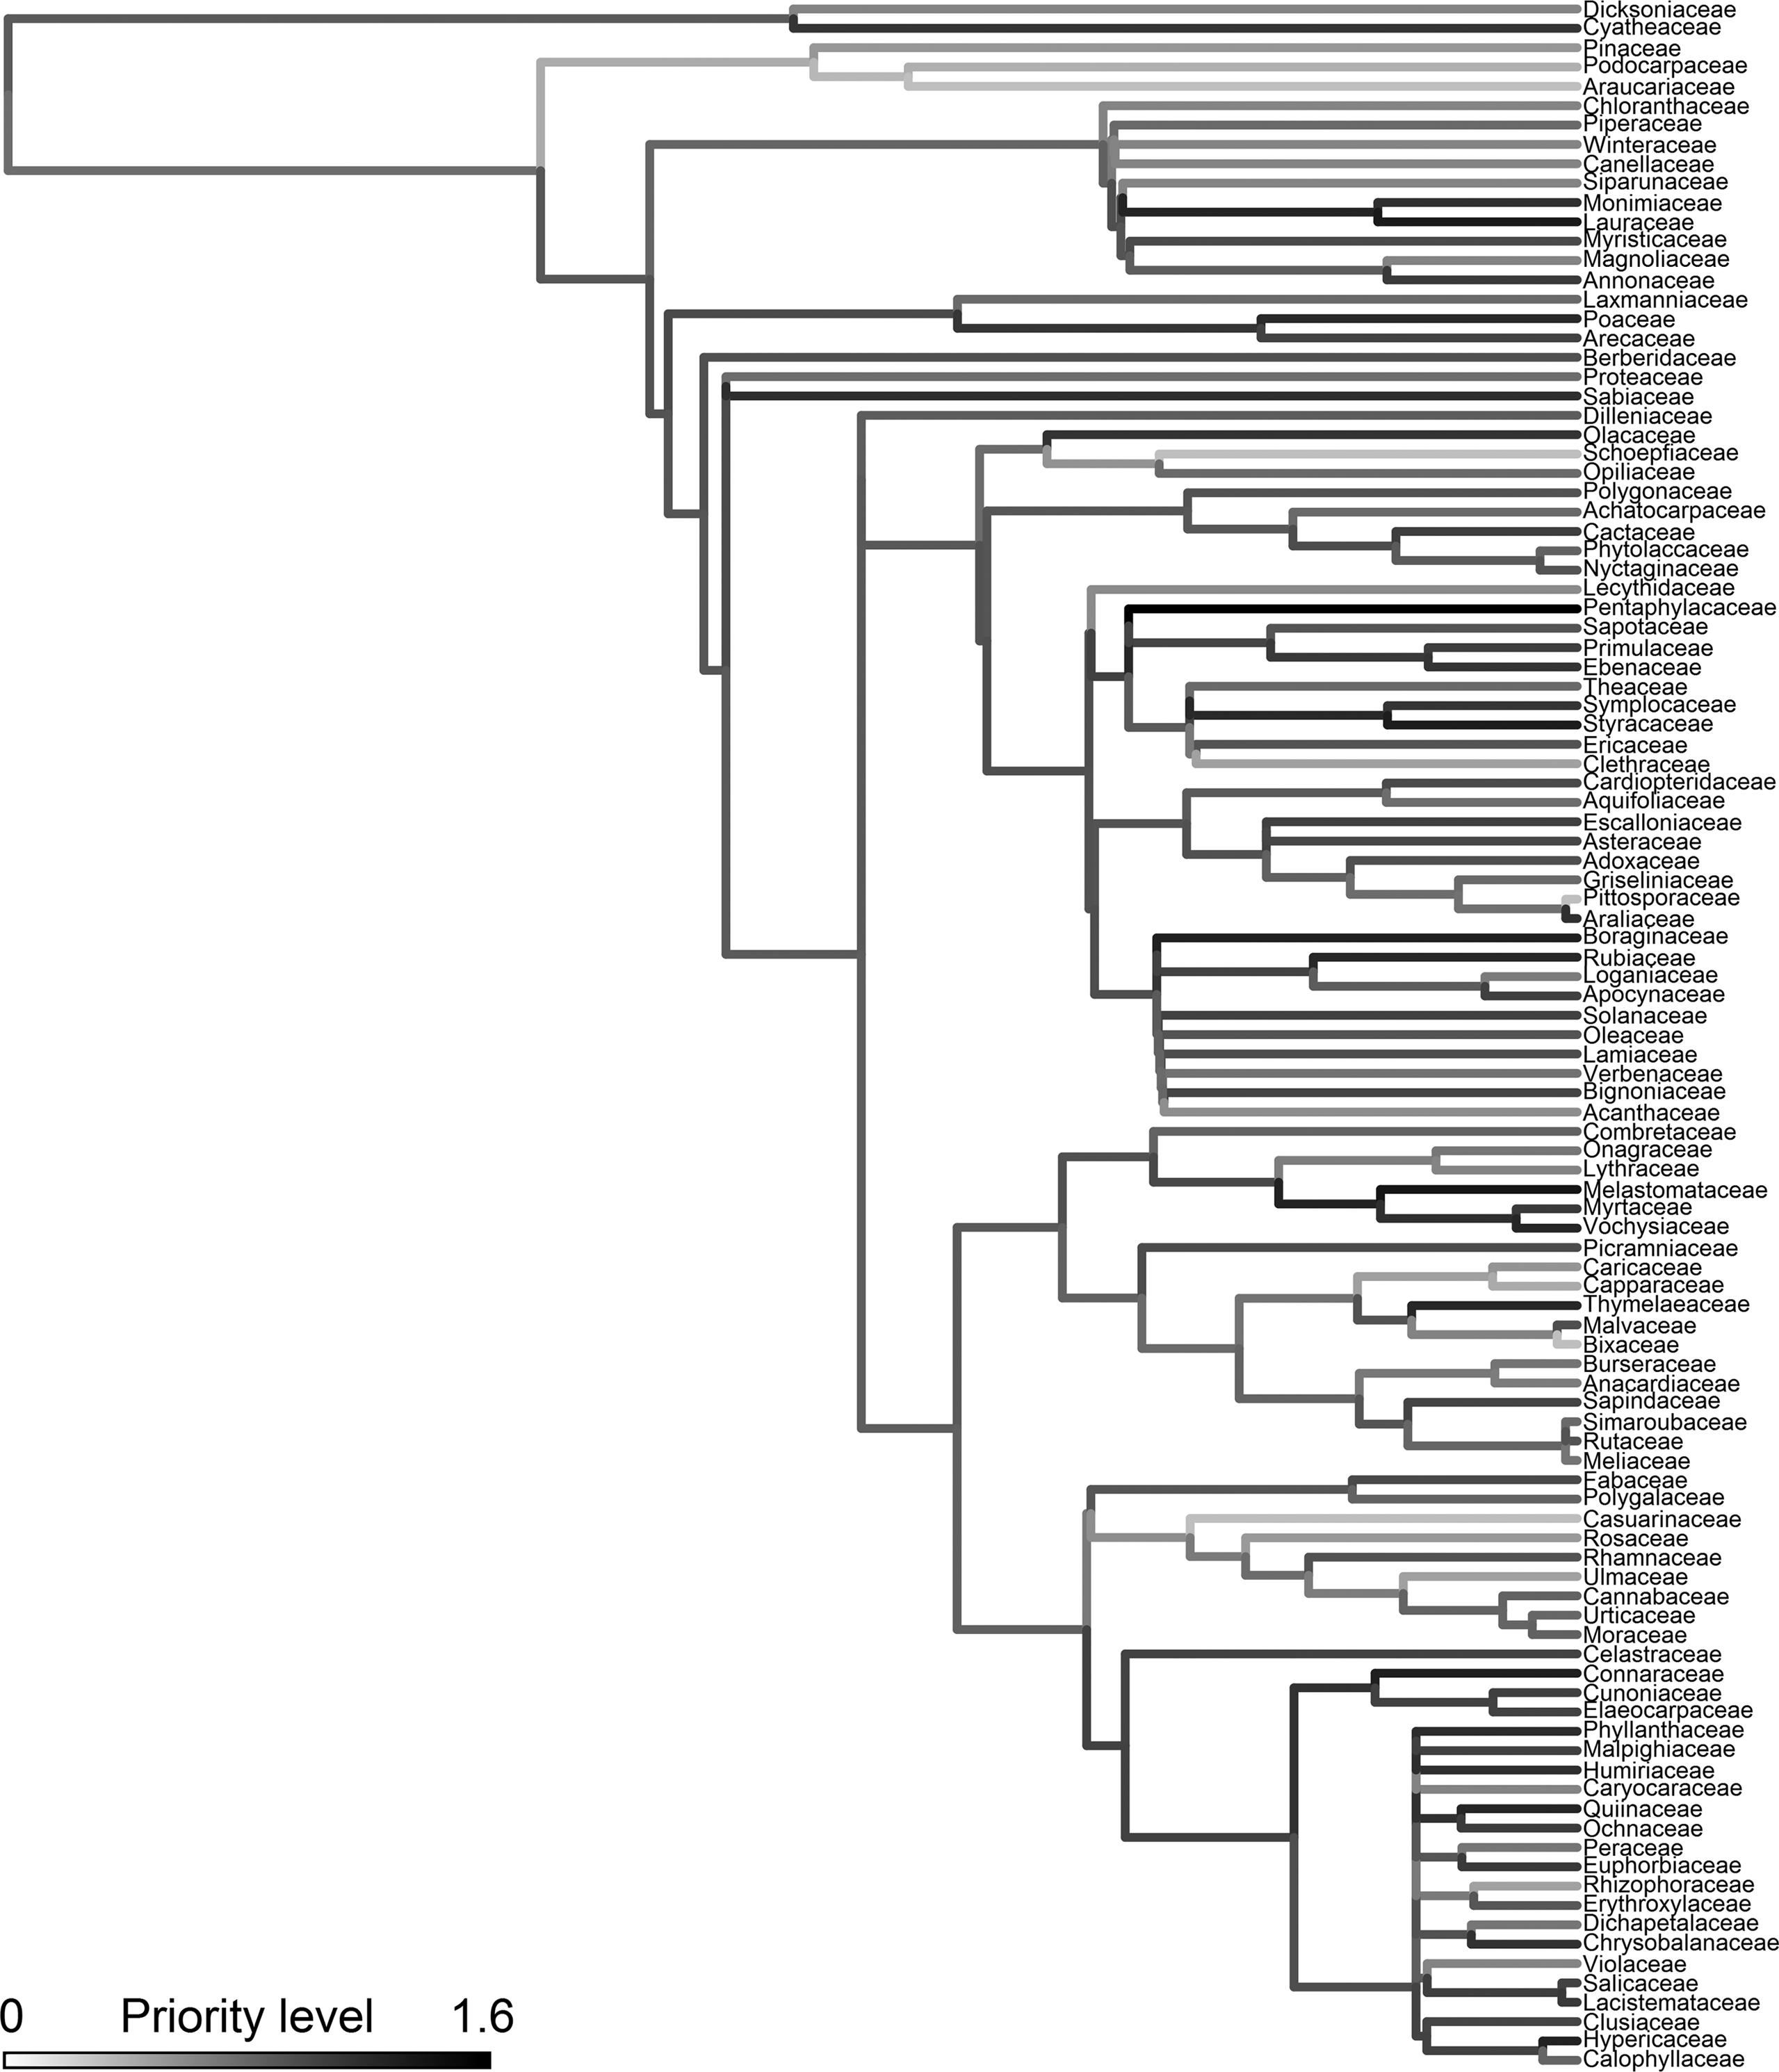
Within each family and genus, we calculated the difference between the overall proportion of species in the SP tree flora and the proportion of species with DNA barcodes. We fitted a Cauchy distribution to the values of difference between these proportions using maximum likelihood and calculated the 95% and 90% confidence intervals to determine which groups had an under or overrepresentation in the DNA barcode library of the SP tree flora. The Cauchy distribution, which is a special case of the Student’s t-distribution, is also symmetrical but has a heavier tail than the Normal distribution, being more flexible to assess the distribution of values centered on zero. We also performed a priority assessment to indicate which families should be prioritized in future barcode sequencing efforts of the SP tree flora. This assessment took into account: (i) the proportion of barcodes not available, (ii) the proportion of threatened species without barcodes, and (iii) the proportion of endemic species without barcodes (see details in Table S3). We summed these three proportions to calculate a priority index varying between 0 and 3. The higher the index, the greater the priority for future sequencing efforts. To visualize this result, the priority index was mapped upon the phylogeny for the SP tree flora. This phylogeny was obtained at family-level using the stored megatree R20120829 available from the phylomatic website (http://phylodiversity.net/phylomatic)
To assess the representativeness of each barcode in respect to the São Paulo tree flora at different taxonomic levels, we implemented the following procedure. We calculated the abundance of sequences at order, family, genus and species taxonomic levels and then computed the Pielou index (J):
where pi is the relative abundance of sequences for taxon i and S is the total number of taxa for a given taxonomic level. This index accounts not only the number of taxa for which a given barcode has sequences available, but also how concentrated these sequences are across taxa. Venn diagrams with different combinations of barcodes were used to represent the overlap among barcodes in terms of species sequenced.
To assess whether the number of barcoding sequences depended on species geographical distributions, we performed an analysis of variance using a negative binomial error distribution (i.e., negative binomial regression). The response variable was the count of barcoding sequences available per species, which varies from 0 (no barcode at all) to 10 (sequences for all barcodes), and presented a skewed distribution with much more small than large counts per species. This variable was regressed on species geographical distribution, namely non-endemic, Eastern South-American endemics, regional endemics and local endemics. The significance of this regression model was tested using a Likelihood ratio test. All analyses conducted were performed using R (R Core Team, 2017R Core Team (2017) R: A language and environment for statistical computing. R Foundation for Statistical Computing, Vienna, Austria.).
Results
The SP tree flora contains 2097 species (including 55 naturalized species) from 36 orders, 107 families and 508 genera (Table S4). It represents around 85%, 68% and 48% of the families, genera and species of native trees recorded for the Atlantic Forest and Cerrado domains together (Oliveira-Filho, 2014Oliveira-Filho AT (2014) NeoTropTree, Flora arbórea da Região Neotropical: Um banco de dados envolvendo biogeografia, diversidade e conservação. Universidade Federal de Minas Gerais, http://www.neotroptree.info/.
http://www.neotroptree.info/...
). Besides trees, tall shrubs comprised 13% of species while palms, ferns, cacti and bamboos summed 4%. We found 227 species threatened of extinction at state level (11%), including six species that are probably already extinct in São Paulo.
The DNA barcode library for the SP tree flora
The first DNA barcode accession for SP trees was an rbcL sequence submitted to GenBank in December 1993 for Trema micrantha, a widespread Neotropical pioneer. But it was only in this century that the number of accessions increased in an exponential fashion, almost doubling at every three years in the past ten years (accumulated sequences = 61.3exp(0.063time)). By the end of 2015 GenBank contained nearly 30,000 accessions for the SP tree flora, of which 39% corresponded to sequences of the ten DNA markers considered here (Table S5). Few studies made great contributions to this increase (Kress et al., 2009Kress WJ, Erickson DL, Jones FA, Swenson NG, Perez R, Sanjur O and Bermingham E (2009) Plant DNA barcodes and a community phylogeny of a tropical forest dynamics plot in Panama. Proc Natl Acad Sci U S A 106:18621-18626., 2010Kress WJ, Erickson DL, Swenson NG, Thompson J, Uriarte M and Zimmerman JK (2010) Advances in the use of DNA barcodes to build a community phylogeny for tropical trees in a Puerto Rican forest dynamics plot. PLoS One 5:e15409.; Lucas et al., 2007Lucas EJ, Harris SA, Mazine FF, Belsham SR, Lughadha EMN, Telford A, Gasson PE and Chase MW (2007) Suprageneric phylogenetics of Myrteae, the generically richest tribe in Myrtaceae (Myrtales). Taxon 56:1105-1128., 2011Lucas EJ, Matsumoto K, Harris SA, Lughadha EMN, Benardini B and Chase MW (2011) Phylogenetics, morphology, and evolution of the large genus Myrcia sl (Myrtaceae). Int J Plant Sci 172:915-934.; Bolson et al., 2015Bolson M, Smidt EC, Brotto ML and Silva-Pereira V (2015) ITS and trnH-psbA as efficient DNA barcodes to identify threatened commercial woody angiosperms from Southern Brazilian Atlantic rainforests. PLoS One 10:e0143049.; and the iBOL Data Release in early 2012), representing 99-791 sequences of 38-86 species. We added 1611 new sequences (902 rbcL, 587 matK and 122 ITS region) for 609 species (GenBank accessions: MG707972-MG708099, MG718033-MG719104, MG833417-MG833723, KF981191-KF981364), among which more than 80 are new species entries in the NCBI taxonomy database. This is by far the largest sequencing effort ever carried out for SP tree species. Today, there are currently ca. 12 thousand DNA barcodes available for the SP tree flora (Table 1).
Number of sequences and taxa by source of information for the São Paulo tree flora, in respect to the ten DNA barcodes considered in this study. In parentheses, the proportion of each taxon with sequences available for any of these ten barcodes.
The top five DNA barcodes were ITS, rbcL, psbA-trnH, matK and trnL, these being the only barcodes well represented for the São Paulo tree flora. Accessions for the other five markers (i.e., atpF-atpH, psbK-psbI, rpoB, rpoC1 and ycf1) were so scarce (< 4% of all barcode accessions) that these markers will not be discussed hereafter. We found that matK and rbcL had the highest evenness across taxonomic levels. In terms of evenness, trnL also outperformed the ITS region. None of the barcodes had sequences for more than 40% of SP tree species (Table 2) and only 8% species from the SP tree flora already have sequences for all of the top five barcodes. These proportions are higher if we consider combinations of two barcodes, such as rbcL+matK (33%), rbcL+ITS (21%), rbcL+psbA-trnH (15%) and matK+psbA-trnH (15%), but they are slightly higher for three-barcodes combinations, such as rbcL+matK+ITS (18%) or rbcL+matK+psbA-trnH (14%, Figure 1).
Number of sequences, species and the evenness index of the ten DNA markers considered in this study regarding the São Paulo tree flora. In parentheses, the proportion of species sequenced with respect to the total of tree species occurring in São Paulo.
Venn diagrams of the number of species with sequences for the combination of (a) rbcL + matK + ITS region and (b) rbcL + matK + psbA-trnH.
Genera that have proportionally fewer species with DNA barcodes than average were Ocotea, Erythroxylum, Psidium, Mollinedia, Vochysia, Solanum, Merostachys, Calyptranthes, Baccharis and Eugenia (Table S6). The only family lacking barcode information is Schoepfiaceae, represented by Schoepfia brasiliensis, for which we did not manage to amplify neither rbcL nor matK. Regarding the threat and endemism status of species without barcodes, other groups come out as priorities for future sequencing efforts: Dichapetalaceae, Escalloniaceae, Hypericaceae and Pentaphylacaceae (Figure 2, Table S3). They are all rare in SP, have high proportions of threatened and endemic species, but lack DNA barcode sequences.
The sampling priority level in future sequencing for each family of the SP tree flora, plotted against its phylogenetic hypothesis. The priority level was defined based on the representativeness of DNA barcodes within the family and the proportion of threatened and endemic species without barcodes.
Can DNA barcoding be implemented for the SP tree flora?
Although the number of accessions has increased in an exponential fashion, the accumulated number of taxa with barcodes has increased much more slowly. Currently, over half (58%) of SP tree species have DNA barcode information. If current accumulation rates remain the same, 100% of its families, genera and species will have at least one barcoding sequence available by 2026, 2033 and 2040, respectively (Figure 3). Few species were overrepresented with more than 500 sequences each (e.g., Lychnophora ericoide, Handroanthus impetiginosus and Tabebuia aurea).
Increase of the number of (a) species, (b) genera and (c) families across time with respect to the ten DNA markers considered in this study. Bold lines are the best fit of the logistic function to the accumulated number of sequences or taxa. Dashed lines are the total of taxa in the SP tree flora. Dates are aggregated in trimesters and the fit of functions to the accumulated number of taxa was carried out only from mid 1995 on.
Taking into account the abundance of the species with at least one DNA barcode currently available, they correspond on average to 88.9% of the tree individuals (median = 91.0%; 95% confidence intervals = 87.3-90.5%; range = 62-100%) across 135 surveys of São Paulo state forests. Because these sites had on average 1.5% (median = 0.6%; range = 0-11%) of their individual unidentified at species level, this proportion may be underestimated. When considered at genus and family levels, this proportion reaches 99.0% (median = 99.7%; range = 90.1-100%) and 99.5% (median = 99.9%; range = 93.1-100%), respectively.
Geographical range and DNA barcode availability
The SP tree species list contains 237 local endemics (11%) and 493 regional endemics (24%). The availability of DNA barcoding data was strongly related to species geographical distribution (Likelihood ratio test: 409.5, d.f. = 2093, p < 0.0001). Widespread species had on average more barcodes available than Eastern South-American, regional and local endemic species (in decreasing order of number of barcoding sequences per species). Regional and local endemics also presented significantly less rbcL and matK sequences (12.9%) than other species (43.5% - Likelihood ratio test: 227.19, d.f. = 2093, p < 0.0001). The same outcome was found when analysis was conducted considering only the top five DNA barcodes (Likelihood ratio test: 419.9, d.f. = 2093, p < 0.0001).
Discussion
We investigated the completeness of the DNA barcode reference library for a tropical region, the São Paulo State, Brazil, and found that the current library encompasses only 58% of the tree species. Although there are thousands of barcoding sequences already available, a complete library of DNA barcodes for the São Paulo tree flora is still far from complete. In this study, we made an important contribution in this direction by directed sequencing of more rare genera and families. However, our results suggest that at least two more decades will be necessary to achieve 100% of species with DNA barcodes available.
In species-rich forests, the identification of all individuals in a given community is often a difficult and subjective task (Gonzalez et al., 2009Gonzalez MA, Baraloto C, Engel J, Mori SA, Pétronelli P, Riéra B, Roger A, Thébaud C and Chave J (2009) Identification of Amazonian trees with DNA barcodes. PLoS One 4:e7483.; Gomes et al., 2013Gomes A, Andrade A, Barreto-Silva JS, Brenes-Arguedas T, López DC, Freitas CC, Lang C, Oliveira AA, Pérez AJ, Perez R, et al. (2013) Local plant species delimitation in a highly diverse Amazonian forest: Do we all see the same species? J Veg Sci 24:70-79.). Approaches that can help ecologists obtaining more accurate and consistent identifications would be very handy. In this study, we found that 89% of the individuals in a typical tree survey belong to species that are already available in the DNA barcoding reference library. Therefore, many conservation-oriented and ecological studies can already benefit from DNA barcoding. Because many species occurring in São Paulo are not restricted to this state, community studies conducted in forests of the Atlantic Forest and Cerrado domains will also benefit from this reference DNA library. Preliminary data from other 580 forest surveys outside São Paulo borders (http://labtrop.ib.usp.br/doku.php?id=projetos:treeco:star) suggest that 71-88% of the individuals from Atlantic and Cerrado forests in other regions of Brazil, Paraguay and Argentina already have sequences in the current DNA barcoding library. The exception is Northeast Brazil where this percentage is only 41%.
Defining which taxa should be prioritized in future sequencing efforts is not easy. Here, we defined a family-level priority scale based on the proportion of species without barcodes per family and on how many of them were threatened or endemic. This definition was first thought in the context of using DNA barcoding in assessments of conservation status in biodiversity surveys (Feest, 2006Feest A (2006) Establishing baseline indices for the quality of the biodiversity of restored habitats using a standardized sampling process. Restor Ecol 14:112-122.). However, one could argue that priority should be given to the taxa that are harder to identify by morphological characters. In São Paulo state, these taxa would certainly include several genera within the Myrtaceae, Lauraceae, Rubiaceae, Fabaceae and Melastomataceae (Caiafa and Martins, 2007Caiafa AN and Martins FR (2007) Taxonomic identification, sampling methods, and minimum size of the tree sampled: Implications and perspectives for studies in the Brazilian Atlantic Rainforest. Funct Ecosyst Comm 1:95-104.). It would be hard to find an objective criterion based on the difficulty of species identification. These families are all species-rich and include several threatened and endemic tree species, so it would be important to prioritize them in future DNA barcoding efforts. Therefore, directed sampling aimed at the families listed here as high priority (i.e., P > 1 in Table S3) would therefore provide many sequences for taxa with high conservation relevance. As shown here, trees endemic to SP were indeed the ones with fewer barcoding sequences.
Having barcodes for all species does not necessarily guarantee a precise identification at species level. Within some genera, species cannot be resolved using only core DNA barcodes (i.e. rbcL and matK), and many taxa will need the combination of two or more barcodes to guarantee accurate identifications (Chase et al., 2007Chase MW, Cowan RS, Hollingsworth PM, Van Den Berg C, Madriñán S, Petersen G, Seberg O, Jørgsensen T, Cameron KM, Carine M, et al. (2007) A proposal for a standardised protocol to barcode all land plants. Taxon 56:295-299.; Gonzalez et al., 2009Gonzalez MA, Baraloto C, Engel J, Mori SA, Pétronelli P, Riéra B, Roger A, Thébaud C and Chave J (2009) Identification of Amazonian trees with DNA barcodes. PLoS One 4:e7483.; Kress et al., 2009Kress WJ, Erickson DL, Jones FA, Swenson NG, Perez R, Sanjur O and Bermingham E (2009) Plant DNA barcodes and a community phylogeny of a tropical forest dynamics plot in Panama. Proc Natl Acad Sci U S A 106:18621-18626.). Currently, there is no published assessment of barcode efficiency for the SP tree flora. Published assessments of barcode efficiency and phylogenetic studies have suggested the ITS region and psbA-trnH as promising barcodes for Atlantic Forest species of Sapotaceae, Lauraceae, the tribe Myrteae, Senna and Casearia (Lucas et al., 2007Lucas EJ, Harris SA, Mazine FF, Belsham SR, Lughadha EMN, Telford A, Gasson PE and Chase MW (2007) Suprageneric phylogenetics of Myrteae, the generically richest tribe in Myrtaceae (Myrtales). Taxon 56:1105-1128.; Vivas et al., 2014Vivas CV, Moraes RCS, Alves-Araújo A, Alves M, Mariano-Neto E, van den Berg C, Gaiott FA (2014) DNA barcoding in Atlantic Forest plants: What is the best marker for Sapotaceae species identification? Genet Mol Biol 37:662-670.; Bolson et al., 2015Bolson M, Smidt EC, Brotto ML and Silva-Pereira V (2015) ITS and trnH-psbA as efficient DNA barcodes to identify threatened commercial woody angiosperms from Southern Brazilian Atlantic rainforests. PLoS One 10:e0143049.; Januario BB, 2014, MSc. Thesis Universidade Estadual Paulista, São Paulo). These two markers are already among the top five barcodes for the SP tree flora, along with rbcL and matK. An interesting strategy would be to have rbcL and matK sequenced for 100% of families and genera of the SP tree flora, which would require sequencing another 100 genera (see Table S5). Complementarily, the ITS and psbA-trnH regions could be amplified in selected clades that present low discrimination rates using only rbcL and matK (Lucas et al., 2007Lucas EJ, Harris SA, Mazine FF, Belsham SR, Lughadha EMN, Telford A, Gasson PE and Chase MW (2007) Suprageneric phylogenetics of Myrteae, the generically richest tribe in Myrtaceae (Myrtales). Taxon 56:1105-1128.; Vivas et al., 2014Vivas CV, Moraes RCS, Alves-Araújo A, Alves M, Mariano-Neto E, van den Berg C, Gaiott FA (2014) DNA barcoding in Atlantic Forest plants: What is the best marker for Sapotaceae species identification? Genet Mol Biol 37:662-670.; Bolson et al., 2015Bolson M, Smidt EC, Brotto ML and Silva-Pereira V (2015) ITS and trnH-psbA as efficient DNA barcodes to identify threatened commercial woody angiosperms from Southern Brazilian Atlantic rainforests. PLoS One 10:e0143049.). The trnL intron would be another important marker to increase focus on because a short region on this marker (the P6 loop) is often recommended for plant diversity surveys based on degraded DNA from environmental samples (Yoccoz et al., 2012Yoccoz NG, Bråthen KA, Gielly L, Haile J, Edwards ME, Goslar T, Von Stedingk H, Brysting AK, Coissac E, Pompanon F, et al. (2012) DNA from soil mirrors plant taxonomic and growth form diversity. Mol Ecol 21:3647-3655.).
New sequencing technologies are becoming rapidly available and these have greatly facilitated the sequencing of complete plastid genomes in plants (Taberlet et al., 2012Taberlet P, Coissac E, Pompanon F, Brochmann C and Willerslev E (2012) Towards next-generation biodiversity assessment using DNA metabarcoding. Mol Ecol 21:2045-2050.; Coissac et al., 2016Coissac E, Hollingsworth PM, Lavergne S and Taberlet P (2016) From barcodes to genomes: Extending the concept of DNA barcoding. Mol Ecol 25:1423–1428.). Full plastid genomes are now technically within reach and will represent a considerable advance in the field of DNA-based species identification (Kane et al., 2012Kane N, Sveinsson S, Dempewolf H, Yang JY, Zhang D, Engels JM and Cronk Q (2012). Ultra-barcoding in cacao (Theobroma spp.; Malvaceae) using whole chloroplast genomes and nuclear ribosomal DNA. Am J Bot 99:320-329.; Li et al., 2015Li X, Yang Y, Henry RJ, Rossetto M, Wang Y and Chen S (2015) Plant DNA barcoding: from gene to genome. Biol Rev 90:157-166.). Plastid genome libraries may take time to be completed in developing, species-rich countries, but they would certainly offer a much larger base of knowledge than the marker-based efforts, such as the one described here (Kress et al., 2015Kress WJ, García-Robledo C, Uriarte M and Erickson DL (2015) DNA barcodes for ecology, evolution, and conservation. Trends Ecol Evol 30:25-35.; Coissac et al., 2016Coissac E, Hollingsworth PM, Lavergne S and Taberlet P (2016) From barcodes to genomes: Extending the concept of DNA barcoding. Mol Ecol 25:1423–1428.). Another promising approach relies on near infrared spectroscopy (Rodríguez-Fernández et al., 2011Rodríguez-Fernández JI, Carvalho CJB, Pasquini C, Lima KMG, Moura MO and Arízaga GGC (2011) Barcoding without DNA? Species identification using near infrared spectroscopy. Zootaxa 2933:46-54.), a technique that could be more thoroughly explored for the identification of land plants, although it cannot be used to assess the phylogenetic relationship among species.
In the past five years, it seems that DNA barcoding has fallen out of interest, probably due to the exposition of its limitations (Krishnamurthy and Francis, 2012Krishnamurthy PK and Francis RA (2012) A critical review on the utility of DNA barcoding in biodiversity conservation. Biodivers Conserv 21:1901-1919.; Taylor and Harris, 2012Taylor HR and Harris WE (2012) An emergent science on the brink of irrelevance: a review of the past 8 years of DNA barcoding. Mol Ecol Resour 12:377-388.), or to the rise of new approaches that rely on next-generation sequencing (Taberlet et al., 2012Taberlet P, Coissac E, Pompanon F, Brochmann C and Willerslev E (2012) Towards next-generation biodiversity assessment using DNA metabarcoding. Mol Ecol 21:2045-2050.; Li et al., 2015Li X, Yang Y, Henry RJ, Rossetto M, Wang Y and Chen S (2015) Plant DNA barcoding: from gene to genome. Biol Rev 90:157-166.). Today, it is well known that classic DNA barcoding will not accurately discriminate 100% of species, be it within a specific taxonomic group (Seberg and Petersen, 2009Seberg O and Petersen G (2009) How many loci does it take to DNA barcode a crocus? PloS One 4:e4598.; Federici et al., 2013Federici S, Galimberti A, Bartolucci F, Bruni I, Cortis P and Labra M (2013) DNA barcoding to analyse taxonomically complex groups in plants: the case of Thymus (Lamiaceae). Bot J Linn Soc 171:687-699.), or in communities with many closely-related taxa (Pei et al., 2015Pei N, Erickson DL, Chen B, Ge X, Mi X, Swenson NG, Zhang JL, Jones FA, Huang CL, Ye W, et al. (2015) Closely-related taxa influence woody species discrimination via DNA barcoding: evidence from global forest dynamics plots. Sci Rep 5:15127.). However, DNA barcoding is still valid to identify target species (e.g., endangered species), or to provide more accurate species lists in the study and monitoring of ecological communities (Yu et al., 2012Yu DW, Ji Y, Emerson BC, Wang X, Ye C, Yang C and Ding Z (2012) Biodiversity soup: Metabarcoding of arthropods for rapid biodiversity assessment and biomonitoring. Meth Ecol Evol 3:613-623.; Joly et al., 2014Joly S, Davies TJ, Archambault A, Bruneau A, Derry A, Kembel SW, Peres-Neto P, Vamosi J and Wheeler TA (2014) Ecology in the age of DNA barcoding: The resource, the promise and the challenges ahead. Mol Ecol Resour 14:221-232.; Fahner et al., 2016Fahner NA, Shokralla S, Baird DJ and Hajibabaei M (2016) Large-scale monitoring of plants through environmental DNA metabarcoding of soil: Recovery, resolution, and annotation of four DNA markers. PLoS One 11:e0157505.), especially when species identification is based on seeds, pollen, wood, roots and juvenile individuals. So far, we are unaware of conservation initiatives or ecological studies carried out in São Paulo State that are based on DNA-barcoding. Bridging this gap will critically rely on coordinate efforts to train conservationists and ecologists to popularize DNA sequencing. Although representing a challenge in itself, we have shown here that building a useful reference library of DNA barcodes in species-rich tropical regions is possible. We hope that this study will encourage colleagues from other tropical countries to engage in this effort.
Acknowledgments
We are grateful to Guillaume Besnard for his help with the extraction protocol and design of new matK primers, and to Paulo Inácio K.L. Prado and Lucie Zinger for their valuable suggestions on the manuscript. This study was financially supported by grants 2015/00682-0 and 2011/22923-8 from Fundação de Amparo à Pesquisa do Estado de São Paulo (FAPESP), provided to RAFL and VCS, respectively. Data collection in the four 10-ha plots was funded by Agence Nationale pour la Recherche (ANR, France) grants ANR-10-LABX-0025 (CEBA) and ANR-10-LABX-0041 (TULIP) provided to JC. We also thank the ‘Parcelas Permanentes’ project (grant 1999/09635-0 FAPESP) for their support and access to the four forest plots.
References
- Adams KL and Palmer JD (2003) Evolution of mitochondrial gene content: Gene loss and transfer to the nucleus. Mol Phylogenet Evol 29:380-395.
- Alvares CA, Stape JL, Sentelhas PC, Moraes G, Leonardo J and Sparovek G (2013) Köppen’s climate classification map for Brazil. Meteor Z 22:711-728.
- Armstrong KF and Ball SL (2005) DNA barcodes for biosecurity: invasive species identification. Philos Trans R Soc Lond B Biol Sci 360:1813-1823.
- Bolson M, Smidt EC, Brotto ML and Silva-Pereira V (2015) ITS and trnH-psbA as efficient DNA barcodes to identify threatened commercial woody angiosperms from Southern Brazilian Atlantic rainforests. PLoS One 10:e0143049.
- Caiafa AN and Martins FR (2007) Taxonomic identification, sampling methods, and minimum size of the tree sampled: Implications and perspectives for studies in the Brazilian Atlantic Rainforest. Funct Ecosyst Comm 1:95-104.
- CBOL Plant Working Group (2009) A DNA barcode for land plants. Proc Natl Acad Sci U S A 106:12794-12797.
- Chase MW, Cowan RS, Hollingsworth PM, Van Den Berg C, Madriñán S, Petersen G, Seberg O, Jørgsensen T, Cameron KM, Carine M, et al. (2007) A proposal for a standardised protocol to barcode all land plants. Taxon 56:295-299.
- Coissac E, Hollingsworth PM, Lavergne S and Taberlet P (2016) From barcodes to genomes: Extending the concept of DNA barcoding. Mol Ecol 25:1423–1428.
- Dong W, Xu C, Li C, Sun J, Zuo Y, Shi S, Cheng T, Guo J and Zhou S (2015) ycf1, the most promising plastid DNA barcode of land plants. Sci Rep 5:8348.
- Doyle JJ and Doyle JL (1987) A rapid DNA isolation procedure from small quantities of fresh leaf tissue. Phytochem Bull 19:11-15.
- Dufek AS and Ambrizzi T (2008) Precipitation variability in São Paulo State, Brazil. Theor Appl Climatol 93:167-178.
- Fahner NA, Shokralla S, Baird DJ and Hajibabaei M (2016) Large-scale monitoring of plants through environmental DNA metabarcoding of soil: Recovery, resolution, and annotation of four DNA markers. PLoS One 11:e0157505.
- Fattorini S, Maurizi E and Giulio AD (2012) Tackling the taxonomic impediment: A global assessment for ant-nest beetle diversity (Coleoptera: Carabidae: Paussini). Bot J Linn Soc 105:330-339.
- Federici S, Galimberti A, Bartolucci F, Bruni I, Cortis P and Labra M (2013) DNA barcoding to analyse taxonomically complex groups in plants: the case of Thymus (Lamiaceae). Bot J Linn Soc 171:687-699.
- Feest A (2006) Establishing baseline indices for the quality of the biodiversity of restored habitats using a standardized sampling process. Restor Ecol 14:112-122.
- García-Robledo C, Erickson DL, Staines CL, Erwin TL and Kress WJ (2013) Tropical plant–herbivore networks: Reconstructing species interactions using DNA barcodes. PLoS One 8:e52967.
- Gomes A, Andrade A, Barreto-Silva JS, Brenes-Arguedas T, López DC, Freitas CC, Lang C, Oliveira AA, Pérez AJ, Perez R, et al. (2013) Local plant species delimitation in a highly diverse Amazonian forest: Do we all see the same species? J Veg Sci 24:70-79.
- Gonzalez MA, Baraloto C, Engel J, Mori SA, Pétronelli P, Riéra B, Roger A, Thébaud C and Chave J (2009) Identification of Amazonian trees with DNA barcodes. PLoS One 4:e7483.
- Grombone-Guaratini MT, Bernacci LC, Meira-Neto JA, Tamashiro JY and Leitão-Filho HF (1990) Estrutura fitossociológica da floresta semidecídua de altitude do Parque Municipal da Grota Funda (Atibaia – estado de São Paulo). Acta Bot Bras 4:47-64.
- Hebert PD, Ratnasingham S and De Waard JR (2003) Barcoding animal life: Cytochrome c oxidase subunit 1 divergences among closely related species. Philos Trans R Soc Lond B Biol Sci 270:S96-S99.
- Hollingsworth PM (2011) Refining the DNA barcode for land plants. Proc Natl Acad Sci U S A 108:19451-19452.
- Hollingsworth PM, Graham SW and Little DP (2011) Choosing and using a plant DNA barcode. PloS One 6:e19254.
- Ji Y, Ashton L, Pedley SM, Edwards DP, Tang Y, Nakamura A, Kitching R, Dolman PM, Woodcock P, Edwards FA, et. al (2013) Reliable, verifiable and efficient monitoring of biodiversity via metabarcoding. Ecol Lett 16:1245-1257.
- Joly S, Davies TJ, Archambault A, Bruneau A, Derry A, Kembel SW, Peres-Neto P, Vamosi J and Wheeler TA (2014) Ecology in the age of DNA barcoding: The resource, the promise and the challenges ahead. Mol Ecol Resour 14:221-232.
- Kane N, Sveinsson S, Dempewolf H, Yang JY, Zhang D, Engels JM and Cronk Q (2012). Ultra-barcoding in cacao (Theobroma spp.; Malvaceae) using whole chloroplast genomes and nuclear ribosomal DNA. Am J Bot 99:320-329.
- Kress WJ, Erickson DL, Jones FA, Swenson NG, Perez R, Sanjur O and Bermingham E (2009) Plant DNA barcodes and a community phylogeny of a tropical forest dynamics plot in Panama. Proc Natl Acad Sci U S A 106:18621-18626.
- Kress WJ, Erickson DL, Swenson NG, Thompson J, Uriarte M and Zimmerman JK (2010) Advances in the use of DNA barcodes to build a community phylogeny for tropical trees in a Puerto Rican forest dynamics plot. PLoS One 5:e15409.
- Kress WJ, García-Robledo C, Uriarte M and Erickson DL (2015) DNA barcodes for ecology, evolution, and conservation. Trends Ecol Evol 30:25-35.
- Krishnamurthy PK and Francis RA (2012) A critical review on the utility of DNA barcoding in biodiversity conservation. Biodivers Conserv 21:1901-1919.
- Lahaye R, Van Der Bank M, Bogarin D, Warner J, Pupulin F, Gigot G, Maurin O, Duthoit S, Barraclough TG and Savolainen V (2008) DNA barcoding the floras of biodiversity hotspots. Proc Natl Acad Sci U S A 105:2923-2928.
- Li DZ, Gao LM, Li HT, Wang H, Ge XJ, Liu JQ, Chena ZD, Zhoua SL, Chena SL, Yang JB, et al. (2011) Comparative analysis of a large dataset indicates that internal transcribed spacer (ITS) should be incorporated into the core barcode for seed plants. Proc Natl Acad Sci 108:19641-19646;
- Li X, Yang Y, Henry RJ, Rossetto M, Wang Y and Chen S (2015) Plant DNA barcoding: from gene to genome. Biol Rev 90:157-166.
- Lima RAF, Mori DP, Pitta G, Melito MO, Bello C, Magnago LF, Zwiener VP, Saraiva DD, Marques MCM, Oliveira AA and Prado PI (2015) How much do we know about the endangered Atlantic Forest? Reviewing nearly 70 years of information on tree community surveys. Biodivers Conserv 24:2135-2148.
- Lima-Mendez G, Faust K, Henry N, Decelle J, Colin S, Carcillo F, Chaffron S, Ignacio-Espinosa JC, Roux S, Vincent F, et al. (2015) Determinants of community structure in the global plankton interactome. Science 348:1262073.
- Lucas EJ, Harris SA, Mazine FF, Belsham SR, Lughadha EMN, Telford A, Gasson PE and Chase MW (2007) Suprageneric phylogenetics of Myrteae, the generically richest tribe in Myrtaceae (Myrtales). Taxon 56:1105-1128.
- Lucas EJ, Matsumoto K, Harris SA, Lughadha EMN, Benardini B and Chase MW (2011) Phylogenetics, morphology, and evolution of the large genus Myrcia sl (Myrtaceae). Int J Plant Sci 172:915-934.
- Mamede MCH, Souza VC, Prado J, Barros F, Wanderley MGL and Rando JG (2007) Livro vermelho das espécies vegetais ameaçadas de extinção no Estado de São Paulo. Instituto de Botânica, São Paulo, 165 p.
- Mouquet N, Devictor V, Meynard CN, Munoz F, Bersier LF, Chave J, Couteron P, Dalecky A, Fontaine C, Gravel D, et al. (2012) Ecophylogenetics: Advances and perspectives. Biol Rev 87:769–785.
- Myers N, Mittermeier RA, Mittermeier CG, Fonseca GA and Kent J (2000) Biodiversity hotspots for conservation priorities. Nature 403:853-858.
- Oliveira AA, Vicentini A, Chave J, Castanho CDT, Davies SJ, Martini AM, Lima RAF, Ribeiro RR, Iribar A and Souza VC (2014) Habitat specialization and phylogenetic structure of tree species in a coastal Brazilian white-sand forest. J Plant Ecol 7:134-144: rtt073.
- Pei N, Erickson DL, Chen B, Ge X, Mi X, Swenson NG, Zhang JL, Jones FA, Huang CL, Ye W, et al. (2015) Closely-related taxa influence woody species discrimination via DNA barcoding: evidence from global forest dynamics plots. Sci Rep 5:15127.
- Pinheiro J and Bates D (2000) Mixed-Effects Models in S and S-PLUS. Springer, New York, 528 p.
- Pornon A, Escaravage N, Burrus M, Holota H, Khimoun A, Mariette J, Pellizzari C, Iribar A, Etienne R, Taberlet P, et al. (2016) Using metabarcoding to reveal and quantify plant-pollinator interactions. Sci Rep 6:27282.
- Pryer KM, Schuettpelz E, Huiet L, Grusz AL, Rothfels CJ, Avent T, Schwartz D and Windham MD (2010) DNA barcoding exposes a case of mistaken identity in the fern horticultural trade. Mol Ecol Resour 10:979-985.
- R Core Team (2017) R: A language and environment for statistical computing. R Foundation for Statistical Computing, Vienna, Austria.
- Rodrigues RR (2005) Parcelas Permanentes em 40 ha de florestas do Estado de São Paulo: uma experiência multidisciplinar. Universidade de São Paulo, Piracicaba, 714 p.
- Rodríguez-Fernández JI, Carvalho CJB, Pasquini C, Lima KMG, Moura MO and Arízaga GGC (2011) Barcoding without DNA? Species identification using near infrared spectroscopy. Zootaxa 2933:46-54.
- Rubinoff D and Holland BS (2005) Between two extremes: Mitochondrial DNA is neither the panacea nor the nemesis of phylogenetic and taxonomic inference. Syst Biol 54:952-961.
- Ruschel AR, Mantovani M, Reis MS and Nodari RO (2009) Caracterização e dinâmica de duas fases sucessionais em floresta secundária da Mata Atlântica. Rev Árvore 33:101-115.
- Seberg O and Petersen G (2009) How many loci does it take to DNA barcode a crocus? PloS One 4:e4598.
- Taberlet P, Coissac E, Pompanon F, Brochmann C and Willerslev E (2012) Towards next-generation biodiversity assessment using DNA metabarcoding. Mol Ecol 21:2045-2050.
- Taylor HR and Harris WE (2012) An emergent science on the brink of irrelevance: a review of the past 8 years of DNA barcoding. Mol Ecol Resour 12:377-388.
- The Brazil Flora Group (2015) Growing knowledge: An overview of seed plant diversity in Brazil. Rodriguésia 66:1085-1113.
- Thomas WW, Carvalho AMV, Amorim AM, Hanks JG and Santos TS (2008) Diversity of woody plants in the Atlantic coastal forest of southern Bahia, Brazil. In: Thomas WW (ed) The Atlantic coastal forest of northeastern Brazil. The New York Botanical Garden Press, New York, pp 21-66.
- Varma A, Padh H and Shrivastava N (2007) Plant genomic DNA isolation: An art or a science. Biotechnol J 2:386.
- Vivas CV, Moraes RCS, Alves-Araújo A, Alves M, Mariano-Neto E, van den Berg C, Gaiott FA (2014) DNA barcoding in Atlantic Forest plants: What is the best marker for Sapotaceae species identification? Genet Mol Biol 37:662-670.
- Woese CR, Kandler O and Wheelis ML (1990) Towards a natural system of organisms: Proposal for the domains Archaea, Bacteria, and Eucarya. Proc Natl Acad Sci U S A 87:4576–4579.
- Yoccoz NG, Bråthen KA, Gielly L, Haile J, Edwards ME, Goslar T, Von Stedingk H, Brysting AK, Coissac E, Pompanon F, et al. (2012) DNA from soil mirrors plant taxonomic and growth form diversity. Mol Ecol 21:3647-3655.
- Yu DW, Ji Y, Emerson BC, Wang X, Ye C, Yang C and Ding Z (2012) Biodiversity soup: Metabarcoding of arthropods for rapid biodiversity assessment and biomonitoring. Meth Ecol Evol 3:613-623.
Internet Resources
- Oliveira-Filho AT (2014) NeoTropTree, Flora arbórea da Região Neotropical: Um banco de dados envolvendo biogeografia, diversidade e conservação. Universidade Federal de Minas Gerais, http://www.neotroptree.info/
» http://www.neotroptree.info/ - Thiers B (2015) Index herbariorum: A global directory of public herbaria and associated staff. The New York Botanical Garden, http://sweetgum.nybg.org/science/ih/
» http://sweetgum.nybg.org/science/ih/
Supplementary Material
The following online material is available for this article:
Table S1 - Tree community surveys used to obtain species abundances for the São Paulo tree flora.
Table S2 - Primers and PCR protocols used to obtain the DNA sequences.
Table S5 - List of GenBank accessions found for the São Paulo tree flora.
-
Associate Editor: Dario Grattapaglia
Publication Dates
-
Publication in this collection
July/Sept. 2018
History
-
Received
06 Sept 2017 -
Accepted
01 Jan 2018