Abstract
Citrus plants have been extremely affected by Huanglongbing (HLB) worldwide, causing economic losses. HLB disease causes disorders in citrus plants, leading to callose deposition in the phloem vessel sieve plates. Callose is synthesized by callose synthases, which are encoded by 12 genes (calS1– calS12)in Arabidopsis thaliana. We evaluated the expression of eight callose synthase genes from Citrus in hybrids between Citrus sunki and Poncirus trifoliata infected with HLB. The objective of this work was to identify possible tolerance loci combining the expression quantitative trait loci (eQTL) of different callose synthases and genetic Single-Nucleotide Polymorphism (SNP) maps of C. sunki and P. trifoliata. The expression data from all CscalS ranged widely among the hybrids. Furthermore, the data allowed the detection of 18 eQTL in the C. sunki map and 34 eQTL in the P. trifoliata map. In both maps, some eQTL for different CscalS were overlapped; thus, a single region could be associated with the regulation of more than one CscalS. The regions identified in this work can be interesting targets for future studies of Citrus breeding programs to manipulate callose synthesis during HLB infection.
Keywords
Gene expression; molecular markers; polymorphism
Introduction
The citrus industry plays an important role in the productivity chain in Brazilian agribusiness. Brazil is the largest sweet orange producer, and, during the period 2017/18, its yield was approximately 397 million of boxes of 40.8 kg each (Fundecitrus, 2018Fundecitrus, https://www.fundecitrus.com.br/ (accessed 30 April 2018).
https://www.fundecitrus.com.br/...
). Nevertheless, this important economic area has been challenged by Huanglongbing (HLB) (Colleta-Filho et al., 2004Colleta-Filho HD, Tagon MLPN, Takita MA, De Negri JD, Pompeu Júnior J, Carvalho AS and Machado MA (2004) First report of the causal agent of Huanglongbing (“Candidatus Liberibacter asiaticus”) in Brazil. Plant Dis 88:1382.), which has caused great economic losses because of the fast dissemination and severity. In 2008, 0.61% of the crop trees were symptomatic; in 2016, this number increased to 16.92%. In four years of evaluation, 50% of the scion trees showed disease symptoms, with an approximately 60% decrease in production (Fundecitrus, 2018Fundecitrus, https://www.fundecitrus.com.br/ (accessed 30 April 2018).
https://www.fundecitrus.com.br/...
).
HLB is caused by the gram-negative bacterium Candidatus Liberibacter asiaticus (CLas) (Colleta-Filho et al., 2004Colleta-Filho HD, Tagon MLPN, Takita MA, De Negri JD, Pompeu Júnior J, Carvalho AS and Machado MA (2004) First report of the causal agent of Huanglongbing (“Candidatus Liberibacter asiaticus”) in Brazil. Plant Dis 88:1382.), which is restricted to the phloem sieve tubes (Jagoueix et al., 1994Jagoueix S, Bove JM and Garnier M (1994) The phloem-limited bacterium of greening disease of the proteobacteria is a member of the alpha subdivision of the Proteobacteria. Int J Syst Bacteriol 44:379-386.), and is transmitted by the vector citrus psyllid (Diaphorina citri) (Gottwald, 2010Gottwald T (2010) Current epidemiological understanding of Citrus huanglongbing. Annu Rev Phytopathol 48:119-139.). Citrus plants recognize pathogen-associated molecular patterns (PAMPs) of CLas, triggering callose deposition in the phloem sieve plates (Gómez-Gómez et al., 1999Gómez-Gómez L, Felix G and Boller T (1999) A single locus determines sensitivity to bacterial flagellin in Arabidopsis thaliana. Plant J 19:277-284.; Luna et al., 2011Luna E, Pastor V, Robert J, Flors V, Mauch-Mani B and Ton J (2011) Callose deposition: a multifaceted plant defense response. Mol Plant Microbe Interact 24:183-193.). The deposition of high amounts of callose and phloem proteins (PP2) on the phloem sieve plates interferes with the transport of photoassimilates of source leaves to the sink organs (Koh et al., 2012Koh EJ, Zhou L, Williams DS, Park J, Ding N, Duan YP and Kang BH (2012) Callose deposition in the phloem plasmodesmata and inhibition of phloem transport in citrus leaves infected with “Candidatus Liberibacter asiaticus”. Protoplasma 249:687-697.; Boava et al., 2017Boava LP, Cristofani-Yaly M and Machado MA (2017) Physiologic anatomic and gene expression changes in Citrus sunki. Poncirus trifoliata and their hybrids after Liberibacter asiaticus infection. Phytopathology 107:590-599.; Wang et al., 2017Wang N, Pierson EA, Setubal JC, Xu J, Levy JG, Zhang Y, Li J, Rangel LT and Martins Jr. J (2017) The Candidatus liberibacter-host interface: insights into pathogenesis mechanisms and disease control. Annu Rev Phytopathol 55:451-482.), resulting in excessive starch accumulation in leaf chloroplasts (Wang and Trivedi, 2013Wang N and Trivedi P (2013) Citrus Huanglongbing: a newly relevant disease presents unprecedented challenges. Phytopathology 103:652-65.; Boava et al., 2017Boava LP, Cristofani-Yaly M and Machado MA (2017) Physiologic anatomic and gene expression changes in Citrus sunki. Poncirus trifoliata and their hybrids after Liberibacter asiaticus infection. Phytopathology 107:590-599.). Starch accumulation causes the disintegration of the chloroplast thylakoid system, producing the yellowing leaf mottle symptom (Schneider, 1968Schneider H (1968) Anatomy of greening-disease sweet orange shoots. Phytopathology 58:1155-1160.; Etxeberria et al., 2009Etxeberria E, Gonzalez P, Achor D and Albrigo G (2009) Anatomical distribution of abnormally high levels of starch in HLB-affected Valencia orange trees. Physiol Mol Plant Pathol 74:76-83.). Consequently, other typical HLB symptoms occur, such as yellow shoots, hardened and small leaves, leaves showing zinc deficiency and corky veins, twig dieback, stunted growth, and tree decline (Bové, 2006Bové JM (2006) Huanglongbing: a destructive newly-emerging century-old disease of citrus. J Plant Physiol Pathol 88:7-37.; Wang and Trivedi, 2013Wang N and Trivedi P (2013) Citrus Huanglongbing: a newly relevant disease presents unprecedented challenges. Phytopathology 103:652-65.).
Thus far, no source of resistance to HLB is known. However, the relative Citrus species Poncirus trifoliata does not present typical HLB symptoms, and multiplication of CLas remains low or nonexistent (Folimonova et al., 2009Folimonova SY, Robertson CJ, Garnsey SM, Gowda S and Dawson WO (2009) Examination of responses of different genotypes of citrus to Huanglongbing (citrus greening) under different conditions. Phytopathology 99:1346-1354.; Albrecht et al., 2012Albrecht U and Bowman KD (2012) Transcriptional response of susceptible and tolerant citrus to infection with Candidatus Liberibacter asiaticus. Plant Sci 185–186:118–130.; Boava et al., 2015Boava LP, Sagawa CH, Cristofani-Yaly M and Machado MA (2015) Incidence of “Candidatus Liberibacter asiaticus”-infected plants among citrandarins as rootstock and scion under field conditions. Phytopathology 105:518-524., 2017Boava LP, Cristofani-Yaly M and Machado MA (2017) Physiologic anatomic and gene expression changes in Citrus sunki. Poncirus trifoliata and their hybrids after Liberibacter asiaticus infection. Phytopathology 107:590-599.). Additionally, it is an important rootstock for citriculture because of its tolerance/resistance to Phytophthora, citrus tristeza virus and nematodes (Pang et al., 2007Pang XM, Hu CG and Deng XX (2007) Phylogenetic relationships within Citrus and its related genera as inferred from AFLP markers. Genet Resour Crop Evol 54:429-436.). Due to these characteristics, P. trifoliata and its hybrids have been highlighted as a possible source of tolerance/resistance to HLB. The hybrid population between P. trifoliata and Citrus sunki showed variability in response to CLas infection. Some hybrids were considered susceptible (CLas-positive and significant difference in starch levels), tolerant (CLaspositive, but no significant difference in starch levels) and resistant (CLas-negative and no difference in starch levels) (Boava et al., 2017Boava LP, Cristofani-Yaly M and Machado MA (2017) Physiologic anatomic and gene expression changes in Citrus sunki. Poncirus trifoliata and their hybrids after Liberibacter asiaticus infection. Phytopathology 107:590-599.).
We mapped the genomic regions associated with the expression analyses (eQTL) of Citrus callose synthase genes (CscalS) in the linkage groups of C. sunki and P. trifoliata genetic maps. Callose synthase genes encode the enzymes callose synthases (CalS), which are key elements for callose synthesis in different plant locations (Verma and Hong, 2001Verma DPS and Hong Z (2001) Plant callose synthase complexes. Plant Mol Biol 47:693-701.). In Arabidopsis thaliana (At), 12 calS genes were identified and designated as calS1–calS12 (Chen and Kim, 2009Chen XY and Kim JY (2009) Callose synthesis in higher plants. Plant Signal Behav 4:489-492.). In the Citrus genome, nine putative callose synthase (calS) genes could be found based on their amino-acid and DNA sequence similarities to AtcalS and they were named CscalS2, CscalS3, CscalS5, CscalS7, CscalS8, CscalS9, CscalS10, CscalS11 and CscalS12 (Granato et al., 2019Granato LM, Galdeano DM, Alessandre NR, Breton MC and Machado MA (2019) Callose synthase family genes plays an important role in the Citrus defense response to Candidatus Liberibacter asiaticus. Eur J Plant Pathol 155:25-38.).
Each CalS has a tissue-specific function (Ellinger and Voigt, 2014Ellinger D and Voigt CA (2014) Callose biosynthesis in Arabidopsis with a focus on pathogen response: what we have learned within the last decade. Ann Bot 114:1349-1358.), and most are required for callose biosynthesis during pollen development (Jacobs et al., 2003Jacobs AK, Lipka V, Burton RA, Panstruga R, Strizhov N, Schulze-Lefert P and Fincher GB (2003) An Arabidopsis callose synthase GSL5 is required for wound and papillary callose formation. Plant Cell 15:2503-2513.; Enns et al., 2005Enns LC, Kanaoka MM, Torii KU, Comai L, Okada K and Cleland RE (2005) Two callose synthases GSL1 and GSL5 play an essential and redundant role in plant and pollen development and in fertility. Plant Mol Biol 58:333-349.; Töller et al., 2008Töller A, Brownfield L, Neu C, Twell D and Schulze-Lefert P (2008) Dual function of Arabidopsis glucan synthase-like genes GSL8 and GSL10 in male gametophyte development and plant growth. Plant J 54:911-923.). However, some callose synthases play important roles in response to pathogen infection (Dong et al., 2008Dong X, Hong Z, Chatterjee J, Kim S and Verma DP (2008) Expression of callose synthase genes and its connection with Npr1 signaling pathway during pathogen infection. Planta 229:87-98.; Luna et al., 2011Luna E, Pastor V, Robert J, Flors V, Mauch-Mani B and Ton J (2011) Callose deposition: a multifaceted plant defense response. Mol Plant Microbe Interact 24:183-193.). Particularly, CalS7 has been demonstrated to be responsible for the synthesis of callose in sieve plates in Arabidopsis (Barratt et al., 2011Barratt DH, Kolling K, Graf A, Pike M, Calder G, Findlay K, Zeeman SC and Smith AM (2011) Callose synthase GSL7 is necessary for normal phloem transport and inflorescence growth in Arabidopsis. Plant Physiol 155:328-341.; Wang et al., 2011Wang X, Zhu M, Zhang Z and Hong Z (2011) CalS7 encodes a callose synthase responsible for callose deposition in the phloem. Plant J 65:1-14.).
Expression quantitative trait loci (eQTL) studies involve a direct association between genomic locations with gene expression levels (Nica and Emmanouil, 2013Nica AC and Emmanouil TD (2013) Expression quantitative trait loci: present and future. Philos Trans R Soc Lond B Biol Sci 368:20120362.). eQTL evaluations using the C. sunki and P. trifoliata hybrids can be very important to understand the mechanisms involved in the development of HLB symptoms. Some regions associated with CscalS expression and, consequently, with callose deposition identified in this study can be considered potential targets for future citrus breeding programs aiming to obtain tolerance to HLB.
Materials and Methods
Plant material
The mapping population comprised 272 F1 hybrids resulting from crosses between C. sunki ex Tan (female parent) and P. trifoliata Raf. cv. Rubidoux (male parent). All the plants were propagated using buds grafted onto six-month-old Rangpur lime (C. limonia Osbeck). After six months, the plant scions were grafted on the opposite side of the primary stem, with two CLas-infected budwoods obtained from C. sinensis (L.) Osbeck cv. Pera plants, the identification of which was confirmed by qPCR. Infected budwoods were left on the plants, but shoots from these budwoods were eliminated upon sprouting. All the plants were kept in a greenhouse at Centro de Citricultura Sylvio Moreira of the Instituto Agronomico (IAC), Cordeiropolis/SP at an average temperature of 25 °C. The experiment comprised three biological replicates for each inoculated (CLas-infected budwood) and mock-inoculated (healthy budwood) genotypes.
For the gene expression assay and eQTL mapping, the leaves were collected from parental plants (C. sunki and P. trifoliata) and 72 hybrids from the F1 population, randomly selected, at 24 months after CLas inoculation.
DNA extraction and molecular marker analysis
The leaves of 272 hybrids and the parental plants were collected at a similar age from four sides of the plants for DNA extraction. Five leaves were combined, and 200mg subsamples were lysed by grinding with two beads (3-mm diameter) in 2-mL microtubes at 30 Hz for 120 s in a TissueLyser II (Qiagen). DNA extraction was performed using the CTAB method (Murray and Thompson, 1980Murray MG and Thompson WF (1980) Rapid isolation of high molecular weight plant DNA. Nucleic Acids Research 8:4321-4325.), and DNA quality and concentration were checked using a NanoDropTM 8000 spectrophotometer (Thermo Scientific, Waltham, Massachusetts, USA).
The hybrid population and parental plants were genotyped using SNP (single-nucleotide polymorphism) markers. The method used to obtain the molecular markers for Citrus using the DArT-seq platform was previously reported (Curtolo et al., 2017Curtolo M, Cristofani-Yaly M, Gazaffi R, Takita MA, Figueira A and Machado MA (2017) QTL mapping for fruit quality in Citrus using DArTseq markers. BMC Genomics 18:289.). Briefly, all the samples (272 hybrids and parents) were genotyped using PstI and TaqI digestion and were sequenced on a HiSeq2000 DArT-seq device (Illumina Inc., San Diego, California, USA) at Diversity Arrays Technology Ltd. (DArT P/L, Canberra, Australia). The resulting sequences were aligned to the Clementine tangerine reference genomeClementine tangerine reference genome, https://www.phytozome.org (accessed 10 September 2017).
https://www.phytozome.org...
(https://phytozome.jgi.doe.gov/pz/portal.html). The DArT-seq technology detects both SNPs (Single Nucleotide Polymorphisms) and DArT-seq markers, which are based only on presence–absence (Raman et al., 2014Raman H, Raman R, Kilian A, Detering F, Carling J, Coombes N, Diffey S, Kadkol G, Edwards D, McCully M et al. (2014) Genome-wide delineation of natural variation for pod shatter resistance in Brassica napus. PLoS One 9:e101673.). The molecular markers were represented in a dataset matrix where columns were the genotypes and rows were the markers. Parameters for quality control such as the call rate and reproducibility over 90% were adopted to select SNP markers for genetic mapping construction.
Linkage maps
The linkage maps were obtained as previously described by Curtolo et al. (2018)Curtolo M, Soratto T, Gazaffi R, Takita MA, Cristofany-Yaly M and Machado MA (2018) High-density linkage maps for Citrus sunki and Poncirus trifoliata using DArTseq markers. Tree Genet Genomes 14:1.. All SNP loci that showed no deviation from the expected segregation were included in the analysis. The SNP molecular markers were coded according to Wu et al. (2002)Wu R, Ma CX, Painter I and Zeng ZB (2002) Simultaneous maximum likelihood estimation of linkage and linkage phases in outcrossing species. Theor Popul Biol 61:349-363. in OneMap software (Margarido et al., 2007Margarido GRA, Souza AP and Garcia AAF (2007) OneMap software for genetic mapping in outcrossing species. Hereditas 144:78-79.). Because this technology provides biallelic markers, three possible segregation patterns were expected: marker segregation for only the female parent (C. sunki) [ab x aa]; only for the male parent (P. trifoliata) [aa x ab]; and for both parents simultaneously [ab x ab]. The maps were constructed considering an LOD score = 8, and the maximum recombination fraction of 0.3. All the markers were aligned using BLASTn (Basic Local Alignment Search Tool)BLASTn tool, https://blast.ncbi.nlm.nih.gov (accessed 28 May 2018).
https://blast.ncbi.nlm.nih.gov...
to the C. sinensis genome (https://citrus.hzau.edu.cn/) to establish the linkage groups because its assembly is based on pseudochromosomes while the Clementine genome is still based on scaffolds.
RNA extraction and cDNA synthesis
We sampled the leaves from 72 hybrids and parent plants (C. sunki and P. trifoliata) both CLas and mock-inoculated (healthy plants). Leaves at a similar age were collected from four sides of the plants for RNA extraction. The samples were ground with liquid nitrogen, resulting in three microtubes with 100 mg for each genotype, consisting of three biological replicates per condition per genotype. Total RNA was extracted with lithium chloride (LiCl) using the protocol described by Chang et al. (1993)Chang S, Puryear J and Cairney J (1993) A simple and efficient method for isolating RNA from pine trees. Plant Mol Biol R 11:113-116. and adapted by Porto et al. (2010)Porto BN, Magalhães PC, Campos NA, Alves JD and Magalhães MM (2010) Otimização de protocolos de extração de RNA em diferentes tecidos de milho. Rev Bras Milho Sorgo 9:189-200.. The genomic DNA was eliminated using a DNase I, RNase-Free kit (Thermo Scientific, Waltham, Massachusetts, USA), according to the manufacturer’s recommendations, followed by purification with phenol-chloroform and ethanol precipitation. RNA quality was verified by agarose gel electrophoresis, and the RNA concentration was determined using a NanoDropTM ND-8000 spectrophotometer (Thermo Scientific, Waltham, Massachusetts, USA). cDNAs were synthesized from 1.0 µg of total RNA using Superscript III (200 U /µl) (Invitrogen, Carlsbad, California, USA) and oligo (dT) primers (dT12-18; Invitrogen) according to the manufacturer’s instructions. The obtained cDNA from the biological replicates was diluted in RNase-free water at the ratio of 1:50 and mixed, forming a pool of samples for each genotype to be analyzed in gene expression and eQTL mapping assays.
Real-time quantitative PCR (RT-qPCR)
The cDNA pool from each genotype was diluted in RNAse-free water at the proportion of 1:25. The reaction comprised 6.0 µL of GoTaq qPCR Master Mix (Promega, São Paulo, Brazil), 2 µL of cDNA, 200 nM of each primer and water to a final volume of 10 µL. Amplifitions were carried out using two replicates for each sample with appropriate negative controls in the 7500 Fast Real-Time PCR System (Applied Biosystems, Foster City, California, USA) thermal cycler with the following conditions: 50 °C for 2 min; 95 °C for 10 min; 40 cycles of 95 °C for 15 s and 60 °C for 1 min.
The CscalS primers were based on Granato et al. (2019)Granato LM, Galdeano DM, Alessandre NR, Breton MC and Machado MA (2019) Callose synthase family genes plays an important role in the Citrus defense response to Candidatus Liberibacter asiaticus. Eur J Plant Pathol 155:25-38., and the endogenous controls (FBOX and GAPC2) were based on Mafra et al. (2012)Mafra V, Kubo KS, Alves-Ferreira M, Ribeiro-Alves M, Stuart RM, Boava LP, Rodrigues CM and Machado MA (2012) Reference genes for accurate transcript normalization in citrus genotypes under different experimental conditions. PLoS One 7:e31263. (Table S1). The primer specificities were checked by melting curve analysis. Amplicons were sequenced using an ABI 3730 sequencer (Applied Biosystems, Foster City, CA, USA) and DyeTerminator chemistry to confirm their identities.
Distribution of mapped SNP marker numbers and sizes (cM) for each linkage group in the C. sunki and P. trifoliata linkage maps.
The amplification efficiency values (E) and Ct data were calculated for each RT-qPCR reaction using Real-time PCR Miner softwareMiner software, http://ewindup.info/miner (accessed 15 May 2018).
http://ewindup.info/miner...
(http://ewindup.info/miner/). The mean of the Ct values of the two technical replicates of each genotype was considered. Using these data, the relative quantification (fold change) was calculated using the 2-ΔΔCT method (Livak and Schmittgen, 2001Livak KJ and Schmittgen TD (2001) Analysis of relative gene expression data using real-time quantitative PCR and the 2(Delta Delta C(T)). Method 25:402-408.). The fold change was calculated using CLas-inoculated plants compared with the respective mock-inoculated plants with FBOX and GAPC2 as reference genes.
During RT-qPCR, 74 genotypes (72 hybrids, C. sunki and P. trifoliata) were separated in four plates (incomplete blocks). In each one, 18 genotypes and the parents were evaluated under mock-inoculated (healthy plants) and CLas-inoculated conditions. The experimental design used to evaluate the samples was an incomplete block design. The model used was as follows: Yij = mu + Bj + Gi + eij, where Yij corresponds to the gene expression of the i-th genotype evaluated in the j-th plate, mu is the model intercept, Bj is the fixed effect for plates, in which j varies from 1 to 4, Gi is the random effect of genotypes, in which i ranges from 1 to 74 and the genotypes 73 and 74 correspond to parents repeated along the four plates, and eij is the random residual effect. The function LME from package NLME of R software was used to analyze the mixed model and estimate the variance components.
Gene expression profile and genetic parameter analyses
Fold-change values adjusted by the mixed model were used as inputs to the MeV (MultiExperiment Viewer) program v. 4.9MeV (MultiExperiment Viewer) program v. 4.9, http://sourceforge.net/projects/mev-tm4/ (accessed 25 June 2018)
http://sourceforge.net/projects/mev-tm4/...
(http:// sourceforge.net/projects/mev-tm4/) to evaluate the gene expression profile. Evaluations were performed comparing the CscalS gene expression between the 72 hybrids and two parents (C. sunki and P. trifoliata) that were CLas inoculated and mock inoculated. The sets of genotypes with gene expression similarity were clustered using the hierarchical clustering method (HCL) and the Pearson correlation as the metric distance. The obtained values were graphically represented as a heatmap.
eQTL mapping
The genetic linkage maps obtained for C. sunki and P. trifoliata were used for eQTL mapping. Relative gene expression values were analyzed using the composite interval mapping (CIM) strategy (Zeng, 1994Zeng Z (1994) Precision mapping of quantitative trait loci. Genetics 136:1457-1468.), adapted to a single fullsib cross and implemented in the FullsibQTL package (Gazaffi et al., 2014Gazaffi R, Margarido GRA, Pastina MM, Mollinari M and Garcia AAF (2014) A model for quantitative trait loci mapping linkage phase and segregation pattern estimation for a full-sib progeny. Tree Genet Genomes 10:791-801.) of the R softwareR software, https://www.r-project.org (accessed 15 May 2018).
https://www.r-project.org...
. Cofactor selection was performed using multiple linear regression analysis with a stepwise approach based on AIC (Akaike Information Criterion), similar to that performed by Souza et al. (2013)Souza LM, Gazaffi R, Mantello CC, Silva CC, Garcia D, Le Guen V, Cardoso SEA, Garcia AAF and Souza AP (2013) QTL mapping of growth-related traits in a full-sib family of rubber tree (Hevea brasiliensis) evaluated in a sub-tropical climate. PLoS One 8:e61238. and Curtolo et al. (2018)Curtolo M, Soratto T, Gazaffi R, Takita MA, Cristofany-Yaly M and Machado MA (2018) High-density linkage maps for Citrus sunki and Poncirus trifoliata using DArTseq markers. Tree Genet Genomes 14:1.. The maximum number of selected cofactors was 20 with a window size of 1000 cM. The permutation test (Churchill and Doerge, 1994Churchill GA and Doerge RW (1994) Empirical threshold values for quantitative trait mapping. Genetics 138:963-971.) was performed with 1000 replicates (P<0.05) to obtain the threshold (LOD score) to declare eQTL. However, the modification proposed by Chen and Storey (2006)Chen L and Storey JD (2006) Relaxed significance criteria for linkage analysis. Genetics 173:2371-2381. was used. All genetic markers flanking an eQTL interval for CscalS were aligned with the Citrus reference genome (http://citrus.hzau.edu.cn/orange/) to check the presence of cis/trans eQTL using the BLASTn tool (https://blast.ncbi.nlm.nih.gov).
Results
C. sunki and P. trifoliata linkage maps
The linkage maps constructed were generated by SNP markers using 272 F1 hybrids from crosses between C. sunki and P. trifoliata. The F1 hybrids sampled were genotyped using 17,482 SNP markers, but 16,337 were excluded. The exclusion criteria for SNP markers were as follows: 2,437 SNP markers had a call rate < 90 (percentage of successfully scored individuals for an allele); 1,338 SNP markers showed distorted segregation; 6,914 SNP markers were homozygous for both parents; and 455 and 5,193 SNP markers were missing calls for C. sunki and P. trifoliata, respectively. The distribution of SNP markers before and after the exclusion is observed in Figures 1 and 2.
Density of markers in the chromosomes considering all markers resulting from the SNP technology from DArT-seq.
Density of markers in the chromosomes after considering a call rate < 90, missing calls in the parent genotyping for C. sunki and P. trifoliata and distortion segregation.
Regarding the remaining 1,145 SNP markers that showed a segregation ratio of 1:1, 571 SNP markers were polymorphic for the parent C. sunki and 574 for P. trifoliata. Initially, only 109 markers were common and polymorphic for both parents. On the other hand, these markers presented segregation deviation and therefore they were excluded. This fact resulted in an impossible integration of the linkage groups of both maps. The original approach proposed by Wu et al. (2002)Wu R, Ma CX, Painter I and Zeng ZB (2002) Simultaneous maximum likelihood estimation of linkage and linkage phases in outcrossing species. Theor Popul Biol 61:349-363. results in a single integrated genetic map modeling the linkage phases between markers. We applied this methodology but analyzing as two separated data sets derived for each parent, similar to the pseudo-testcross strategy (Grattapaglia and Sederoff, 1994Grattapaglia D and Sederoff R (1994) Genetic linkage maps of Eucalyptus grandis and Eucalyptus urophylla using a pseudo-testcross: mapping strategy and RAPD markers. Genetics 137:1121-1137.) and resulting in two separated maps. The C. sunki linkage map exhibited 571 loci and genomic coverage of 2,855 cM, distributed in nine linkage groups (LG) (Figure 3). The groups ranged from 63.68 (LG8) to 530.91 (LG5) cM. LG3 had the highest density of markers (4.21 cM between markers), and LG4 had the lowest density of markers (6.48 cM between markers).
Linkage map of C. sunki using the pseudo-testcross strategy. Distribution of the 571 SNP markers on nine linkage groups of the C. sunki linkage map. X-axis represents linkage groups, and Y-axis indicates the genetic location (cM).
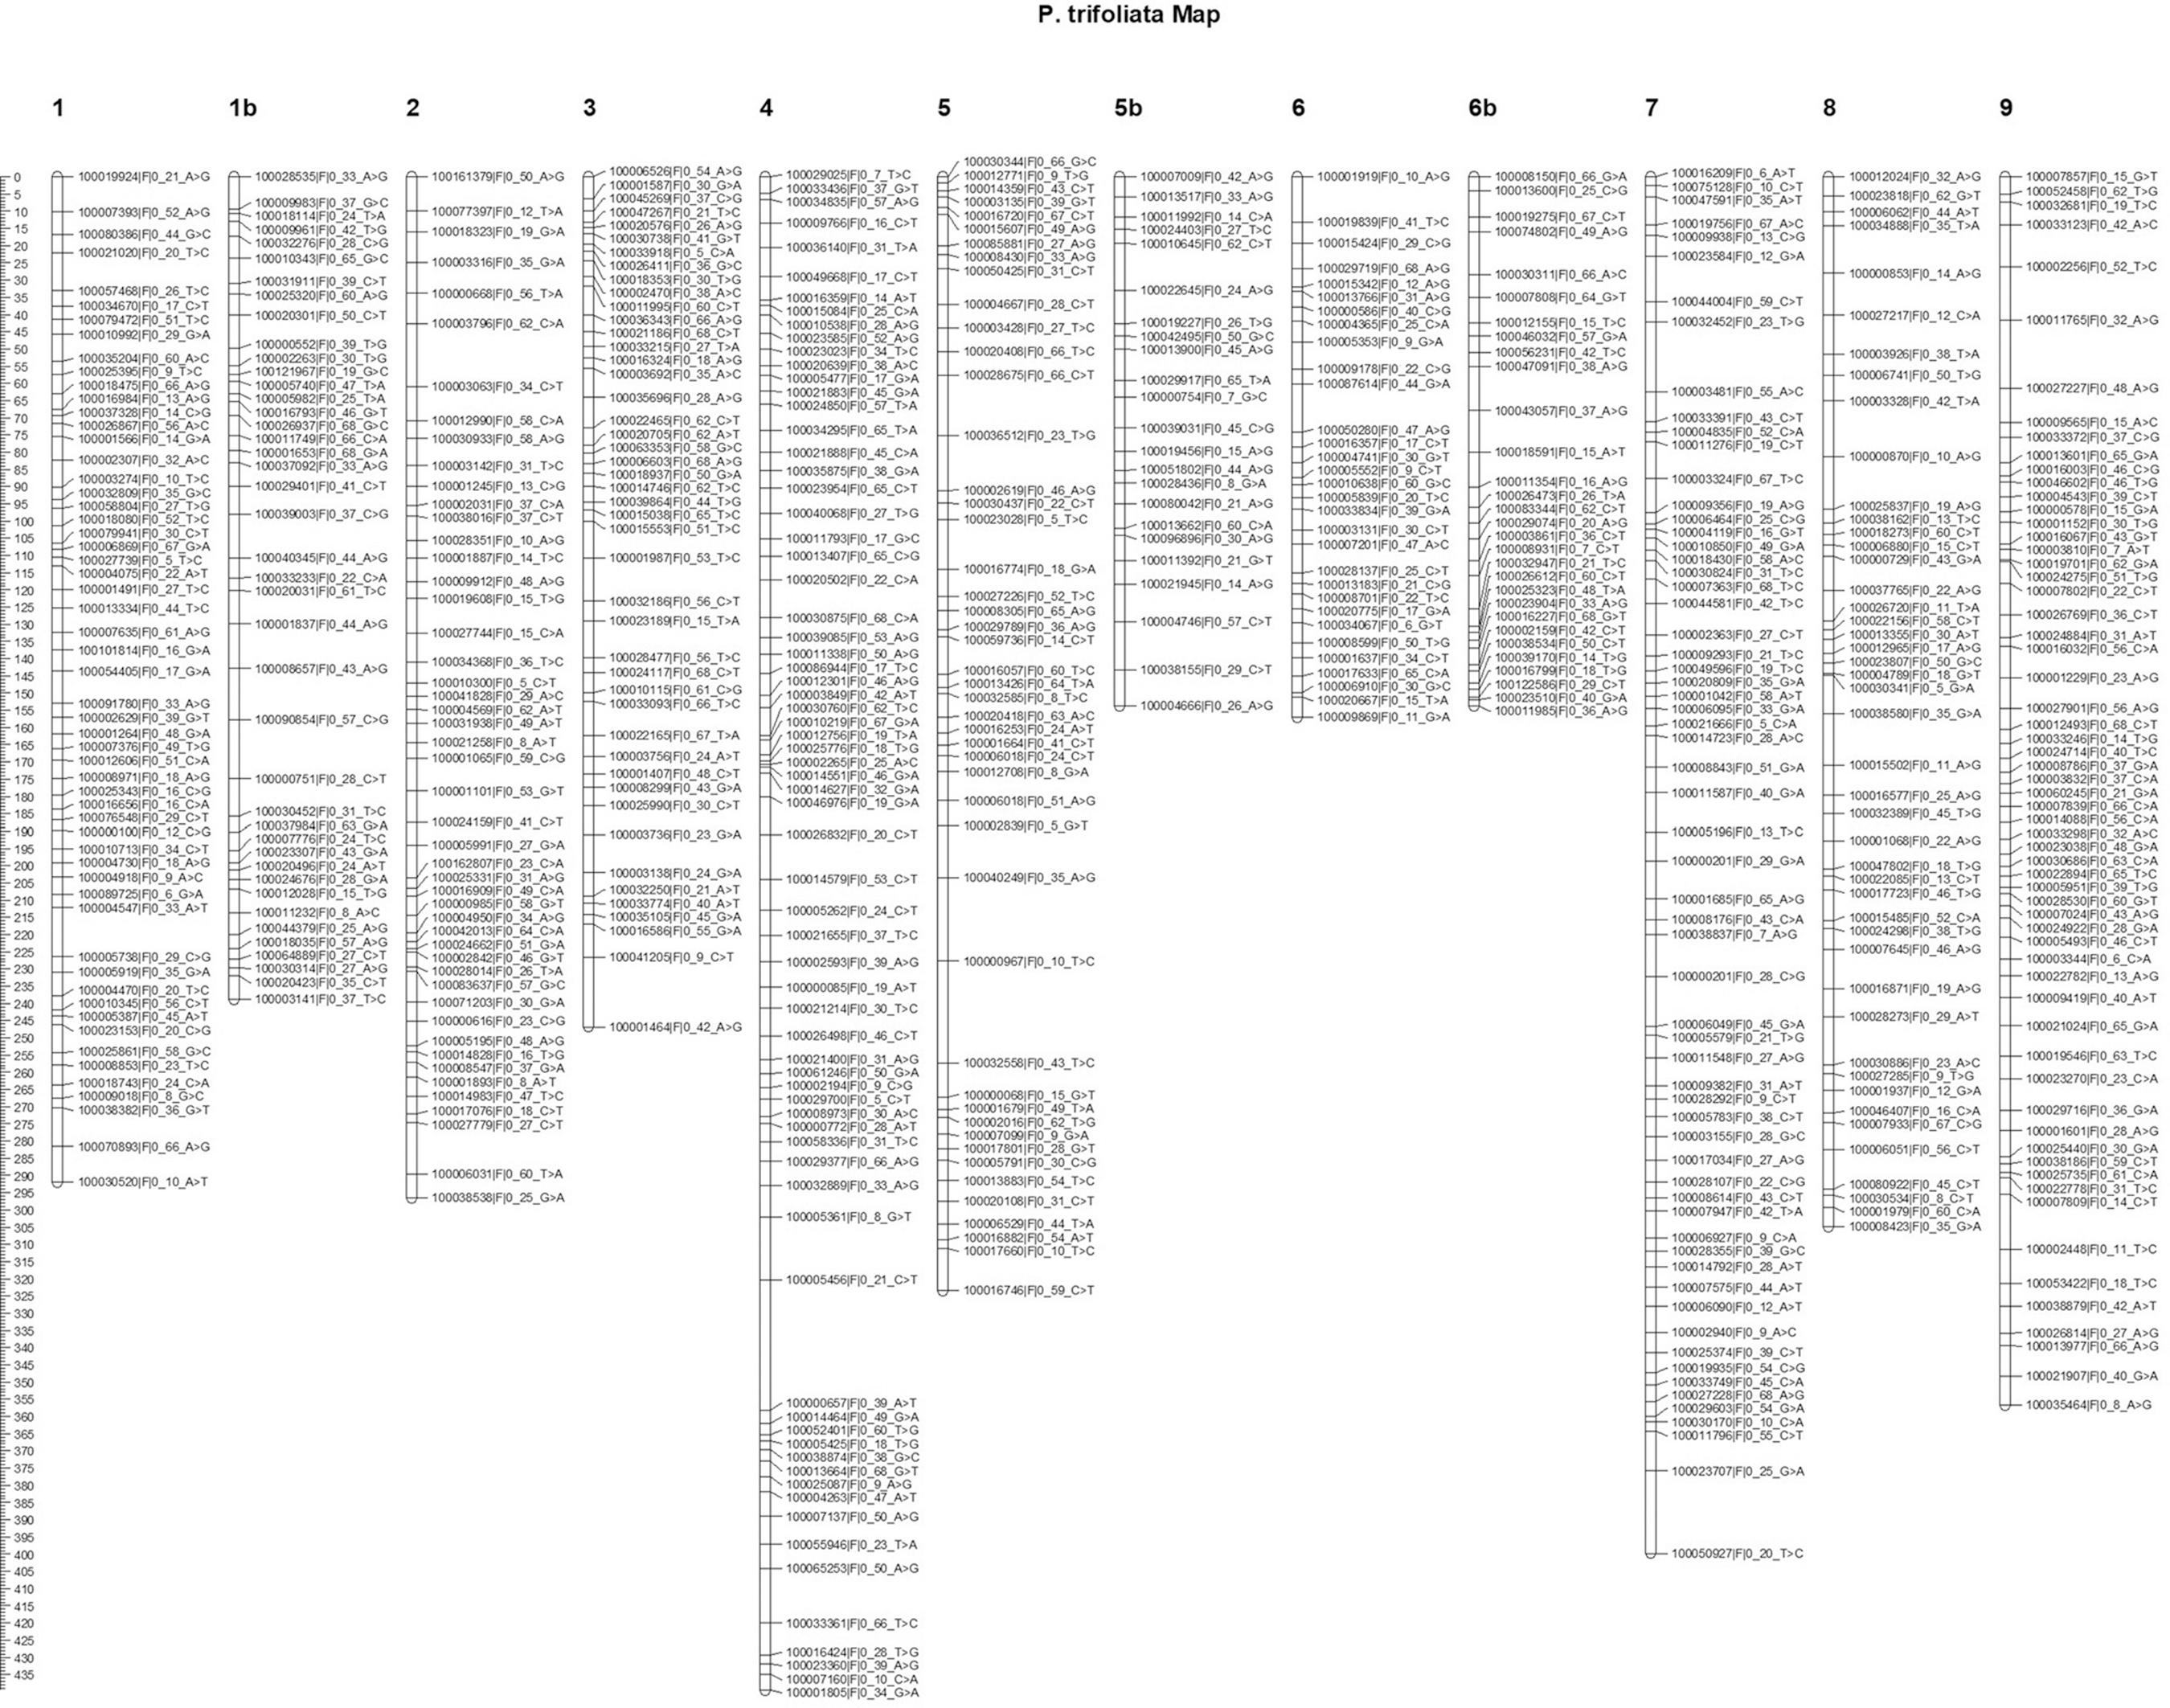
The P. trifoliata linkage map was constructed using 568 markers, and it had a genomic coverage of 3,334.1 cM, distributed in nine linkage groups (Table 1 and Figure 4). Only six SNP markers were not positioned on the map. Some linkage groups (LG1, LG5 and LG6) exhibited some large gaps. To avoid an overestimation of genomic coverage, we divided the linkage groups in subgroups adding the letters “a” and “b”. Based on the genomic information, the linkage groups were identified as LG1 to LG9 and ranged from 143.55 (LG5b) to 439.51 (LG4) cM. LG6a had the highest density of markers (5.06 cM between markers), and LG5a had the lowest density of markers (7.07 cM between markers). However, the molecular markers were compared with the genomic information, and some further information could be obtained (Table 2) e.g., 87 molecular markers were assigned to LG1 for the C. sunki map, among which 71 were correctly aligned with chromosome one, 13 were referred with an unassigned chromosome, and two markers were not aligned with a reference genome. Only one marker was wrongly assigned with other linkage groups, but the genomic information was assigned as chromosome one.
Linkage map of the P. trifoliata using the pseudo-testcross strategy. Distribution of the 568 SNP markers on the nine linkage groups of the P. trifoliata linkage map. X-axis represents linkage groups, and Y-axis indicates the genetic location (cM).
Number of markers not aligned to the reference genome, aligned on the unassigned chromosome (UnChr), in another chromosome (X) or in the corresponding chromosome (Chr).
A general view indicated that 456 (80%) of the markers from the C. sunki map and 434 (76%) of the markers from the P. trifoliata map were correctly grouped. Additionally, 88 (C. sunki) and 93 (P. trifoliata) molecular markers were assigned to an anonymous group (unassigned chromosome) in the reference genome i.e., they do not match any chromosome but the linkage approach provides extra information assigning along the genetic map. Only six markers of C. sunki and one marker of P. trifoliata were not assigned to the reference genome. Twenty-one markers of C. sunki and 40 markers of P. trifoliata were considered linked with groups that do not match genomic positions. In this case, the genomic position prevails to assign the markers to a specific group. Differences between genomic and map positions of markers may have resulted from false positives due to the multiple tests performed.
Gene expression profile
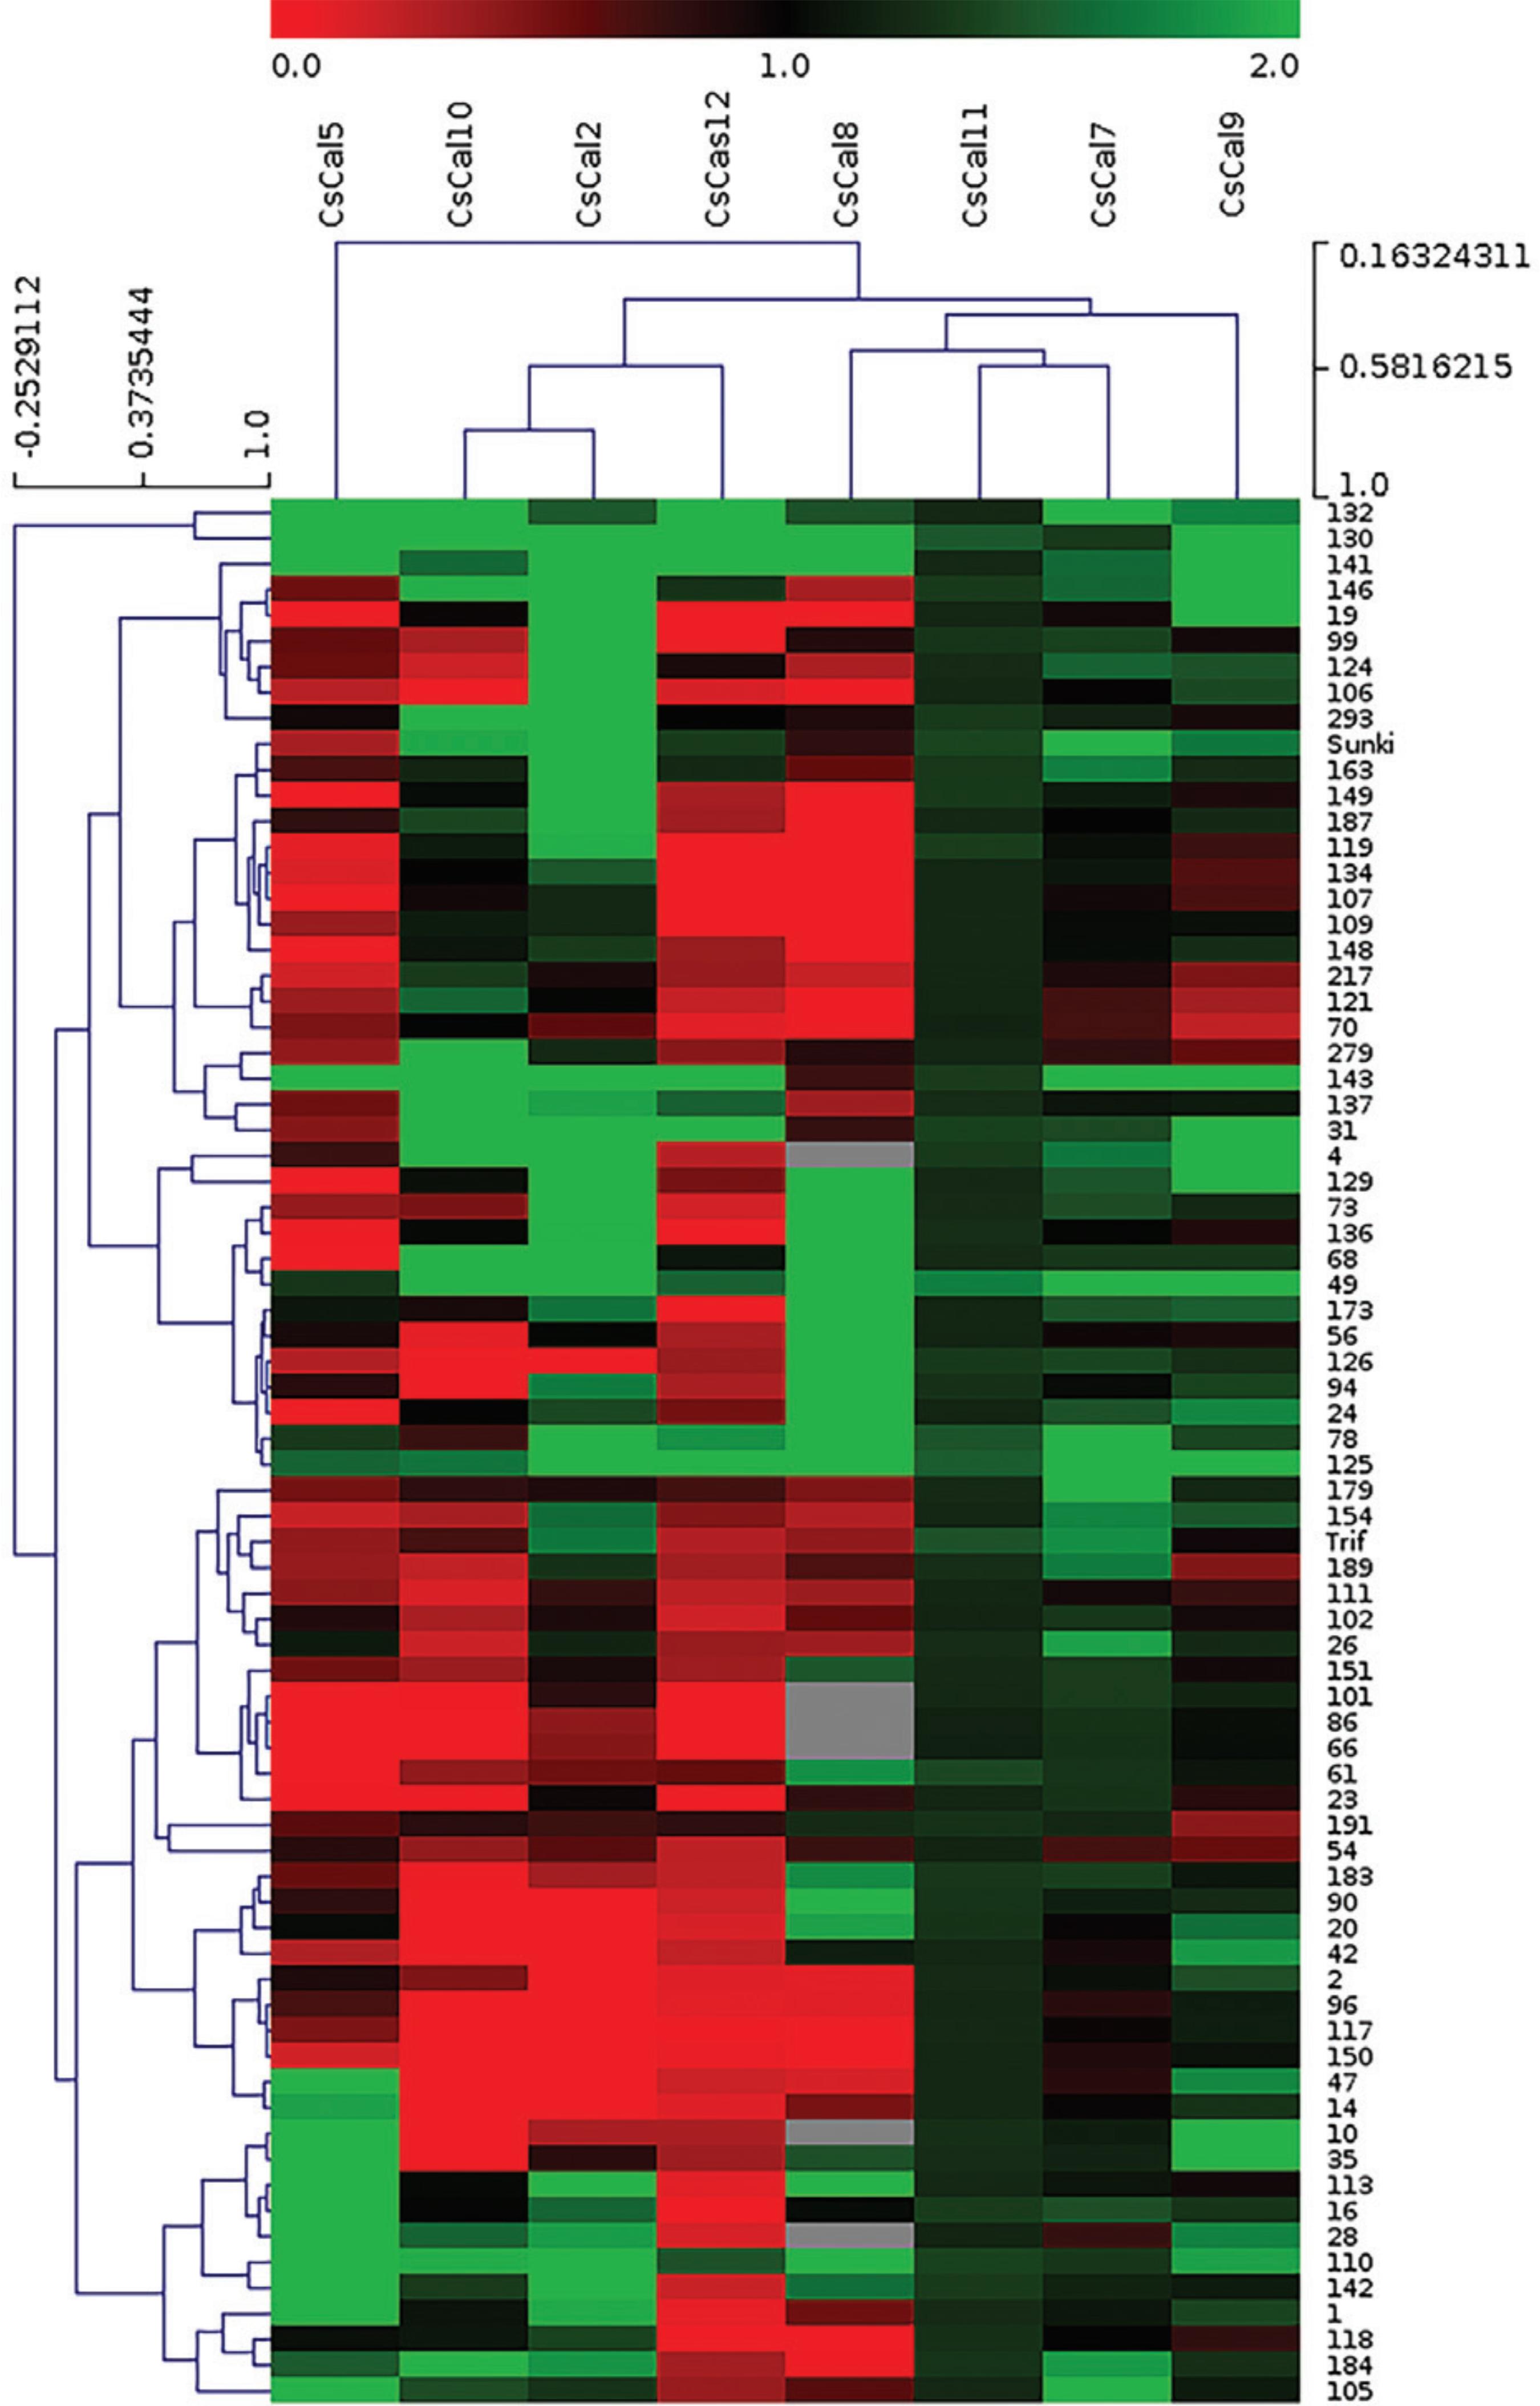
According to the heatmap (Figure 5), the parental C. sunki and 43% of hybrids plants showed a predominantly green overall expression pattern, indicating that genotypes 132, 130, 141, 146, 19, 99, 124, 166, 293, 163, 149, 187, 119, 134, 107, 109, 148, 217, 121, 70, 279, 143, 137, 31, 4, 129, 73, 136, 68, 49, 173, and the parental C. sunki showed upregulation of CscalS gene expression compared with the CLas-infected plants and healthy controls. On the other hand, most of the genotypes (57%) i.e., hybrids 56, 126, 94, 24, 78, 125, 179, 154, 189, 111, 102, 26, 151, 101, 86, 66, 61, 23, 191, 54, 183, 90, 20, 42, 2, 96, 117, 150, 47, 14, 10, 35, 113, 16, 28, 110, 142, 1, 118, 184, 105, and the parental P. trifoliata exhibited downregulation in the expression of CscalS genes compared with that in the CLas-infected plants and heathy controls.
Heatmap of the gene expression profile by clustering analysis between the eight CscalS genes evaluated using the 74 genotypes (72 hybrids and the parent plants P. trifoliata and C. sunki). The heatmap was made using fold-change normalized data as inputs to the MeV (MultiExperiment Viewer) program v. 4.9 (http://sourceforge.net/projects/mev-tm4/). The names of genes and gene hierarchical clusters are shown at the top. Fold-change expression values ranged from green (highest expression) to red (lowest expression). The sample names (74 genotypes) are shown on the right side, while the sample hierarchical cluster is shown on the left side.
In the same analysis, the parental P. trifoliata showed upregulated expression of CscalS2 and CscalS7, while CscalS11 and the parental C. sunki displayed upregulated expression of CscalS2, CscalS7, CscalS9, CscalS10, CscalS11 and CscalS12. Regarding the hybrids, it is possible to observe that regulation of the analyzed CscalS genes was very different among them. The expression of CscalS2 and CscalS7 was upregulated in most genotypes, including the parental C. sunki and P. trifoliata. CscalS9 and CscalS10 also demonstrated upregulation in 53 genotypes. CscalS5 and CscalS12 were revealed to be largely down-regulated in the genotypes. The expression of CscalS11 presented upregulation in all the genotypes analyzed, and CscalS8 was upregulated in 27 genotypes.
The heatmap (Figure 5), based on the comparative analysis performed by hierarchical clustering (HCL) of CscalS genes and the 72 hybrids plus their two parents (C. sunki and P. trifoliata) allowed the grouping of genes and related genotypes. Additionally, Pearson’s correlation was used as a metric distance to obtain the best intra and inter-variable grouping possible. The genotypes were separated into eight subgroups distributed into three main clusters. The parent P. trifoliata was internally clustered with the genotypes 154 and 189, while the parent C. sunki was clustered together with the genotypes 163 and 149. Both parent clusters were grouped with the remaining genotypes to form a larger main cluster.
The genes were separated into three clusters. The first cluster was formed by CscalS2, CscalS10 and CscalS12, the second cluster was formed by CscalS7, CscalS8, CscalS9 and CscalS11, and a third one was formed only by CscalS5.
The adjusted values of the CsCalS relative gene expression from the F1 hybrids were used to calculate the genetic parameters (heritability, variance, and coefficient of variation). The genotypic variance (Vg) ranged from 0.11 to 40.81, expressed as the genotypic variation coefficient (CVg) that varied from 26.11 to 369.23% (Table 3). Phenotypic variance (Vf) estimates varied from 1.37 to 41.22, and the highest values were obtained for the genes CscalS8 (41.22) and CscalS12 (15.95). High values of heritability (h2) for the studied callose synthase genes were observed, with the exception of CscalS11 (6.00), indicating that, for this gene, the genotypic variance was proportionally lower than the environmental variance.
Estimates of genotypic and phenotypic variances, heritability and coefficients of variation for gene expression.
eQTL mapping
It was possible to detect eQTL in response to infection caused by CLas using the C. sunki and P. trifoliata linkage maps and gene expression profiles from the relative expression values (fold change) of CscalS genes evaluated in the 72 hybrids.
Considering the CscalS expression profile, 18 eQTL were mapped in the C. sunki linkage map, and the LOD scores of the eQTL ranged from 3.22 to 17.87 (Figure 6 and Table 4). All eQTL detected showed a 1:1 segregation pattern, and they were mapped in all linkage groups, except LG5. One eQTL was detected for CscalS2 on LG9; five eQTL for CscalS7 were detected on LG2, LG3, LG7, LG8 and LG9; two eQTL for CscalS8 were detected on LG6 and LG7; six eQTL for CscalS9 were detected on LG2, LG3, LG4, LG6, LG7 and LG9; one eQTL for CscalS10 was detected on LG2; and three eQTL for CscalS12 were detected on LG1, LG6 and LG7. It was not possible to detect eQTL for CscalS5 and CscalS11. The phenotypic variance values (R2) explained by the eQTL mapped varied from 0.49% to 20.18%. The eQTL detected for CscalS7 on LG8 exhibited the highest R2 using the C. sunki map (20.18%). Together, the five eQTL for CscalS7 explained 53.12% of the phenotypic variation; thus, CscalS7 had the highest percentage of the phenotypic variation explained by the eQTL mapping. The highest number ofeQTL was detected for CscalS9 (six eQTL), and, overall, they represented 30.38% of the phenotypic variation. The three eQTL were identified for CscalS12, explaining 30.46% of the phenotypic variation.
Detection of eQTL in the C. sunki linkage map related to the expression of the CscalS genes evaluated. Y-axis: LOD; X-axis: distance incentiMorgans; the dashed lines represent threshold values obtained using 1000 replicates.
eQTL mapping for CscalSl, CscalSl, CscalS8, CscalS9, CscalS10, CscalSH in C. sunki linkage map.
The colocalization of eQTL may suggest the existence of hot spots. eQTL for CscalS7 and CscalS9 could be observed on LG2, LG3, LG7, and LG9 separated by 21.00, 9.20, 6.83, and 19.40 cM, respectively. Considering the 18 eQTL identified in the C. sunki map, eight were clustered in four different hot spots.
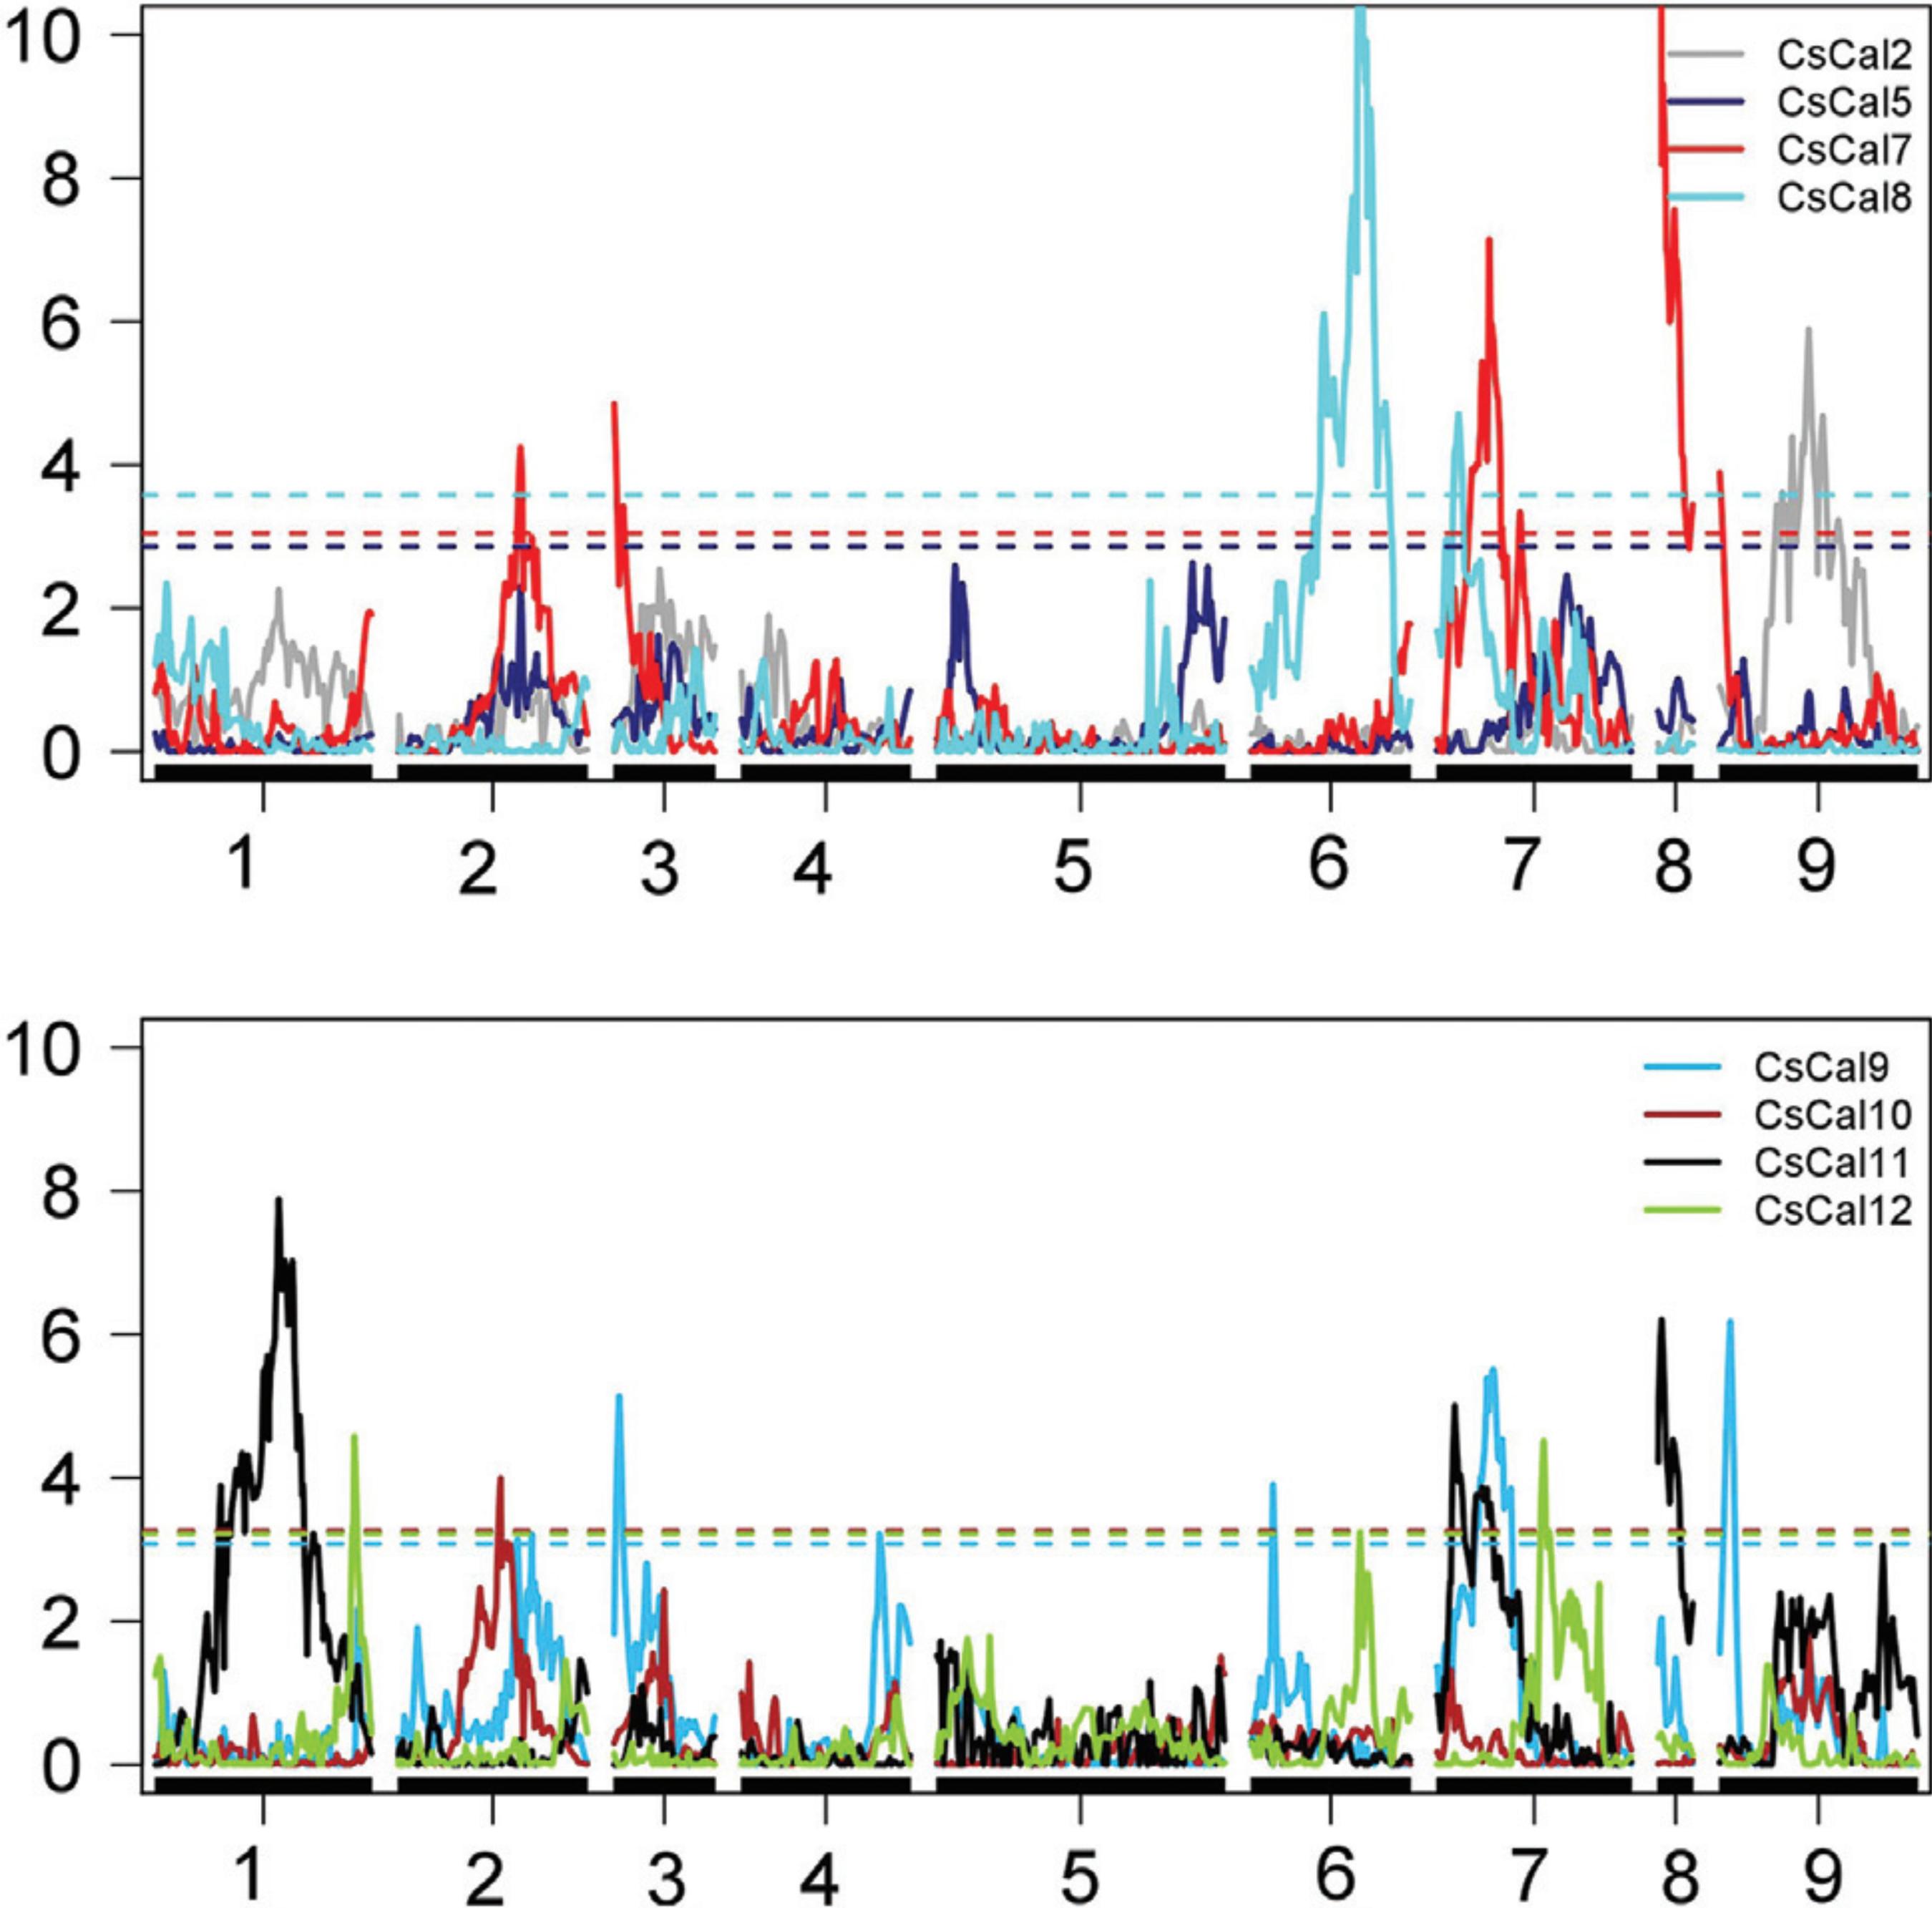
In the P. trifoliata linkage map, it was possible to map 34 eQTL (Figure 7 and Table 5): eight eQTL for CscalS2 were distributed on LG2, LG4, LG5, LG6, LG7, and LG8; seven eQTL for CscalS5 were distributed on LG1b, LG2, LG5, LG7, LG9; seven eQTL for CscalS7 were distributed on LG2, LG4, LG5, LG8, LG9; two eQTL for CscalS8 were distributed on LG4 and LG8; five eQTL for CscalS9 were distributed on the LG1, LG1b, LG2, LG5b, LG7; and five eQTL for CscalS12 were distributed on LG2, LG5, LG5b, LG7, LG8. No eQTL was identified for either CscalS10 or CscalS11.
Detection of eQTL in the P. trifoliata linkage map related to the expression of the CscalS genes evaluated. Y-axis: LOD; X-axis: distance in centiMorgans; the dashed lines represent threshold values obtained with 1000 replicates.
eQTL mapped for CscalSl, CscalS5, CscalSl, CscalS8, CscalS9, CscalSH in the P. trifoliata linkage map.
Overall, R2 varied from 0.4 to 22.63%, the LOD score ranged from 3.21 to 9.56 and all segregated in a 1:1 fashion. Considering the eQTL mapping for P. trifoliata, eQTL for CscalS7 had the highest R2 (22.63%) and, when the seven eQTL were considered together, they summed the highest R2 (55.61%). The region with the lowest R2 was identified for CscalS2, explaining only 0.4% of the phenotypic variation.
CscalS2 had the highest number of regions detected in this study. Thirty-nine percent of the phenotypic variation were explained by the eight eQTL detected for CscalS2. Five other markers were associated with CscalS8, and, overall, they summed an R2 of 39.62%. Two eQTL detected for CscalS2 and CscalS12 were overlapped. They were located on LG2 approximately 203-206 cM and further on two eQTL that were overlapped for CscalS5 and CscalS12 (230 cM). Another overlap eQTL for CscalS5 and CscalS9 was found on LG1b. The co-location of eQTL was detected for CscalS2 and CscalS12 on LG8, separated by 2.42 cM. Three overlap loci were identified between CscalS2 and CscalS7: the first on LG4, the second separated by 14 cM on LG5 and the last on LG9 distant by 14 cM.
The existence of eQTL was noticed for the same CsCalS and LG in C. sunki and P. trifoliata maps. In both maps, eQTL were detected for CscalS2 on LG9, CscalS7 on LG2, CscalS7 on LG8 and LG9, CscalS9 on LG2 and LG7 and CscalS12 on LG7. It is worth highlighting that the major eQTL identified in the C. sunki and P. trifoliata maps was positioned in the same linkage group (LG8).
Genomic information, such as the physical position, is not always accessible for CscalS; thus, inferring whether cis or trans eQTL exist becomes a challenge. Only the physical position is available for CscalS2 (Chr 7), CscalS5 (Chr 1), CscalS7 (Chr 7), CscalS8 (Chr 5) CscalS10 (Chr 5), and CscalS11 (Chr 2) (Granato et al., 2019Granato LM, Galdeano DM, Alessandre NR, Breton MC and Machado MA (2019) Callose synthase family genes plays an important role in the Citrus defense response to Candidatus Liberibacter asiaticus. Eur J Plant Pathol 155:25-38.). However, there is no eQTL close to the genes, suggesting the presence of epistatic eQTL or trans eQTL. In the cases of CscalS9 and CscalS12, for which the physical locations are not described, an inference between cis and trans is not feasible.
Discussion
The hybrid population obtained from C. sunki and P. trifoliata crossing was genotyped using 17,482 SNP markers. However, the C. sunki and P. trifoliata genetic linkage maps were constructed using 571 and 568 representative SNP markers, respectively. Although a high number of SNP markers has been generated by genotyping using sequencing technology, many markers were excluded from the analysis due to the drawback of many lines being multiplexed during sequencing. Moreover, 1,338 SNP markers did not show the expected segregation. Deviations from the segregation can be the result of crosses among different genera (Citrus and Poncirus), as previously reported (Curtolo et al., 2018Curtolo M, Soratto T, Gazaffi R, Takita MA, Cristofany-Yaly M and Machado MA (2018) High-density linkage maps for Citrus sunki and Poncirus trifoliata using DArTseq markers. Tree Genet Genomes 14:1.). The SNP marker exclusion resulted in a low number of polymorphic markers. We believe that monomorphic markers are often generated by technical and biological reasons. Genotyping technology with library construction, read depth, and data handling are possible causes of the presence of noninformative markers. Additionally, we should consider the limited population size as a possible explanation of monomorphic marker presence because the number of genotyped individuals determines the chance to detect recombinant loci. A large ratio of monomorphic markers has been reported as a disadvantage of high-throughput genotyping (Shimada et al., 2014Shimada T, Fujii H, Endo T, Ueda T, Sugiyama A, Nakano M, Kita M, Yoshioka T, Shimizu T and Nesumi H (2014) Construction of a citrus framework genetic map anchored by 708 gene-based markers. Tree Genet Genomes 10:1001-1013.; Guo et al., 2015Guo F, Yu HW, Zheng T, Jiang XL, Wang L, Wang X, Xu Q and Deng X (2015) Construction of a SNP-based high-density genetic map for pumelo using RAD sequencing. Tree Genet Genomes 11:2.; Yu et al., 2016aYu Y, Chen C and Gmitter FG (2016a) QTL mapping of mandarin (Citrus reticulata) fruit characters using high-throughput SNP markers. Tree Genet Genome 12:77.; Curtolo et al., 2017Curtolo M, Cristofani-Yaly M, Gazaffi R, Takita MA, Figueira A and Machado MA (2017) QTL mapping for fruit quality in Citrus using DArTseq markers. BMC Genomics 18:289.; Imai et al., 2017Imai A, Yoshioka T and Hayashi T (2017) Quantitative trait locus (QTL) analysis of fruit-quality traits for mandarin breeding in Japan. Tree Genet Genomes 13:79.). It should be noted that the crossing between two parents from different genera contributes to few marker polymorphic at the same time for both parents i.e., SNPs are not as old as that required for being shared by C. sunki and P. trifoliata because SNPs are conservative markers. This corroborates the idea that both parents are not genetically related and explains why two maps were obtained, one for each parent. Previously, Curtolo et al. (2018)Curtolo M, Soratto T, Gazaffi R, Takita MA, Cristofany-Yaly M and Machado MA (2018) High-density linkage maps for Citrus sunki and Poncirus trifoliata using DArTseq markers. Tree Genet Genomes 14:1. used dominant markers such as DArTseq and obtained loci shared by C. sunki and P. trifoliata; however, the number of markers was not sufficient to enable information integration from both parents.
SNPs have been considered the most attractive markers to obtain genetic mapping, and they can be genotyped in parallel assays at low costs in marker-assisted breeding (Bertioli et al., 2014Bertioli DJ, Ozias-Akins P, Chu Y, Dantas KM,S antos SP, Gouvea E, Guimarães PM, Leal-Bertioli SC, Knapp SJ and Moretzsohn MC (2014) The use of SNP markers for linkage mapping in diploid and tetraploid peanuts. G3 (Bethesda) 4:89-96.). There are six genetic maps for Citrus using SNP markers (Ollitrault et al., 2012Ollitrault P, Terol J, Garcia-Lor A, Bérard A, Chauveau A, Froelicher Y, Belzile C, Morillon R, Navarro L, Brunel D et al. (2012) SNP mining in C. clementina BAC end sequences; transferability in the Citrus genus (Rutaceae) phylogenetic inferences and perspectives for genetic mapping. BMC Genomics 13:13-16.; Xu et al., 2012Xu Q, Chen LL, Ruan X, Chen D, Zhu A, Chen C, Bertrand D, Jiao B, Hao B, Lyon MP et al. (2012) The draft genome of sweet orange (Citrus sinensis). Nat Genet 45:59-66.; Guo et al., 2015Guo F, Yu HW, Zheng T, Jiang XL, Wang L, Wang X, Xu Q and Deng X (2015) Construction of a SNP-based high-density genetic map for pumelo using RAD sequencing. Tree Genet Genomes 11:2.; Yu et al., 2016aYu Y, Chen C and Gmitter FG (2016a) QTL mapping of mandarin (Citrus reticulata) fruit characters using high-throughput SNP markers. Tree Genet Genome 12:77.; Imai et al., 2017Imai A, Yoshioka T and Hayashi T (2017) Quantitative trait locus (QTL) analysis of fruit-quality traits for mandarin breeding in Japan. Tree Genet Genomes 13:79.; Huang et al., 2018Huang M, Roose ML, Yu Q, Du D, Yu Y, Zhang Y, Deng Z, Stover E and Gmitter FG (2018) Construction of high-density genetic maps and detection of QTLs associated with Huanglongbing tolerance in citrus. Front Plant Sci 9:1694.). However, this study is the first to demonstrate a linkage map for Citrus using SNP markers obtained from DArT-seq technology.
C. sunki and P. trifoliata linkage maps showed SNP markers distributed in nine linkage groups, corresponding to the haploid number of chromosomes of citrus. In both maps, few SNP markers were positioned in a different chromosome where most of the markers were located (Table 2). The difference in the marker position can be caused by the assembled difference between the species used in the reference genome and constructed linkage maps. The establishment of the marker position that has been grouped in the unassigned chromosome (UnChr) is a contribution of the present work. Furthermore, it could help update the Citrus sinensisCitrus sinensis reference genome, http://citrus.hzau.edu.cn/ (accessed 28 May 2018).
http://citrus.hzau.edu.cn/...
genome, as previously reported by Curtolo et al. (2017)Curtolo M, Cristofani-Yaly M, Gazaffi R, Takita MA, Figueira A and Machado MA (2017) QTL mapping for fruit quality in Citrus using DArTseq markers. BMC Genomics 18:289.. In the P. trifoliata map, some linkage groups were separated into “a” and “b” groups to avoid an overestimation of the genomic coverage. Nevertheless, the map and some groups of P. trifoliata are larger than those designed for C. sunki. Other authors also showed differences among linkage group sizes (Chen et al., 2008Chen CX, Bowman KD, Choi YA, Dang PM, Rao MN, Huang S, Soneji JR, McCollum TG and Gmitter FG (2008) EST-SSR genetic maps for Citrus sinensis and Poncirus trifoliata. Tree Genet Genomes 4:1-10.; Huang et al., 2018Huang M, Roose ML, Yu Q, Du D, Yu Y, Zhang Y, Deng Z, Stover E and Gmitter FG (2018) Construction of high-density genetic maps and detection of QTLs associated with Huanglongbing tolerance in citrus. Front Plant Sci 9:1694.). The recombination rate, which is used to obtain the maps, is distinct between females and males, both in plants and animals (Lorch, 2005Lorch PD (2005) Sex differences in recombination and mapping adaptations. Genetica 123:39-47.). Ollitrault et al. (2012)Ollitrault P, Terol J, Garcia-Lor A, Bérard A, Chauveau A, Froelicher Y, Belzile C, Morillon R, Navarro L, Brunel D et al. (2012) SNP mining in C. clementina BAC end sequences; transferability in the Citrus genus (Rutaceae) phylogenetic inferences and perspectives for genetic mapping. BMC Genomics 13:13-16. and Huang et al. (2018)Huang M, Roose ML, Yu Q, Du D, Yu Y, Zhang Y, Deng Z, Stover E and Gmitter FG (2018) Construction of high-density genetic maps and detection of QTLs associated with Huanglongbing tolerance in citrus. Front Plant Sci 9:1694. noticed that the size of male genetic maps is usually larger than that of female genetic maps. It corroborates the linkage maps obtained in this study, because C. sunki was the female parent and P. trifoliata was the male parent of the crossing, generating the studied hybrid population.
The presented linkage maps are a substantial resource for future studies of Citrus. The parents and hybrids used for the analyses revealed many important characteristics for citriculture. For example, both parents are important rootstocks, and C. sunki has high vigor and good fruit yield, as well as tolerance to Tristeza, citrus blight disease and salinity (Castle et al., 1993Castle WS, Tucker DPH, Krezdorn AH and Youtsey CO (1993) Rootstocks for Florida Citrus; rootstock selection -the first step to success. 2nd edition. University of Florida, Gainesville.). P. trifoliata is immune to citrus tristeza virus and resistant to nematodes, although it has low tolerance to drought (Passos et al., 2006Passos OS, Peixouto LS, Santos LC, Caldas RC and Soares Filho WS (2006) Caracterização de híbridos de Poncirus trifoliata e de outros porta-enxertos de citros no Estado da Bahia. Rev Bras Frutic 28:410-413.). P. trifoliata was also reported to be more tolerant to HLB because it does not show starch accumulation in leaf chloroplasts and does not show typical HLB symptoms, unlike C. sunki (Boava et al., 2017Boava LP, Cristofani-Yaly M and Machado MA (2017) Physiologic anatomic and gene expression changes in Citrus sunki. Poncirus trifoliata and their hybrids after Liberibacter asiaticus infection. Phytopathology 107:590-599.).
The excessive accumulation of starch in Citrus leaves during CLas infection has often been associatedwith photo-assimilate transport disturbance (Koh et al., 2012Koh EJ, Zhou L, Williams DS, Park J, Ding N, Duan YP and Kang BH (2012) Callose deposition in the phloem plasmodesmata and inhibition of phloem transport in citrus leaves infected with “Candidatus Liberibacter asiaticus”. Protoplasma 249:687-697.; Boava et al., 2017Boava LP, Cristofani-Yaly M and Machado MA (2017) Physiologic anatomic and gene expression changes in Citrus sunki. Poncirus trifoliata and their hybrids after Liberibacter asiaticus infection. Phytopathology 107:590-599.; Wang et al., 2017Wang N, Pierson EA, Setubal JC, Xu J, Levy JG, Zhang Y, Li J, Rangel LT and Martins Jr. J (2017) The Candidatus liberibacter-host interface: insights into pathogenesis mechanisms and disease control. Annu Rev Phytopathol 55:451-482.). The reduction of photo-assimilate transport of leaf sources to the sink organs results from deposition of callose and phloem proteins (PP2) in the phloem of infected plants (Koh et al., 2012Koh EJ, Zhou L, Williams DS, Park J, Ding N, Duan YP and Kang BH (2012) Callose deposition in the phloem plasmodesmata and inhibition of phloem transport in citrus leaves infected with “Candidatus Liberibacter asiaticus”. Protoplasma 249:687-697.; Wang and Trivedi, 2013Wang N and Trivedi P (2013) Citrus Huanglongbing: a newly relevant disease presents unprecedented challenges. Phytopathology 103:652-65.; Boava et al., 2017Boava LP, Cristofani-Yaly M and Machado MA (2017) Physiologic anatomic and gene expression changes in Citrus sunki. Poncirus trifoliata and their hybrids after Liberibacter asiaticus infection. Phytopathology 107:590-599.). Callose is synthetized by the callose synthase enzymes (CalS), whose activity is highly regulated by pathogen infection (Yu et al., 2016bYu Y, Jiao L, Fu S, Yin L, Zhang Y and Lu J (2016b) Callose synthase family genes involved in the grapevine defense response to downy mildew disease. Phytopathology 106:56-64.; Granato et al., 2019Granato LM, Galdeano DM, Alessandre NR, Breton MC and Machado MA (2019) Callose synthase family genes plays an important role in the Citrus defense response to Candidatus Liberibacter asiaticus. Eur J Plant Pathol 155:25-38.). In this study, the expression of all evaluated CscalS was regulated in CLas-infected citrus leaves, demonstrating that multiple callose synthase genes can be expressed in the same organ (Dong et al., 2008Dong X, Hong Z, Chatterjee J, Kim S and Verma DP (2008) Expression of callose synthase genes and its connection with Npr1 signaling pathway during pathogen infection. Planta 229:87-98.; Granato et al., 2019Granato LM, Galdeano DM, Alessandre NR, Breton MC and Machado MA (2019) Callose synthase family genes plays an important role in the Citrus defense response to Candidatus Liberibacter asiaticus. Eur J Plant Pathol 155:25-38.). Most of the genotypes analyzed (57%), including the parental P. trifoliata, showed CscalS gene expression downregulation comparing the CLas-infected plants and heathy controls. On the other hand, the parental C. sunki and 43% of the genotypes showed upregulation of CscalS gene expression after CLas infection.
The CscalS2 gene was upregulated in many genotypes, including the parental C. sunki. CalS2 has not been characterized yet. However, in Arabidopsis, it shares high homology (92% identity) with CalS1, suggesting that a gene duplication event may have occurred, and it is possible that the two genes encoding both enzymes are functionally redundant (Hong et al., 2001Hong Z, Delauney AJ and Verma DPS (2001) A cell plate–specific callose synthase and its interaction with phragmoplastin. Plant Cell 13:755-768.). CscalS2 upregulated expression in C. sunki and hybrids may indicate that this gene plays an important role in callose accumulation, as a strategy to alter plasmodesma permeability under CLas infection because it occurs in Arabidopsis rosette leaves after salicylic acid (SA) and Hyaloperonospora arabidopsis infection (Cui and Lee, 2006Cui W and Lee JY (2006) Arabidopsis callose synthases CalS1/8 regulate plasmodesmal permeability during stress. Nat Plants 2:16034.; Dong et al., 2008Dong X, Hong Z, Chatterjee J, Kim S and Verma DP (2008) Expression of callose synthase genes and its connection with Npr1 signaling pathway during pathogen infection. Planta 229:87-98.).
CscalS7 has been demonstrated to be responsible for callose deposition specifically in the phloem sieve tubes (Barratt et al., 2011Barratt DH, Kolling K, Graf A, Pike M, Calder G, Findlay K, Zeeman SC and Smith AM (2011) Callose synthase GSL7 is necessary for normal phloem transport and inflorescence growth in Arabidopsis. Plant Physiol 155:328-341.; Xie et al., 2011Xie B, Wang X, Zhu M, Zhang Z and Hong Z (2011) CalS7 encodes a callose synthase responsible for callose deposition in the phloem. Plant J 65:1-14.). CscalS7 was upregulated in P. trifoliata in CLas-infected plants. However, upregulation was lower than that observed for C. sunki (Table S2). The CscalS7 gene was also upregulated in 49 other genotypes. The lower expression value of P. trifoliata can be due to its tolerance to HLB, or callose deposition in P. trifoliata does not cause hypertrophy of the phloem parenchyma cells and collapse of the sieve tube elements (STE) because it occurs in C. sunki (Folimonova et al., 2009Folimonova SY, Robertson CJ, Garnsey SM, Gowda S and Dawson WO (2009) Examination of responses of different genotypes of citrus to Huanglongbing (citrus greening) under different conditions. Phytopathology 99:1346-1354.; Koh et al., 2012Koh EJ, Zhou L, Williams DS, Park J, Ding N, Duan YP and Kang BH (2012) Callose deposition in the phloem plasmodesmata and inhibition of phloem transport in citrus leaves infected with “Candidatus Liberibacter asiaticus”. Protoplasma 249:687-697.). As previously shown for the HLB pathosystem (Granato et al., 2019Granato LM, Galdeano DM, Alessandre NR, Breton MC and Machado MA (2019) Callose synthase family genes plays an important role in the Citrus defense response to Candidatus Liberibacter asiaticus. Eur J Plant Pathol 155:25-38.) and grapevine-resistant cultivar Vitis amurensis `Shuanghong׳ infected with Plasmopara viticola (Yu et al., 2016bYu Y, Jiao L, Fu S, Yin L, Zhang Y and Lu J (2016b) Callose synthase family genes involved in the grapevine defense response to downy mildew disease. Phytopathology 106:56-64.), calS7 upregulation after infection indicates that callose deposition specifically at phloem sieve tubes occurs to block the flow of the pathogens, which probably occurred in C. sunki, P. trifoliata and their hybrids.
Other CscalS also presented upregulation in the analyzed genotypes, such as CscalS9, CscalS10, and CscalS12. CalS9 and CalS10 functions have been more related to gametophyte development (Töller et al., 2008Töller A, Brownfield L, Neu C, Twell D and Schulze-Lefert P (2008) Dual function of Arabidopsis glucan synthase-like genes GSL8 and GSL10 in male gametophyte development and plant growth. Plant J 54:911-923.) than the plant defense response. Nevertheless, the biological role of calS12 has been well studied in the stress and pathogen response (Nishimura et al., 2003Nishimura MT, Stein M, Hou BH, Vogel JP, Edwards H and Somerville SC (2003) Loss of a callose synthase results in salicylic acid-dependent disease resistance. Science 301:969-972.; Dong et al., 2008Dong X, Hong Z, Chatterjee J, Kim S and Verma DP (2008) Expression of callose synthase genes and its connection with Npr1 signaling pathway during pathogen infection. Planta 229:87-98.; Luna et al., 2011Luna E, Pastor V, Robert J, Flors V, Mauch-Mani B and Ton J (2011) Callose deposition: a multifaceted plant defense response. Mol Plant Microbe Interact 24:183-193.; Ellinger and Voigt, 2014Ellinger D and Voigt CA (2014) Callose biosynthesis in Arabidopsis with a focus on pathogen response: what we have learned within the last decade. Ann Bot 114:1349-1358.). For example, calS12 is required for callose deposition in cell wall thickenings at the sites of fungal pathogen attack during powdery mildew infection (Dong et al., 2008Dong X, Hong Z, Chatterjee J, Kim S and Verma DP (2008) Expression of callose synthase genes and its connection with Npr1 signaling pathway during pathogen infection. Planta 229:87-98.). Additionally, Granato et al. (2019)Granato LM, Galdeano DM, Alessandre NR, Breton MC and Machado MA (2019) Callose synthase family genes plays an important role in the Citrus defense response to Candidatus Liberibacter asiaticus. Eur J Plant Pathol 155:25-38. also demonstrated that, in C. sinensis, at 360 days after infection, CscalS12 was significantly upregulated in HLB-positive plants. These results indicate that CscalS12 is also likely involved in callose deposition after CLas infection. Because all callose synthase genes showed regulation of expression after CLas infection, it is possible that multiple CscalS work like a complex in the phloem sieve tubes, causing callose accumulation after pathogen attack (Granato et al., 2019Granato LM, Galdeano DM, Alessandre NR, Breton MC and Machado MA (2019) Callose synthase family genes plays an important role in the Citrus defense response to Candidatus Liberibacter asiaticus. Eur J Plant Pathol 155:25-38.).
Some genotypes studied in this work were classified by Boava et al. (2015)Boava LP, Sagawa CH, Cristofani-Yaly M and Machado MA (2015) Incidence of “Candidatus Liberibacter asiaticus”-infected plants among citrandarins as rootstock and scion under field conditions. Phytopathology 105:518-524. as tolerant or susceptible, based on the starch accumulation and titer of CLas. Genotypes 19, 119, 124, 217 and C. sunki were previously classified as susceptible, and our results showed upregulation of CscalS2, CscalS7 and CscalS11 expression and downregulation of CscalS5 and CscalS8 expression after CLas infection. Additionally, genotypes 66, 102 and P. trifoliata, classified by Boava et al. (2015)Boava LP, Sagawa CH, Cristofani-Yaly M and Machado MA (2015) Incidence of “Candidatus Liberibacter asiaticus”-infected plants among citrandarins as rootstock and scion under field conditions. Phytopathology 105:518-524. as tolerant, presented the same expression pattern of susceptible plants (19, 119, 124 and 217), except for CscalS2. Thus, making a connection between the expression values and level of tolerance or susceptibility is unlikely.
To find an association between the quantification of CscalS transcripts and allelic status of a genome region, we mapped the genomic regions associated with CscalS expression analysis in the linkage groups of C. sunki and P. trifoliata genetic maps. These genomic regions, referred to as eQTL, are important to understand the CLas-host plant interaction and mechanisms of tolerance and response to HLB.
It was possible to identify eQTL for CscalS2, CscalS7, CscalS8, CscalS9, and CscalS12 for both parents, although P. trifoliata is tolerant and does not exhibit callose deposition or starch accumulation after CLas infection (Boava et al., 2017Boava LP, Cristofani-Yaly M and Machado MA (2017) Physiologic anatomic and gene expression changes in Citrus sunki. Poncirus trifoliata and their hybrids after Liberibacter asiaticus infection. Phytopathology 107:590-599.). In contrast, no eQTL was found for CscalS11 due to the low variation of expression data among CLas-infected and healthy plants. Based on the estimation of the genetic parameters, CscalS11 presented low heritability, indicatings that the environment has great influence on this gene. Presumably, the regions that control the genetic variability for CscalS11 were not segregated in the study population, making it impossible to detect eQTL. The presence of important loci in homozygosity in both parents is a likely explanation for the absence of segregation for CscalS11.
Considering all eQTL mapped for the CscalS7 gene, they explained the highest percentage of the phenotype variation between CLas-infected and healthy plants. Thus, it is possible to state that CscalS7 is the most affected evaluated gene after CLas infection and is the most responsible for callose synthesis in the CLas-infected plants.
Other evaluated genes were also affected by CLas infection. eQTL were mapped for CscalS2, CscalS7, CscalS8, CscalS9, CscalS10, and CscalS12 in the C. sunki map and for CscalS2, CscalS5, CscalS7, CscalS8, CscalS9, and CscalS12 in the P. trifoliata map. In C. sunki, more than 44% of the eQTL observed were overlapped, characterizing hot spots. Thus, there are genomic regions that regulate the expression of more than one CscalS gene e.g., the main region on LG6 (200-203 cM) probably modulates CscalS8 and CscalS12 expression. In the P. trifoliata map, seven regions were considered hot spots and another 20 regions were mapped. Almost half of eQTL detected for CscalS2 and CscalS7 were overlapped. These regions and the other hot spots detected could probably be related to callose synthesis after CLas infection.
Apparently, both parents contribute to the response of the callose synthase gene expression because many eQTL were observed in the same chromosome for CscalS in both maps. Based only on the SNP markers, it is hard to establish a direct correlation between the maps. However, comparing the eQTL for CscalS, an important region was verified for P. trifoliata on chromosome 8 that could influence the expression of CscalS7 in plants affected by HLB.
The data sets obtained in this study revealed that it is not possible to determine whether the eQTL detected for CscalS in both maps represent the same genomic regions. Future studies should be considered to integrate the information from different materials.
Some eQTL can alter the expression of other genes located near them (cis-eQTL), explaining the variation of gene expression in the chromosomal region where the gene was found. On the other hand, other eQTL can regulate the expression of genes located distant from them (trans-eQTL), representing an effect of genetic polymorphisms that are located in other regions of the genome (Lima et al., 2018Lima RPM, Curtolo M, Merfa MV, Cristofani-Yaly M and Machado M (2018) QTLs and eQTLs mapping related to critrandarins resistance to citrus gummosis disease. BMC Genomics 19:516.). The position of calS was confirmed to be in the Citrus sinensis genome (http://citrus.hzau.edu.cn/orange/); however, some genes did not have a defined position on pseudochromosomes because CscalS9 and CscalS12 were grouped on UnChr. Thus, for some cases, it was appropriate to determine whether the eQTL identified altered expression of nearby transcripts (cis-eQTL) or remote transcripts (trans-eQTL), usually on different chromosomes. Four SNP markers from the P. trifoliata map associated with CscalS2, CscalS5 and CscalS7 were exclusively on the same chromosome as the genes, although they have been classified as trans-eQTL, because they are separated by more than 1 kb. Based on this investigation, we concluded that it is necessary to allocate CscalS9 and CscalS12 on the nine Citrus pseudochromosomes to make it possible to identify cis-eQTL. None of the SNP markers associated with CscalS expression was located on the region where the gene was found; therefore, probably all of the eQTL described in this study have an epistatic effect. The nonidentification of cis-eQTL could be due to two reasons for CscalS that has a physical position in the genome. First, the effect of some eQTL could be relatively low, hindering its mapping. Second, the polymorphism could be homozygous, causing possible variation in cis, such as promoters or enhancers (or other gene regulatory agents), with no segregation of the loci in the progeny.
Considering that CscalS9 and CscalS12 do not have known physical positions, this work warrants suggestions for future studies. Regions with eQTL can be considered as targets for other studies searching for regions where the CscalS genes can be located. Equally important, there is the possibility of identifying other genes that are related to CscalS functions. The identification of hot spots reinforces the idea that the eQTL detected in this study may be influencing the expression of CsCalS. Additionally, any gene physically located in a hotspot is a candidate, possibly explaining the studied process.
The gene expression and eQTL mapping results revealed that reprogramming occurs in callose synthesis in P. trifoliata as well as in C. sunki. However, there is evidence that P. trifoliata does not accumulate or accumulates much less callose than C. sunki (Boava et al., 2017Boava LP, Cristofani-Yaly M and Machado MA (2017) Physiologic anatomic and gene expression changes in Citrus sunki. Poncirus trifoliata and their hybrids after Liberibacter asiaticus infection. Phytopathology 107:590-599.). Thus, we believe that P. trifoliata has mechanisms that prevent callose deposition.
Conclusion
Despite the importance of eQTL mapping to provide a better understanding of the phenotypic variation (including those occurring during HLB), few related works exist in the literature. This study is the first to detect genomic regions associated with CscalS expression in plants infected with the causal agent of HLB disease.
The expression of all callose synthase genes was affected after CLas infection in the hybrid population studied. Thus, eQTL for CscalS2, CscalS7, CscalS8, CscalS9, CscalS10, and CscalS12 were mapped in the C. sunki map and eQTL for CscalS2, CscalS5, CscalS7, CscalS8, CscalS9 and CscalS12 were mapped in the P. trifoliata map. eQTL analysis indicated that multiple regions can contribute to CscalS expression regulation and some eQTL have an epistatic effect for more than one CscalS gene. An important region was also verified on linkage group 8 that could influence the expression of CscalS7 in plants affected by HLB.
The identification of hot spots reinforces the idea that eQTL identified in this study may influence the expression of CscalS. Additionally, any gene physically located in a hotspot is a candidate that can explain the studied process. This work suggests eQTL for CscalS related to HLB.
Acknowledgments
Funding was provided by the Instituto Nacional de Ciência e Tecnologia (INCT) de Genômica para Melhoramento de Citros (CNPq 88887136353/2017-0 and FAPESP 2014/50880-0), FAPESP 2018/00133-4. The authors Maiara Curtolo and Laís Moreira Granato are recipients of research fellowships FAPESP 2016/22133-0 and FAPESP 2019/01901-8, respectively.
References
- Albrecht U and Bowman KD (2012) Transcriptional response of susceptible and tolerant citrus to infection with Candidatus Liberibacter asiaticus. Plant Sci 185–186:118–130.
- Barratt DH, Kolling K, Graf A, Pike M, Calder G, Findlay K, Zeeman SC and Smith AM (2011) Callose synthase GSL7 is necessary for normal phloem transport and inflorescence growth in Arabidopsis Plant Physiol 155:328-341.
- Bertioli DJ, Ozias-Akins P, Chu Y, Dantas KM,S antos SP, Gouvea E, Guimarães PM, Leal-Bertioli SC, Knapp SJ and Moretzsohn MC (2014) The use of SNP markers for linkage mapping in diploid and tetraploid peanuts. G3 (Bethesda) 4:89-96.
- Boava LP, Sagawa CH, Cristofani-Yaly M and Machado MA (2015) Incidence of “Candidatus Liberibacter asiaticus”-infected plants among citrandarins as rootstock and scion under field conditions. Phytopathology 105:518-524.
- Boava LP, Cristofani-Yaly M and Machado MA (2017) Physiologic anatomic and gene expression changes in Citrus sunki. Poncirus trifoliata and their hybrids after Liberibacter asiaticus infection. Phytopathology 107:590-599.
- Bové JM (2006) Huanglongbing: a destructive newly-emerging century-old disease of citrus. J Plant Physiol Pathol 88:7-37.
- Castle WS, Tucker DPH, Krezdorn AH and Youtsey CO (1993) Rootstocks for Florida Citrus; rootstock selection -the first step to success. 2nd edition. University of Florida, Gainesville.
- Chang S, Puryear J and Cairney J (1993) A simple and efficient method for isolating RNA from pine trees. Plant Mol Biol R 11:113-116.
- Chen L and Storey JD (2006) Relaxed significance criteria for linkage analysis. Genetics 173:2371-2381.
- Chen CX, Bowman KD, Choi YA, Dang PM, Rao MN, Huang S, Soneji JR, McCollum TG and Gmitter FG (2008) EST-SSR genetic maps for Citrus sinensis and Poncirus trifoliata Tree Genet Genomes 4:1-10.
- Chen XY and Kim JY (2009) Callose synthesis in higher plants. Plant Signal Behav 4:489-492.
- Churchill GA and Doerge RW (1994) Empirical threshold values for quantitative trait mapping. Genetics 138:963-971.
- Colleta-Filho HD, Tagon MLPN, Takita MA, De Negri JD, Pompeu Júnior J, Carvalho AS and Machado MA (2004) First report of the causal agent of Huanglongbing (“Candidatus Liberibacter asiaticus”) in Brazil. Plant Dis 88:1382.
- Cui W and Lee JY (2006) Arabidopsis callose synthases CalS1/8 regulate plasmodesmal permeability during stress. Nat Plants 2:16034.
- Curtolo M, Cristofani-Yaly M, Gazaffi R, Takita MA, Figueira A and Machado MA (2017) QTL mapping for fruit quality in Citrus using DArTseq markers. BMC Genomics 18:289.
- Curtolo M, Soratto T, Gazaffi R, Takita MA, Cristofany-Yaly M and Machado MA (2018) High-density linkage maps for Citrus sunki and Poncirus trifoliata using DArTseq markers. Tree Genet Genomes 14:1.
- Dong X, Hong Z, Chatterjee J, Kim S and Verma DP (2008) Expression of callose synthase genes and its connection with Npr1 signaling pathway during pathogen infection. Planta 229:87-98.
- Ellinger D and Voigt CA (2014) Callose biosynthesis in Arabidopsis with a focus on pathogen response: what we have learned within the last decade. Ann Bot 114:1349-1358.
- Enns LC, Kanaoka MM, Torii KU, Comai L, Okada K and Cleland RE (2005) Two callose synthases GSL1 and GSL5 play an essential and redundant role in plant and pollen development and in fertility. Plant Mol Biol 58:333-349.
- Etxeberria E, Gonzalez P, Achor D and Albrigo G (2009) Anatomical distribution of abnormally high levels of starch in HLB-affected Valencia orange trees. Physiol Mol Plant Pathol 74:76-83.
- Folimonova SY, Robertson CJ, Garnsey SM, Gowda S and Dawson WO (2009) Examination of responses of different genotypes of citrus to Huanglongbing (citrus greening) under different conditions. Phytopathology 99:1346-1354.
- Gazaffi R, Margarido GRA, Pastina MM, Mollinari M and Garcia AAF (2014) A model for quantitative trait loci mapping linkage phase and segregation pattern estimation for a full-sib progeny. Tree Genet Genomes 10:791-801.
- Granato LM, Galdeano DM, Alessandre NR, Breton MC and Machado MA (2019) Callose synthase family genes plays an important role in the Citrus defense response to Candidatus Liberibacter asiaticus. Eur J Plant Pathol 155:25-38.
- Gómez-Gómez L, Felix G and Boller T (1999) A single locus determines sensitivity to bacterial flagellin in Arabidopsis thaliana Plant J 19:277-284.
- Gottwald T (2010) Current epidemiological understanding of Citrus huanglongbing. Annu Rev Phytopathol 48:119-139.
- Grattapaglia D and Sederoff R (1994) Genetic linkage maps of Eucalyptus grandis and Eucalyptus urophylla using a pseudo-testcross: mapping strategy and RAPD markers. Genetics 137:1121-1137.
- Guo F, Yu HW, Zheng T, Jiang XL, Wang L, Wang X, Xu Q and Deng X (2015) Construction of a SNP-based high-density genetic map for pumelo using RAD sequencing. Tree Genet Genomes 11:2.
- Hong Z, Delauney AJ and Verma DPS (2001) A cell plate–specific callose synthase and its interaction with phragmoplastin. Plant Cell 13:755-768.
- Huang M, Roose ML, Yu Q, Du D, Yu Y, Zhang Y, Deng Z, Stover E and Gmitter FG (2018) Construction of high-density genetic maps and detection of QTLs associated with Huanglongbing tolerance in citrus. Front Plant Sci 9:1694.
- Imai A, Yoshioka T and Hayashi T (2017) Quantitative trait locus (QTL) analysis of fruit-quality traits for mandarin breeding in Japan. Tree Genet Genomes 13:79.
- Jacobs AK, Lipka V, Burton RA, Panstruga R, Strizhov N, Schulze-Lefert P and Fincher GB (2003) An Arabidopsis callose synthase GSL5 is required for wound and papillary callose formation. Plant Cell 15:2503-2513.
- Jagoueix S, Bove JM and Garnier M (1994) The phloem-limited bacterium of greening disease of the proteobacteria is a member of the alpha subdivision of the Proteobacteria. Int J Syst Bacteriol 44:379-386.
- Koh EJ, Zhou L, Williams DS, Park J, Ding N, Duan YP and Kang BH (2012) Callose deposition in the phloem plasmodesmata and inhibition of phloem transport in citrus leaves infected with “Candidatus Liberibacter asiaticus”. Protoplasma 249:687-697.
- Lima RPM, Curtolo M, Merfa MV, Cristofani-Yaly M and Machado M (2018) QTLs and eQTLs mapping related to critrandarins resistance to citrus gummosis disease. BMC Genomics 19:516.
- Livak KJ and Schmittgen TD (2001) Analysis of relative gene expression data using real-time quantitative PCR and the 2(Delta Delta C(T)). Method 25:402-408.
- Lorch PD (2005) Sex differences in recombination and mapping adaptations. Genetica 123:39-47.
- Luna E, Pastor V, Robert J, Flors V, Mauch-Mani B and Ton J (2011) Callose deposition: a multifaceted plant defense response. Mol Plant Microbe Interact 24:183-193.
- Mafra V, Kubo KS, Alves-Ferreira M, Ribeiro-Alves M, Stuart RM, Boava LP, Rodrigues CM and Machado MA (2012) Reference genes for accurate transcript normalization in citrus genotypes under different experimental conditions. PLoS One 7:e31263.
- Margarido GRA, Souza AP and Garcia AAF (2007) OneMap software for genetic mapping in outcrossing species. Hereditas 144:78-79.
- Murray MG and Thompson WF (1980) Rapid isolation of high molecular weight plant DNA. Nucleic Acids Research 8:4321-4325.
- Nica AC and Emmanouil TD (2013) Expression quantitative trait loci: present and future. Philos Trans R Soc Lond B Biol Sci 368:20120362.
- Nishimura MT, Stein M, Hou BH, Vogel JP, Edwards H and Somerville SC (2003) Loss of a callose synthase results in salicylic acid-dependent disease resistance. Science 301:969-972.
- Ollitrault P, Terol J, Garcia-Lor A, Bérard A, Chauveau A, Froelicher Y, Belzile C, Morillon R, Navarro L, Brunel D et al (2012) SNP mining in C. clementina BAC end sequences; transferability in the Citrus genus (Rutaceae) phylogenetic inferences and perspectives for genetic mapping. BMC Genomics 13:13-16.
- Pang XM, Hu CG and Deng XX (2007) Phylogenetic relationships within Citrus and its related genera as inferred from AFLP markers. Genet Resour Crop Evol 54:429-436.
- Passos OS, Peixouto LS, Santos LC, Caldas RC and Soares Filho WS (2006) Caracterização de híbridos de Poncirus trifoliata e de outros porta-enxertos de citros no Estado da Bahia. Rev Bras Frutic 28:410-413.
- Porto BN, Magalhães PC, Campos NA, Alves JD and Magalhães MM (2010) Otimização de protocolos de extração de RNA em diferentes tecidos de milho. Rev Bras Milho Sorgo 9:189-200.
- Raman H, Raman R, Kilian A, Detering F, Carling J, Coombes N, Diffey S, Kadkol G, Edwards D, McCully M et al (2014) Genome-wide delineation of natural variation for pod shatter resistance in Brassica napus PLoS One 9:e101673.
- Schneider H (1968) Anatomy of greening-disease sweet orange shoots. Phytopathology 58:1155-1160.
- Shimada T, Fujii H, Endo T, Ueda T, Sugiyama A, Nakano M, Kita M, Yoshioka T, Shimizu T and Nesumi H (2014) Construction of a citrus framework genetic map anchored by 708 gene-based markers. Tree Genet Genomes 10:1001-1013.
- Souza LM, Gazaffi R, Mantello CC, Silva CC, Garcia D, Le Guen V, Cardoso SEA, Garcia AAF and Souza AP (2013) QTL mapping of growth-related traits in a full-sib family of rubber tree (Hevea brasiliensis) evaluated in a sub-tropical climate. PLoS One 8:e61238.
- Töller A, Brownfield L, Neu C, Twell D and Schulze-Lefert P (2008) Dual function of Arabidopsis glucan synthase-like genes GSL8 and GSL10 in male gametophyte development and plant growth. Plant J 54:911-923.
- Verma DPS and Hong Z (2001) Plant callose synthase complexes. Plant Mol Biol 47:693-701.
- Wang N and Trivedi P (2013) Citrus Huanglongbing: a newly relevant disease presents unprecedented challenges. Phytopathology 103:652-65.
- Wang N, Pierson EA, Setubal JC, Xu J, Levy JG, Zhang Y, Li J, Rangel LT and Martins Jr. J (2017) The Candidatus liberibacter-host interface: insights into pathogenesis mechanisms and disease control. Annu Rev Phytopathol 55:451-482.
- Wang X, Zhu M, Zhang Z and Hong Z (2011) CalS7 encodes a callose synthase responsible for callose deposition in the phloem. Plant J 65:1-14.
- Wu R, Ma CX, Painter I and Zeng ZB (2002) Simultaneous maximum likelihood estimation of linkage and linkage phases in outcrossing species. Theor Popul Biol 61:349-363.
- Xie B, Wang X, Zhu M, Zhang Z and Hong Z (2011) CalS7 encodes a callose synthase responsible for callose deposition in the phloem. Plant J 65:1-14.
- Xu Q, Chen LL, Ruan X, Chen D, Zhu A, Chen C, Bertrand D, Jiao B, Hao B, Lyon MP et al (2012) The draft genome of sweet orange (Citrus sinensis). Nat Genet 45:59-66.
- Yu Y, Chen C and Gmitter FG (2016a) QTL mapping of mandarin (Citrus reticulata) fruit characters using high-throughput SNP markers. Tree Genet Genome 12:77.
- Yu Y, Jiao L, Fu S, Yin L, Zhang Y and Lu J (2016b) Callose synthase family genes involved in the grapevine defense response to downy mildew disease. Phytopathology 106:56-64.
- Zeng Z (1994) Precision mapping of quantitative trait loci. Genetics 136:1457-1468.
Internet Resources
- BLASTn tool, https://blast.ncbi.nlm.nih.gov (accessed 28 May 2018).
» https://blast.ncbi.nlm.nih.gov - Citrus sinensis reference genome, http://citrus.hzau.edu.cn/ (accessed 28 May 2018).
» http://citrus.hzau.edu.cn/ - Clementine tangerine reference genome, https://www.phytozome.org (accessed 10 September 2017).
» https://www.phytozome.org - Fundecitrus, https://www.fundecitrus.com.br/ (accessed 30 April 2018).
» https://www.fundecitrus.com.br/ - MeV (MultiExperiment Viewer) program v. 4.9, http://sourceforge.net/projects/mev-tm4/ (accessed 25 June 2018)
» http://sourceforge.net/projects/mev-tm4/ - Miner software, http://ewindup.info/miner (accessed 15 May 2018).
» http://ewindup.info/miner - R software, https://www.r-project.org (accessed 15 May 2018).
» https://www.r-project.org
Supplementary material
The following online material is available for this article:
-
Associate Editor:
Marcio C. Silva-Filho
Publication Dates
-
Publication in this collection
15 June 2020 -
Date of issue
2020
History
-
Received
27 Apr 2019 -
Accepted
07 Jan 2020