ABSTRACT:
Objective:
To develop a social need index for stratification of municipalities and identification of priority areas for reducing fetal mortality.
Methods:
ecological study, carried out in the state of Pernambuco, between 2010 and 2017. The technique of factor analysis by main components was used for the elaboration of the social need index. In the spatial analysis, the local empirical Bayesian estimator was applied and Moran's spatial autocorrelation was verified.
Results:
The social deprivation index selected two factors that, together, explained 77.63% of the total variance. The preventable fetal mortality rate increased among strata of social need, with rates of 8.0 per thousand births (low deprivation), 8.1 per thousand (medium deprivation), 8.8 per thousand (high deprivation), and 10.7 per thousand (very high social deprivation). Some municipalities in the São Francisco and Sertão Mesoregions had both high fetal and preventable fetal mortality, in addition to a very high social deprivation rate. Conclusion: The spatial analysis identified areas with the highest risk for fetal mortality. The social deprivation index listed some determinants of fetal deaths in areas with worse living conditions. Priority areas for intervention in public policies to reduce fetal mortality and its determinants were detected.
Keywords:
Fetal mortality; Vital statistics; Spatial analysis; Social inequity
RESUMO:
Objetivo:
Elaborar um índice de carência social para a estratificação dos municípios e a identificação de áreas prioritárias para a redução da mortalidade fetal.
Métodos:
Estudo ecológico, realizado no estado de Pernambuco, entre 2010 e 2017. Utilizou-se a técnica de análise fatorial por componentes principais para a elaboração do índice de carência social. Na análise espacial, aplicou-se o estimador bayesiano empírico local, e verificou-se a autocorrelação espacial de Moran.
Resultados:
O índice de carência social selecionou dois fatores que, juntos, explicaram 77,63% da variância total. A taxa de mortalidade fetal evitável apresentou aumento entre estratos de carência social, com taxas de 8 por mil nascimentos (baixa carência), 8,1 por mil (média carência), 8,8 por mil (alta carência) e 10,7 por mil (muito alta carência social). Alguns municípios das mesorregiões São Francisco e Sertão tiveram, simultaneamente, elevada mortalidade fetal e fetal evitável, além de índice de carência social muito alto.
Conclusão:
A análise espacial identificou áreas com maior risco para a mortalidade fetal. O índice de carência social relacionou alguns determinantes das mortes fetais em áreas com piores condições de vida. Detectaram-se áreas prioritárias para a intervenção das políticas públicas de redução da mortalidade fetal e seus determinantes.
Palavras-chave:
Mortalidade fetal; Estatísticas vitais; Análise espacial; Iniquidade social
INTRODUCTION
Geographic areas with great social needs are responsible for a significant number of preventable fetal deaths in the world, particularly in Africa and Latin America11. Aminu M, Bar-Zeev S, White S, Mathai M, Broek NVD. Understanding cause of stillbirth: a prospective observational multi-country study from sub-Saharan Africa. BMC Pregnancy Childbirth 2019; 19(1): 470. https://doi.org/10.1186/s12884-019-2626-7
https://doi.org/10.1186/s12884-019-2626-...
. It is estimated that 2.6 million fetal deaths occur annually, mostly due to preventable causes22. Blencowe H, Cousens S, Jassir FB, Say L, Chou D, Mathers C, et al. National, regional, and worldwide estimates of stillbirth rates in 2015, with trends from 2000: a systematic analysis. Lancet 2016; 4(2): E98-108. https://doi.org/10.1016/S2214-109X(15)00275-2
https://doi.org/10.1016/S2214-109X(15)00...
. The Brazilian fetal mortality rate was 10.8 deaths per thousand births in 201533. Brasil. Ministério da Saúde. Departamento de Informática do SUS. [Internet]. Brasília: Ministério da Saúde; 2017 [accessed on Oct. 14, 2019]. Available at: http://www2.datasus.gov.br/DATASUS/index.php?area=0205
http://www2.datasus.gov.br/DATASUS/index...
. The Northeast had the highest rate among the regions of the country, with 13.2, while the state of Pernambuco had a rate of 12.08 per thousand births33. Brasil. Ministério da Saúde. Departamento de Informática do SUS. [Internet]. Brasília: Ministério da Saúde; 2017 [accessed on Oct. 14, 2019]. Available at: http://www2.datasus.gov.br/DATASUS/index.php?area=0205
http://www2.datasus.gov.br/DATASUS/index...
.
Fetal death is defined as the product of pregnancy that shows no sign of life after the expulsion or complete extraction from the maternal organism44. World Health Organization. Every Newborn: an action plan to end preventable deaths [Internet]. Genebra: WHO; 2014 [accessed on Mar. 10, 2020]. Available at: https://www.who.int/maternal_child_adolescent/documents/every-newborn-action-plan/en/
https://www.who.int/maternal_child_adole...
. Avoidable deaths are sentinel events, unnecessary and preventable events due to the proper functioning of health services with access to effective medical technologies55. Fouks Y, Tschemichovsky R, Greenberg A, Bak S, Sinai NB, Shinar S. Can we prevent stillbirth? Am J Perinatol 2020; 37(5): 534-42. https://doi.org/10.1055/s-0039-1683960
https://doi.org/10.1055/s-0039-1683960...
.
The elimination of preventable fetal mortality is part of the commitments made in the action plan for all newborns44. World Health Organization. Every Newborn: an action plan to end preventable deaths [Internet]. Genebra: WHO; 2014 [accessed on Mar. 10, 2020]. Available at: https://www.who.int/maternal_child_adolescent/documents/every-newborn-action-plan/en/
https://www.who.int/maternal_child_adole...
. This plan consists of a global movement to eliminate preventable fetal mortality and reduce regional disparities by 203566. Bernis L, Kinney MV, Stones W, Hoope-Bender P, Vivio D, Leisher SH, et al. Stillbirths: ending preventable deaths by 2030. Lancet 2016; 387(10019): 703-16. https://doi.org/10.1016/S0140-6736(15)00954-X
https://doi.org/10.1016/S0140-6736(15)00...
. To this end, it is necessary to face social needs and monitor them44. World Health Organization. Every Newborn: an action plan to end preventable deaths [Internet]. Genebra: WHO; 2014 [accessed on Mar. 10, 2020]. Available at: https://www.who.int/maternal_child_adolescent/documents/every-newborn-action-plan/en/
https://www.who.int/maternal_child_adole...
,66. Bernis L, Kinney MV, Stones W, Hoope-Bender P, Vivio D, Leisher SH, et al. Stillbirths: ending preventable deaths by 2030. Lancet 2016; 387(10019): 703-16. https://doi.org/10.1016/S0140-6736(15)00954-X
https://doi.org/10.1016/S0140-6736(15)00...
. High rates of preventable fetal mortality explain the inefficiency of intersectoral policies that promote housing, sanitation, education, work, and income conditions to guarantee quality of life and the right to reproductive planning, healthy pregnancy, and humanized childbirth for socially vulnerable women77. Bonfim CV, Silva APSC, Oliveira CM, Vilela MBR, Freire NCF. Spatial analysis of inequalities in fetal and infant mortality due to avoidable causes. Rev Bras Enferm 2020; 73(Supl. 4): e20190088. https://doi.org/10.1590/0034-7167-2019-0088
https://doi.org/10.1590/0034-7167-2019-0...
,88. Canuto IMB, Alves FAP, Oliveira CM, Frias PG, Macêdo VC, Bonfim CV. Intraurban differentials of perinatal mortality: modeling for identifying priority areas. Esc Anna Nery Rev Enferm 2019; 23(1): e20180166. https://doi.org/10.1590/2177-9465-EAN-2018-0166
https://doi.org/10.1590/2177-9465-EAN-20...
.
In epidemiological studies, the development of Social Deficiency Indices (Índices de Carência Social – ICS) show that indicators referring to poverty, inadequate water supply, lack of a sewage network, absence of own housing, and low education are linked to the risk of fetal death88. Canuto IMB, Alves FAP, Oliveira CM, Frias PG, Macêdo VC, Bonfim CV. Intraurban differentials of perinatal mortality: modeling for identifying priority areas. Esc Anna Nery Rev Enferm 2019; 23(1): e20180166. https://doi.org/10.1590/2177-9465-EAN-2018-0166
https://doi.org/10.1590/2177-9465-EAN-20...
,99. Loiacono KV. Evolution of fetal mortality in the setting of Argentine socioeconomic inequalities. Period 2007-2014. Arch Argent Pediatr 2018; 116(4): e567-74. https://doi.org/10.5546/aap.2018.eng.e567
https://doi.org/10.5546/aap.2018.eng.e56...
. To assess the relationship between socioeconomic conditions and public health problems, statistical models such as the Generalized Linear Models (GLM) have been used to model the mean of the response variable77. Bonfim CV, Silva APSC, Oliveira CM, Vilela MBR, Freire NCF. Spatial analysis of inequalities in fetal and infant mortality due to avoidable causes. Rev Bras Enferm 2020; 73(Supl. 4): e20190088. https://doi.org/10.1590/0034-7167-2019-0088
https://doi.org/10.1590/0034-7167-2019-0...
, however many phenomena require that the modeling of other distribution parameters be considered77. Bonfim CV, Silva APSC, Oliveira CM, Vilela MBR, Freire NCF. Spatial analysis of inequalities in fetal and infant mortality due to avoidable causes. Rev Bras Enferm 2020; 73(Supl. 4): e20190088. https://doi.org/10.1590/0034-7167-2019-0088
https://doi.org/10.1590/0034-7167-2019-0...
. Thus, the use of the framework for the Generalized Additive Models for Location, Scale and Shape (GAMLSS) stands out for allowing to model the response variable and to specify all its parameters as linear functions of a set of explanatory variables1010. Kessels R, Hoornweg A, Thanh Bui TK, Erreygers G. A distributional regression approach to income-related inequality of health in Australia. Int J Equity Health 2020; 19(1): 1-19. https://doi.org/10.1186/s12939-020-01189-1
https://doi.org/10.1186/s12939-020-01189...
,1111. Berger M, Schmid M. Flexible modeling of ratio outcomes in clinical and epidemiological research. Stat Methods Med Res 2020; 29(8): 2250-68. https://doi.org/10.1177/0962280219891195
https://doi.org/10.1177/0962280219891195...
.
Studies on social deprivation and fetal mortality can use spatial analysis techniques for visualization, exploratory analysis, and modeling of georeferenced data99. Loiacono KV. Evolution of fetal mortality in the setting of Argentine socioeconomic inequalities. Period 2007-2014. Arch Argent Pediatr 2018; 116(4): e567-74. https://doi.org/10.5546/aap.2018.eng.e567
https://doi.org/10.5546/aap.2018.eng.e56...
–1212. Grafova IB, Gusmano MK, Martirosyan K, Weisz D, Rodwin VG. Infant Mortality in Moscow: the Perils of Progress in Russia's world city. J Urban Health 2019; 96(6): 813-22. https://doi.org/10.1007/s11524-019-00375-z
https://doi.org/10.1007/s11524-019-00375...
. Such analysis makes it possible to identify the factors in the territory that hinder access to basic goods and services and favor the occurrence of preventable deaths88. Canuto IMB, Alves FAP, Oliveira CM, Frias PG, Macêdo VC, Bonfim CV. Intraurban differentials of perinatal mortality: modeling for identifying priority areas. Esc Anna Nery Rev Enferm 2019; 23(1): e20180166. https://doi.org/10.1590/2177-9465-EAN-2018-0166
https://doi.org/10.1590/2177-9465-EAN-20...
,1313. Nascimento SCS, Costa MCN, Braga JU, Natividade MS. Spatial patterns of preventable perinatal mortality in Salvador, Bahia, Brazil. Rev Saúde Pública 2017; 51: 73. https://doi.org/10.11606/s1518-8787.2017051007076
https://doi.org/10.11606/s1518-8787.2017...
.
In national studies, although the production is increasing on fetal mortality, there are still few studies developed in the Northeast Region88. Canuto IMB, Alves FAP, Oliveira CM, Frias PG, Macêdo VC, Bonfim CV. Intraurban differentials of perinatal mortality: modeling for identifying priority areas. Esc Anna Nery Rev Enferm 2019; 23(1): e20180166. https://doi.org/10.1590/2177-9465-EAN-2018-0166
https://doi.org/10.1590/2177-9465-EAN-20...
,1313. Nascimento SCS, Costa MCN, Braga JU, Natividade MS. Spatial patterns of preventable perinatal mortality in Salvador, Bahia, Brazil. Rev Saúde Pública 2017; 51: 73. https://doi.org/10.11606/s1518-8787.2017051007076
https://doi.org/10.11606/s1518-8787.2017...
. Hence the importance of analyses on the spatial distribution of preventable fetal mortality and its relationship with social deprivation in states like Pernambuco, which have a rate above the national average and inequalities expressed by epidemiological indicators and living conditions22. Blencowe H, Cousens S, Jassir FB, Say L, Chou D, Mathers C, et al. National, regional, and worldwide estimates of stillbirth rates in 2015, with trends from 2000: a systematic analysis. Lancet 2016; 4(2): E98-108. https://doi.org/10.1016/S2214-109X(15)00275-2
https://doi.org/10.1016/S2214-109X(15)00...
,77. Bonfim CV, Silva APSC, Oliveira CM, Vilela MBR, Freire NCF. Spatial analysis of inequalities in fetal and infant mortality due to avoidable causes. Rev Bras Enferm 2020; 73(Supl. 4): e20190088. https://doi.org/10.1590/0034-7167-2019-0088
https://doi.org/10.1590/0034-7167-2019-0...
. Such analyses may contribute to the development of public policies aimed at reducing health inequalities1313. Nascimento SCS, Costa MCN, Braga JU, Natividade MS. Spatial patterns of preventable perinatal mortality in Salvador, Bahia, Brazil. Rev Saúde Pública 2017; 51: 73. https://doi.org/10.11606/s1518-8787.2017051007076
https://doi.org/10.11606/s1518-8787.2017...
,1414. Adeyinka DA, Olakunde BO, Mahajarine N. Evidence of health inequity inchild survival: spatial and Bayesiannet work analyses of stillbirth ratesin 194 countries. Sci Rep 2019; 9: 19755. https://doi.org/10.1038/s41598-019-56326-w
https://doi.org/10.1038/s41598-019-56326...
.
Considering that composite indices are useful instruments to investigate health care inequalities and socioeconomic conditions88. Canuto IMB, Alves FAP, Oliveira CM, Frias PG, Macêdo VC, Bonfim CV. Intraurban differentials of perinatal mortality: modeling for identifying priority areas. Esc Anna Nery Rev Enferm 2019; 23(1): e20180166. https://doi.org/10.1590/2177-9465-EAN-2018-0166
https://doi.org/10.1590/2177-9465-EAN-20...
, this study aimed to develop an ICS for the stratification of municipalities and the identification of priority areas for the reduction of fetal mortality.
METHODS
An ecological study whose unit of analysis was the municipalities of Pernambuco, located in the Northeast Region of Brazil, was carried out. The state had 9,557,071 inhabitants in 20191515. Brasil. Ministério do Planejamento, Orçamento e Gestão. Instituto Brasileiro de Geografia e Estatística. Cidades e Estados. Pernambuco [Internet]. Rio de Janeiro: IBGE; 2019 [accessed on Mar. 15, 2020]. Available at: https://www.ibge.gov.br/cidades-e-estados/pe.html
https://www.ibge.gov.br/cidades-e-estado...
, distributed in five mesoregions: São Francisco (15 municipalities); Sertão (41); Agreste (71); Mata (43); and Metropolitan Region of Recife (15)1515. Brasil. Ministério do Planejamento, Orçamento e Gestão. Instituto Brasileiro de Geografia e Estatística. Cidades e Estados. Pernambuco [Internet]. Rio de Janeiro: IBGE; 2019 [accessed on Mar. 15, 2020]. Available at: https://www.ibge.gov.br/cidades-e-estados/pe.html
https://www.ibge.gov.br/cidades-e-estado...
.
The study included all fetal deaths (occurring after the 22nd complete week of gestation, or 154 days, or fetuses weighing 500 g or more or height from 25 cm) from mothers residing in the state of Pernambuco, from 2010 to 2017.
Deaths were considered preventable by the criteria of the Brazilian list of causes of preventable deaths (lista brasileira de causas de mortes evitáveis – LBE) due to interventions by the Unified Health System (Sistema Único de Saúde – SUS)1616. Malta DC, Sardinha LMV, Moura L, Lansky S, Leal MC, Szwarcwald CL, et al. Update of avoidable causes of deaths due to interventions at the Brazilian Health System. Epidemiol Serv Saúde 2010; 19(2): 173-6.. This list uses the categories: preventable, ill-defined causes, and other causes that are not clearly avoidable.
Data from the Mortality Information System (Sistema de Informação sobre Mortalidade – SIM) and the Live Birth Information System (Sistema de Informações sobre Nascidos Vivos – Sinasc) were used to calculate fetal mortality and preventable fetal mortality rates.
For the construction of the ICS, Pearson's correlation of 64 social indicators related to demography (13), education (10), sanitation (9), health (12), work (8), and vulnerability (12) with the preventable fetal mortality rate (Supplementary Material Chart 1). Indicators with p <0.05 remained in the process.
The indicators used in the elaboration of the ICS were: proportion of women heads of household, without complete elementary school, and with children under 15 years of age; dependency ratio; distortion rate of secondary education due to total administrative dependency (state, municipal, federal or private); proportion of the population with bathroom and running water; proportion of unemployed persons aged 18 years old or older; and proportion of the extremely poor and mean household income of those vulnerable to poverty (Table 2 of Supplementary Material).
Correlation matrix between the variables that make up the Social Deficiency Index. Recife (PE), Brazil, 2010–2017.
The Bartlett1717. Bartlett MS. The Effect of Standardization on a χ2 Approximation in Factor Analysis. Biometrika 1951; 38(3-4): 337-44. https://doi.org/10.1093/biomet/38.3-4.337
https://doi.org/10.1093/biomet/38.3-4.33...
sphericity test and the Kaiser-Meyer-Olkin test (KMO)1818. Kaiser HF. An Index of Factorial Simplicity. Psychometrika 1974; 39(1): 31-6. https://doi.org/10.1007/BF02291575
https://doi.org/10.1007/BF02291575...
were applied to identify whether the correlation matrix with the chosen indicators was statistically different from the identity matrix. The technique used in the construction of the ICS was the factor analysis by main components, which allows simplifying the data, reducing the number of indicators. These are called principal components or factors and are obtained using the linear combinations of the original indicators1919. Hastie T, Tibshirani R, Friedman J. The elements of statistical learning: data mining, inference, and prediction. 2. ed. Nova York: Springer Science & Business Media; 2009. 745 p.. The relationships between each original indicator and the new factors are measured according to the factor loads on the components.
The indicators used for the creation of the ICS were normalized by Equation 1:
The factors to be extracted were defined by means of the graphic of variance versus the number of components (scree plot), in which the points at the highest slope indicate the appropriate amount of components to be retained. The reliability of the factors was evaluated, and the index ≥ 0.50 was considered acceptable1717. Bartlett MS. The Effect of Standardization on a χ2 Approximation in Factor Analysis. Biometrika 1951; 38(3-4): 337-44. https://doi.org/10.1093/biomet/38.3-4.337
https://doi.org/10.1093/biomet/38.3-4.33...
.
After finding the acceptable factors, the index was normalized to the interval [0.1] by Equation 2:
To explain the relationship between the ICS and the preventable fetal mortality rate, the regression model was used for the Box-Cox T probability distribution2020. Rigby RA, Stasinopoulos MD, Heller GZ, De Bastiani F. Distributions for modeling location, scale, and shape: Using GAMLSS in R. Londres: CRC Press; 2019. 589 p., which obtained the lowest Akaike information criterion (AIC)2121. Sakamoto Y, Ishiguro M, Kitagawa G. Akaike Information Criterion Statistics. Heidelberg: D. Reidel Publishing Company; 1986. among the models tested by the regression analysis framework GAMLSS2222. Stasinopoulos MD, Rigby RA, Heller GZ, Voudouris V, De Bastiani F. Flexible regression and smoothing: using GAMLSS in R. Londres: CRC Press; 2017. (in which distributions were tested for strictly positive data). The Box-Cox T distribution2020. Rigby RA, Stasinopoulos MD, Heller GZ, De Bastiani F. Distributions for modeling location, scale, and shape: Using GAMLSS in R. Londres: CRC Press; 2019. 589 p. has the following parameters: μ (the median); σ (a term for variability); ν (asymmetry); and τ (kurtosis). The coefficient of variation was calculated, which can be approximated (for small σ, moderate ν, and moderate or large τ) by Equation 3:
We chose to use the original parameterization of the distribution2020. Rigby RA, Stasinopoulos MD, Heller GZ, De Bastiani F. Distributions for modeling location, scale, and shape: Using GAMLSS in R. Londres: CRC Press; 2019. 589 p., since the link function for the location parameter (which, in this case, is the median) is the identity function, which is easy to interpret.
The use of GAMLSS makes it possible to model all parameters of a probability distribution, since many phenomena do not present the assumptions of usual linear regression models, for example2222. Stasinopoulos MD, Rigby RA, Heller GZ, Voudouris V, De Bastiani F. Flexible regression and smoothing: using GAMLSS in R. Londres: CRC Press; 2017.. GAMLSS has a wide range of available probability distributions, being flexible for the analyses, which allows for rich interpretations and better performance in terms of adjustments2222. Stasinopoulos MD, Rigby RA, Heller GZ, Voudouris V, De Bastiani F. Flexible regression and smoothing: using GAMLSS in R. Londres: CRC Press; 2017..
To create the social need ranges, four clusters were generated using the k-means clustering technique to distinguish municipalities with similar indices. The number of clusters was obtained by the elbow graph, which resulted in the strata of social need: low (0–0.29), medium (0.29–0.49), high (0.49–0.77), and very high (0.77–1). The R programming language, version 3.6, and the GAMLSS2222. Stasinopoulos MD, Rigby RA, Heller GZ, Voudouris V, De Bastiani F. Flexible regression and smoothing: using GAMLSS in R. Londres: CRC Press; 2017. packages, version 5.1-5, were used for modeling, and FactoMineR2323. Lê S, Josse J, Husson F. FactoMineR: An R Package for Multivariate Analysis. J Stat Software 2008; 25(1): 1-18. https://doi.org/10.18637/jss.v025.i01
https://doi.org/10.18637/jss.v025.i01...
, version 2.0, for the composition of the ICS.
In the spatial analysis of the TerraView2424. Instituto Nacional de Pesquisas Espaciais (INPE). TerraLib and TerraView Wiki Page [Internet]. Brasil: INPE [accessed on Dec. 10, 2019]. Available at: http://www.dpi.inpe.br/terralib5/wiki/
http://www.dpi.inpe.br/terralib5/wiki/...
program, version 4.2.2, the municipalities were stratified by the ICS (low, medium, high, and very high) and by the rates of fetal mortality and preventable fetal mortality. For the spatial smoothing of these rates, the local empirical Bayesian method was applied, which, to calculate the estimate locally, uses the geographical neighbors of the area in which the rate is to be calculated, converging toward a local mean2525. Kang SY, Cramb SM, White NM, Ball SJ, Mengersen KJ. Making the most of spatial information in health: a tutorial in Bayesian disease mapping for areal data. Geospatial Health 2016; 11(2): 428. https://doi.org/10.4081/gh.2016.428
https://doi.org/10.4081/gh.2016.428...
.
The spatial autocorrelation of preventable fetal mortality rates and ICS was estimated by the Local Moran Index, a decomposition of the Global Moran Index2626. Luzardo JAR, Castañeda Filho RM, Rubim IB. Análise exploratória com o emprego do Índice de Moran. GEOgraphia 2017; 19(40): 161-79. https://doi.org/10.22409/GEOgraphia2017.v19i40.a13807
https://doi.org/10.22409/GEOgraphia2017....
. To compare the values of the attribute in an area with the mean of its neighbors, a two-dimensional graph was formed and divided into four quadrants identified in the Box Map: Q1 (high-high); Q2 (low-low); Q3 (high-low); and Q4 (low-high)2727. Lima KJ, Chaves CS, Gomes EO, Lima MA, Candeira ECP, Teófilo FKS, et al. Health situation analysis: fetal mortality in the 10th health region of Ceará. Rev Bras Prom Saúde 2017; 30(1): 30-7. https://doi.org/10.5020/18061230.2017.p30
https://doi.org/10.5020/18061230.2017.p3...
. The Moran Index ranges from −1 (inverse correlation) to +1 (direct correlation). Results close to zero demonstrate the absence of significant spatial autocorrelation in neighboring areas2626. Luzardo JAR, Castañeda Filho RM, Rubim IB. Análise exploratória com o emprego do Índice de Moran. GEOgraphia 2017; 19(40): 161-79. https://doi.org/10.22409/GEOgraphia2017.v19i40.a13807
https://doi.org/10.22409/GEOgraphia2017....
. In the Moran Map, the statistically significant areas (p > 0.05) were highlighted in each of the four quadrants of the Moran scattering diagram. The LISA Map made it possible to detect clusters with the significance of 95, 99 and 99.99%.
The study was approved by the Research Ethics Committee of the Health Sciences Center of Universidade Federal de Pernambuco on June 12th, 2018 (Certificate of Presentation of Ethical Appreciation — CAEE: 13981419.6.0000.5208).
RESULTS
There were 12,337 fetal deaths and, of these, 8,927 (72.35%) due to preventable causes, of which 4,314 (34.96%) were due to adequate care for women during pregnancy (Figure 1).

Classification of fetal deaths according to the Brazilian List of Avoidable Causes of Death. Pernambuco. 2010–2017.
The mean distortion rate of high school due to administrative dependence (27.30) was similar to the proportion of women heads of household, without complete elementary school and with children under 15 years of age (27.79). The average proportion of employed persons without income aged 18 or over (19.16) was similar to the proportion of extremely poor (19.63), but their different coefficients of variation, with 65.6 and 42.8%, respectively (Table 1 of Supplementary Material).
The Bartlett sphericity test (χ22. Blencowe H, Cousens S, Jassir FB, Say L, Chou D, Mathers C, et al. National, regional, and worldwide estimates of stillbirth rates in 2015, with trends from 2000: a systematic analysis. Lancet 2016; 4(2): E98-108. https://doi.org/10.1016/S2214-109X(15)00275-2
https://doi.org/10.1016/S2214-109X(15)00...
= 144.463; p <0.01) and the KMO coefficient (0.8) showed that the correlations between the items were adequate for the factor analysis, as well as the correlations between the indicators.
There was a high correlation between the dependency ratio and the proportion of extremely poor (0.79), as well as between the average household income of the vulnerable and poverty (-0.80). There was a high correlation between the proportion of extremely poor people and the variables proportion of the population in households with bathrooms and running water (-0.71) and the proportion of employed persons without income (0.81). The mean household income of those vulnerable to poverty has a high correlation with the proportion of the employed without income (-0.78) and the proportion of extremely poor (-0.97) (Table 1).
To evaluate the number of factors to be extracted, eigenvalues (> 1.5) and scree plots were used. Two factors together explained 77.63% of the total variance. The ICS was considered for the first principal component (PC1) and explained 63.58% of the total variance. Five variables showed a strong correlation (> |0.70|) with social deprivation, as indicated in PC1, with a factor load greater than 70%. PC2 represented the education dimension and explained 14.05% of the total variance (Table 2).
As for the model's estimates, the following results are true:
Where:
i = municipalities in the state of Pernambuco;
j = ICS social deprivation bands (low deprivation is the reference range).
The preventable fetal mortality rate increased among the social strata, with rates of 8 (low deprivation), 8.1 (medium deprivation), 8.8 (high deprivation) and 10.7 per thousand (very high social deprivation). There were 44 municipalities with low ICS, 66 with medium, 61 with high, and 13 municipalities with very high (Figure 2). The estimated regression model explains that, for each 0.1 point of ICS, the preventable fetal mortality rate has a median increase of 0.24.
In the spatial analysis, the fetal mortality rate was 12.1 per thousand births, and the preventable fetal mortality was 8.5 per thousand births. With the Bayesian analysis, the municipality of Moreilândia, located in the Sertão mesoregion, presented a higher rate of fetal mortality (55.10) (Figure 2B) and preventable fetal mortality (37.34) (Figure 2G).
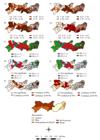
(A) Thematic map of the fetal mortality rate; (B) thematic map of the Bayesian fetal mortality rate; (C) Box Map of the Bayesian fetal mortality rate; (D) Moran Map of the Bayesian fetal mortality rate; (E) LISA Map of the Bayesian fetal mortality rate; (F) thematic map of the preventable fetal mortality rate; (G) thematic map of the Bayesian preventable fetal mortality rate; (H) Box Map of the Bayesian preventable fetal mortality rate; (I) Moran Map of the Bayesian preventable fetal mortality rate; (J) LISA Map of the Bayesian preventable fetal mortality rate. Pernambuco, 2010–2017.
As for the ICS, a higher rate was found in the municipality of Carnaubeira da Penha (São Francisco mesoregion) (Figure 3A). The Global Moran Index found significant spatial autocorrelation for the Bayesian fetal mortality rate (I = 0.10; p = 0.05), for the Bayesian preventable fetal mortality rate (I = 0.13; p = 0.03), and for the ICS (I = 0.53; p = 0.01).
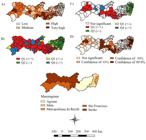
(A) Thematic map of the Social Deficiency Index; (B) Box Map of the Social Deficiency Index; (C) Moran Map of the Social Deficiency Index; (D) LISA Map of the Social Deficiency Index. Pernambuco, 2010–2017.
In the Box Map, priority clusters (Q1) were detected for Bayesian fetal mortality in the Mata, São Francisco and Sertão mesoregions (Figure 2C). For Bayesian preventable fetal mortality, Q1 clusters were seen in all mesoregions, except in Metropolitan Recife (Figure 2H). Q1 clusters were identified for the ICS, especially in the Agreste, São Francisco and Sertão mesoregions (Figure 3B).
In the Moran Map, priority areas (Q1) for Bayesian fetal mortality and preventable Bayesian fetal mortality were seen in the São Francisco and Sertão mesoregions (Figures 2D and 2I). The Q1 areas for the ICS were observed mainly in the Agreste, São Francisco and Sertão mesoregions (Figure 3C).
In the LISA Map, among the Q1 cluster, there was 99.9% confidence in the São Francisco mesoregion for Bayesian fetal mortality (Figure 2E), as well as in the São Francisco and Sertão mesoregions for Bayesian preventable fetal mortality (Figure 2J) and ICS (Figure 3D).
DISCUSSION
Fetal deaths occurred mainly due to preventable causes and weaknesses in care for women during pregnancy and childbirth. In the elaboration of the ICS, the variables referring to demography, education, sanitation, work, and vulnerability were associated with mortality. The preventable fetal mortality rate was higher among the strata with the greatest social need. High fetal and preventable fetal mortalities, in addition to very high ICS, occurred mainly in the São Francisco and Sertão mesoregions.
The fetal mortality rate in this study (12.1) was higher than the national mean in 2015, which was stable since 20102828. Barros PS, Aquino EC, Souza MR. Fetal mortality and the challenges for women's health care in Brazil. Rev Saúde Pública 2019; 53: 12. https://doi.org/10.11606/S1518-8787.2019053000714
https://doi.org/10.11606/S1518-8787.2019...
, a result similar to that found in the state of Ceará, with 12.6 deaths per thousand in 20122727. Lima KJ, Chaves CS, Gomes EO, Lima MA, Candeira ECP, Teófilo FKS, et al. Health situation analysis: fetal mortality in the 10th health region of Ceará. Rev Bras Prom Saúde 2017; 30(1): 30-7. https://doi.org/10.5020/18061230.2017.p30
https://doi.org/10.5020/18061230.2017.p3...
. Brazilian fetal mortality is heterogeneous in the regions of the country, with the highest rates located in states in the Northeast, due to its precarious socioeconomic conditions2828. Barros PS, Aquino EC, Souza MR. Fetal mortality and the challenges for women's health care in Brazil. Rev Saúde Pública 2019; 53: 12. https://doi.org/10.11606/S1518-8787.2019053000714
https://doi.org/10.11606/S1518-8787.2019...
.
In this study, preventable deaths predominated among fetal deaths. This finding shows weaknesses in the effectiveness of health systems. Analyses of preventable fetal deaths allow assessing the performance of prenatal and obstetric care services and contributing to understand the factors involved in their occurrence2929. Malta DC, Prado RR, Saltarelli RMF, Monteiro RA, Souza MFM, Almeida MF. Preventable deaths in childhood, according to actions of the Unified Health System, Brazil. Rev Bras Epidemiol 2019; 22: E190014. https://doi.org/10.1590/1980-549720190014
https://doi.org/10.1590/1980-54972019001...
. Monitoring this indicator makes it possible to compare the situation of maternal and child health actions in different periods and geographic spaces77. Bonfim CV, Silva APSC, Oliveira CM, Vilela MBR, Freire NCF. Spatial analysis of inequalities in fetal and infant mortality due to avoidable causes. Rev Bras Enferm 2020; 73(Supl. 4): e20190088. https://doi.org/10.1590/0034-7167-2019-0088
https://doi.org/10.1590/0034-7167-2019-0...
and is essential for the development of public policies aimed at reducing deaths1414. Adeyinka DA, Olakunde BO, Mahajarine N. Evidence of health inequity inchild survival: spatial and Bayesiannet work analyses of stillbirth ratesin 194 countries. Sci Rep 2019; 9: 19755. https://doi.org/10.1038/s41598-019-56326-w
https://doi.org/10.1038/s41598-019-56326...
,3030. Luque-Fernandez MA, Thomas A, Gelaye B, Racape J, Sanchez MJ, William MA. Secular trends in stillbirth by maternal socioeconomic status in Spain 2007-15: a population based study of 4 million births. Eur J Public Health 2019; 29(6): 1043-8. https://doi.org/10.1093/eurpub/ckz086
https://doi.org/10.1093/eurpub/ckz086...
.
Fetal deaths were shown to be reducible mainly by adequate care for women during pregnancy, although in a lower proportion than that found by another study3131. Garcia LP, Fernandes CM, Traebert J. Risk factors for neonatal death in the capital city with the lowest infant mortality rate in Brazil. J Pediatr (Rio J.) 2019; 95(2): 194-200. https://doi.org/10.1016/j.jped.2017.12.007
https://doi.org/10.1016/j.jped.2017.12.0...
. There is a consensus on the importance of adhering to prenatal care, minimum frequency of six consultations, clinical follow-up along with laboratory and imaging tests during pregnancy as strategies to prevent maternal, fetal, and infant deaths3232. Page JM, Thorsten V, Reddy UM, Dudley DJ, Hogue CJR, Saade GR, et al. Potentially preventable stillbirth in a diverse U.S. cohort. Obstet Gynecol 2018; 131(2): 336-43. https://doi.org/10.1097/AOG.0000000000002421
https://doi.org/10.1097/AOG.000000000000...
. Quality prenatal care acts in health promotion, prevention and early detection, and treatment of diseases3333. Monteiro MFV, Barbosa CP, Vertamatti MAF, Tavares MNA, Carvalho ACO, Alencar APA. Access to public health services and integral care for women during the puerperal gravid period period in Ceará, Brazil. BMC Health Serv Res 2019; 19(1): 851. https://doi.org/10.1186/s12913-019-4566-3
https://doi.org/10.1186/s12913-019-4566-...
,3434. Williams AD, Wallace M, Nobles C, Mendola P. Racial residential segregation and racial disparities in stillbirth in the United States. Health Place 2018; 51: 208-16. https://doi.org/10.1016/j.healthplace.2018.04.005
https://doi.org/10.1016/j.healthplace.20...
, however, according to a Brazilian study carried out in 2019, attendance lower than recommended persists, and less than 1/3 of pregnant women assisted in public health units did not perform laboratory tests in the first and third trimesters, or imaging tests during pregnancy3333. Monteiro MFV, Barbosa CP, Vertamatti MAF, Tavares MNA, Carvalho ACO, Alencar APA. Access to public health services and integral care for women during the puerperal gravid period period in Ceará, Brazil. BMC Health Serv Res 2019; 19(1): 851. https://doi.org/10.1186/s12913-019-4566-3
https://doi.org/10.1186/s12913-019-4566-...
. An expressive part of fetal antepartum deaths result from inappropriate prenatal care, with difficulty in accessing laboratory and imaging tests, making it impossible for maternal pathological conditions to be prevented, identified, monitored, and treated3535. Leal MC, Bittencourt SA, Esteves-Pereira AP, Ayres BVS, Silva LBRAA, Thomaz EBAF, et al. Progress in childbirth care in Brazil: preliminary results of two evaluation studies. Cad Saúde Pública 2019; 35(7): e00223018. https://doi.org/10.1590/0102-311x00223018
https://doi.org/10.1590/0102-311x0022301...
.
Another portion of fetal deaths, which occurred during childbirth, could be prevented by timely access to obstetric services and quality humanized care based on good practices and the best technical and scientific evidence3535. Leal MC, Bittencourt SA, Esteves-Pereira AP, Ayres BVS, Silva LBRAA, Thomaz EBAF, et al. Progress in childbirth care in Brazil: preliminary results of two evaluation studies. Cad Saúde Pública 2019; 35(7): e00223018. https://doi.org/10.1590/0102-311x00223018
https://doi.org/10.1590/0102-311x0022301...
,3636. Lima SS, Braga MC, Vanderlei LCM, Luna CF, Frias PG. Assessment of the impact of prenatal, childbirth, and neonatal care on avoidable neonatal deaths in Pernambuco State, Brazil: an adequacy study. Cad Saúde Pública 2020; 36(2): e00039719. https://doi.org/10.1590/0102-311X00039719
https://doi.org/10.1590/0102-311X0003971...
. Good practices during labor begin with access to health facilities with sufficient human and structural resources for adequate assistance, which avoids the parturient's pilgrimage in the hospital network3636. Lima SS, Braga MC, Vanderlei LCM, Luna CF, Frias PG. Assessment of the impact of prenatal, childbirth, and neonatal care on avoidable neonatal deaths in Pernambuco State, Brazil: an adequacy study. Cad Saúde Pública 2020; 36(2): e00039719. https://doi.org/10.1590/0102-311X00039719
https://doi.org/10.1590/0102-311X0003971...
,3737. Mosley WH, Chen LC. An analytic framework for the study of child survival in developing countries. Popul Dev Rev 1984; 10(Supl.): 25-45. https://doi.org/10.2307/2807954
https://doi.org/10.2307/2807954...
. They contemplate the reception of pregnant women, their entry into the health service and the performance of the multidisciplinary team, to guarantee women's right to obstetric care without unnecessary and sometimes iatrogenic medical interventions3636. Lima SS, Braga MC, Vanderlei LCM, Luna CF, Frias PG. Assessment of the impact of prenatal, childbirth, and neonatal care on avoidable neonatal deaths in Pernambuco State, Brazil: an adequacy study. Cad Saúde Pública 2020; 36(2): e00039719. https://doi.org/10.1590/0102-311X00039719
https://doi.org/10.1590/0102-311X0003971...
,3737. Mosley WH, Chen LC. An analytic framework for the study of child survival in developing countries. Popul Dev Rev 1984; 10(Supl.): 25-45. https://doi.org/10.2307/2807954
https://doi.org/10.2307/2807954...
.
In this study, the preventable fetal mortality rate, which is related to poor care for women during pregnancy and childbirth, increased as social deprivation increased. The technique of factor analysis by principal components was used in another study to develop the indices that pointed to social variables linked to fetal mortality99. Loiacono KV. Evolution of fetal mortality in the setting of Argentine socioeconomic inequalities. Period 2007-2014. Arch Argent Pediatr 2018; 116(4): e567-74. https://doi.org/10.5546/aap.2018.eng.e567
https://doi.org/10.5546/aap.2018.eng.e56...
. A survey carried out in Spain indicated that women with low schooling and coming from areas with a low human development index (HDI) had approximately four times the risk of fetal death3030. Luque-Fernandez MA, Thomas A, Gelaye B, Racape J, Sanchez MJ, William MA. Secular trends in stillbirth by maternal socioeconomic status in Spain 2007-15: a population based study of 4 million births. Eur J Public Health 2019; 29(6): 1043-8. https://doi.org/10.1093/eurpub/ckz086
https://doi.org/10.1093/eurpub/ckz086...
. As identified in this study, research carried out in Argentina showed a socioeconomic index associated with fetal mortality and composed of variables related to housing, sanitation, education, and work99. Loiacono KV. Evolution of fetal mortality in the setting of Argentine socioeconomic inequalities. Period 2007-2014. Arch Argent Pediatr 2018; 116(4): e567-74. https://doi.org/10.5546/aap.2018.eng.e567
https://doi.org/10.5546/aap.2018.eng.e56...
.
In the spatial analysis, the application of the Bayesian technique for the preventable fetal and fetal mortality rates allowed the stabilization of the rates between the nearby areas. An international survey that verified inequities in fetal health and survival found the importance of using Bayesian analysis in local smoothing and in identifying areas with the highest rates1414. Adeyinka DA, Olakunde BO, Mahajarine N. Evidence of health inequity inchild survival: spatial and Bayesiannet work analyses of stillbirth ratesin 194 countries. Sci Rep 2019; 9: 19755. https://doi.org/10.1038/s41598-019-56326-w
https://doi.org/10.1038/s41598-019-56326...
.
In the analysis of spatial autocorrelation, high priority clusters were verified for fetal mortality and social deprivation in the state of Pernambuco. These clusters were located in municipalities in the São Francisco and Sertão mesoregions, which showed priority for fetal mortality, preventable fetal mortality, and social deprivation. The municipalities in these regions also had low or medium municipal HDI3838. Programa das Nações Unidas para o Desenvolvimento, Instituto de Pesquisa Econômica Aplicada, Fundação João Pinheiro. Atlas do desenvolvimento humano no Brasil [Internet]. Rio de Brasília: PNUD; 2020 [accessed on Mar. 10, 2020]. Available at: http://atlasbrasil.org.br/
http://atlasbrasil.org.br/...
. This aspect reinforces the importance of intervention in intersectoral public policies that act on the basic needs of the population to guarantee the best living conditions and expand the possibilities of fetal survival3939. Callander EJ, Thomas J, Fox H, Ellwood D, Flenady V. What are the costs of stillbirth? Capturing the direct health care and macroeconomic costs in Australia. Birth (Berkeley, Calif.) 2020; 47(2): 183-90. https://doi.org/10.1111/birt.12469
https://doi.org/10.1111/birt.12469...
.
The spatial distribution of preventable fetal mortality and its relationship with the social deficiency found in this study made it possible to identify municipalities and health regions with greater social and health care needs. As observed in other studies, spatial analysis is able to guide the health sector in choosing priority areas for maternal and child care and health surveillance actions4040. Berman Y, Ibiebele I, Patterson JA, Randall D, Ford JB, Nippita T, et al. Rates of stillbirth by maternal region of birth and gestational age in New South Wales, Australia 2004-2015. ANZJOG 2020; 60(3): 425-32. https://doi.org/10.1111/ajo.13085
https://doi.org/10.1111/ajo.13085...
,4141. Teixeira LO, Belarmino V, Gonçalves CV, Mendoza-Sassi RA. Temporal trend and spatial distribution of congenital syphilis in the state of Rio Grande do Sul between 2001 and 2012. Ciênc Saúde Colet 2018; 23(8): 2587-97. https://doi.org/10.1590/1413-81232018238.25422016
https://doi.org/10.1590/1413-81232018238...
. The use of geoprocessing techniques allows to detect risk factors for death and causes of death in different population groups and to monitor the distribution of mortality rates in geographic spaces77. Bonfim CV, Silva APSC, Oliveira CM, Vilela MBR, Freire NCF. Spatial analysis of inequalities in fetal and infant mortality due to avoidable causes. Rev Bras Enferm 2020; 73(Supl. 4): e20190088. https://doi.org/10.1590/0034-7167-2019-0088
https://doi.org/10.1590/0034-7167-2019-0...
,99. Loiacono KV. Evolution of fetal mortality in the setting of Argentine socioeconomic inequalities. Period 2007-2014. Arch Argent Pediatr 2018; 116(4): e567-74. https://doi.org/10.5546/aap.2018.eng.e567
https://doi.org/10.5546/aap.2018.eng.e56...
.
The limitations of this study were related to the use of secondary data, with a possible underreporting of deaths and incompleteness of information systems, which can underestimate the rates presented, particularly in the most distant municipalities of the Metropolitan Region of Recife. Despite this, there are studies that show the level of adequacy of information in the state4242. Figueirôa BQ, Frias PG, Vanderlei LCM, Vidal SA, Carvalho PI, Pereira CCB, et al. Evaluation of the implantation of the Mortality Information System in Pernambuco state, Brazil, in 2012. Epidemiol Serv Saúde 2019; 28(1): e2018384. https://doi.org/10.5123/s1679-49742019000100013
https://doi.org/10.5123/s1679-4974201900...
. Another limitation was due to the use of LBE, which is not exclusive for fetal deaths, but includes neonatal deaths that present circumstances and etiologies similar to those of fetal deaths. As the units of analysis were municipalities, there may have been inequalities due to heterogeneous characteristics in population groups.
The results of the study showed that fetal deaths could have been prevented mainly by adequate care for women during pregnancy and childbirth. The ICS revealed that variables related to demography, education, sanitation, work, and vulnerability were associated with fetal mortality, and the preventable fetal mortality rate increased as social deprivation increased. Clusters of municipalities were identified with, simultaneously, the highest rates of fetal mortality and preventable fetal mortality, in addition to higher ICS. Such clusters were considered priority areas for the reduction of spatial inequalities in fetal mortality.
n the areas highlighted in this study, it is recommended to expand the coverage of the Family Health Strategy, the reorganization of the decentralized childbirth care network by regions of the state, a greater emphasis on obstetric care based on evidence and good practices, and the intensification of health surveillance for fetal death. The identification of the causes of death, the circumstances of the occurrence and the rectification of the basic causes allow the correct specification in the SIM and the appropriate framework in the avoidability classification. The strengthening of death surveillance and the improvement of vital statistics may favor the planning of actions for the organization of the maternal and child care network, particularly when deepening the theme through spatial analyses that identify the areas of greatest social vulnerability and priority for interventions.
-
Financial support: Coordenação de Aperfeiçoamento de Pessoal de Nível Superior – Brazil (CAPES), funding code 001.
REFERENCES
-
1Aminu M, Bar-Zeev S, White S, Mathai M, Broek NVD. Understanding cause of stillbirth: a prospective observational multi-country study from sub-Saharan Africa. BMC Pregnancy Childbirth 2019; 19(1): 470. https://doi.org/10.1186/s12884-019-2626-7
» https://doi.org/10.1186/s12884-019-2626-7 -
2Blencowe H, Cousens S, Jassir FB, Say L, Chou D, Mathers C, et al. National, regional, and worldwide estimates of stillbirth rates in 2015, with trends from 2000: a systematic analysis. Lancet 2016; 4(2): E98-108. https://doi.org/10.1016/S2214-109X(15)00275-2
» https://doi.org/10.1016/S2214-109X(15)00275-2 -
3Brasil. Ministério da Saúde. Departamento de Informática do SUS. [Internet]. Brasília: Ministério da Saúde; 2017 [accessed on Oct. 14, 2019]. Available at: http://www2.datasus.gov.br/DATASUS/index.php?area=0205
» http://www2.datasus.gov.br/DATASUS/index.php?area=0205 -
4World Health Organization. Every Newborn: an action plan to end preventable deaths [Internet]. Genebra: WHO; 2014 [accessed on Mar. 10, 2020]. Available at: https://www.who.int/maternal_child_adolescent/documents/every-newborn-action-plan/en/
» https://www.who.int/maternal_child_adolescent/documents/every-newborn-action-plan/en/ -
5Fouks Y, Tschemichovsky R, Greenberg A, Bak S, Sinai NB, Shinar S. Can we prevent stillbirth? Am J Perinatol 2020; 37(5): 534-42. https://doi.org/10.1055/s-0039-1683960
» https://doi.org/10.1055/s-0039-1683960 -
6Bernis L, Kinney MV, Stones W, Hoope-Bender P, Vivio D, Leisher SH, et al. Stillbirths: ending preventable deaths by 2030. Lancet 2016; 387(10019): 703-16. https://doi.org/10.1016/S0140-6736(15)00954-X
» https://doi.org/10.1016/S0140-6736(15)00954-X -
7Bonfim CV, Silva APSC, Oliveira CM, Vilela MBR, Freire NCF. Spatial analysis of inequalities in fetal and infant mortality due to avoidable causes. Rev Bras Enferm 2020; 73(Supl. 4): e20190088. https://doi.org/10.1590/0034-7167-2019-0088
» https://doi.org/10.1590/0034-7167-2019-0088 -
8Canuto IMB, Alves FAP, Oliveira CM, Frias PG, Macêdo VC, Bonfim CV. Intraurban differentials of perinatal mortality: modeling for identifying priority areas. Esc Anna Nery Rev Enferm 2019; 23(1): e20180166. https://doi.org/10.1590/2177-9465-EAN-2018-0166
» https://doi.org/10.1590/2177-9465-EAN-2018-0166 -
9Loiacono KV. Evolution of fetal mortality in the setting of Argentine socioeconomic inequalities. Period 2007-2014. Arch Argent Pediatr 2018; 116(4): e567-74. https://doi.org/10.5546/aap.2018.eng.e567
» https://doi.org/10.5546/aap.2018.eng.e567 -
10Kessels R, Hoornweg A, Thanh Bui TK, Erreygers G. A distributional regression approach to income-related inequality of health in Australia. Int J Equity Health 2020; 19(1): 1-19. https://doi.org/10.1186/s12939-020-01189-1
» https://doi.org/10.1186/s12939-020-01189-1 -
11Berger M, Schmid M. Flexible modeling of ratio outcomes in clinical and epidemiological research. Stat Methods Med Res 2020; 29(8): 2250-68. https://doi.org/10.1177/0962280219891195
» https://doi.org/10.1177/0962280219891195 -
12Grafova IB, Gusmano MK, Martirosyan K, Weisz D, Rodwin VG. Infant Mortality in Moscow: the Perils of Progress in Russia's world city. J Urban Health 2019; 96(6): 813-22. https://doi.org/10.1007/s11524-019-00375-z
» https://doi.org/10.1007/s11524-019-00375-z -
13Nascimento SCS, Costa MCN, Braga JU, Natividade MS. Spatial patterns of preventable perinatal mortality in Salvador, Bahia, Brazil. Rev Saúde Pública 2017; 51: 73. https://doi.org/10.11606/s1518-8787.2017051007076
» https://doi.org/10.11606/s1518-8787.2017051007076 -
14Adeyinka DA, Olakunde BO, Mahajarine N. Evidence of health inequity inchild survival: spatial and Bayesiannet work analyses of stillbirth ratesin 194 countries. Sci Rep 2019; 9: 19755. https://doi.org/10.1038/s41598-019-56326-w
» https://doi.org/10.1038/s41598-019-56326-w -
15Brasil. Ministério do Planejamento, Orçamento e Gestão. Instituto Brasileiro de Geografia e Estatística. Cidades e Estados. Pernambuco [Internet]. Rio de Janeiro: IBGE; 2019 [accessed on Mar. 15, 2020]. Available at: https://www.ibge.gov.br/cidades-e-estados/pe.html
» https://www.ibge.gov.br/cidades-e-estados/pe.html -
16Malta DC, Sardinha LMV, Moura L, Lansky S, Leal MC, Szwarcwald CL, et al. Update of avoidable causes of deaths due to interventions at the Brazilian Health System. Epidemiol Serv Saúde 2010; 19(2): 173-6.
-
17Bartlett MS. The Effect of Standardization on a χ2 Approximation in Factor Analysis. Biometrika 1951; 38(3-4): 337-44. https://doi.org/10.1093/biomet/38.3-4.337
» https://doi.org/10.1093/biomet/38.3-4.337 -
18Kaiser HF. An Index of Factorial Simplicity. Psychometrika 1974; 39(1): 31-6. https://doi.org/10.1007/BF02291575
» https://doi.org/10.1007/BF02291575 -
19Hastie T, Tibshirani R, Friedman J. The elements of statistical learning: data mining, inference, and prediction. 2. ed. Nova York: Springer Science & Business Media; 2009. 745 p.
-
20Rigby RA, Stasinopoulos MD, Heller GZ, De Bastiani F. Distributions for modeling location, scale, and shape: Using GAMLSS in R. Londres: CRC Press; 2019. 589 p.
-
21Sakamoto Y, Ishiguro M, Kitagawa G. Akaike Information Criterion Statistics. Heidelberg: D. Reidel Publishing Company; 1986.
-
22Stasinopoulos MD, Rigby RA, Heller GZ, Voudouris V, De Bastiani F. Flexible regression and smoothing: using GAMLSS in R. Londres: CRC Press; 2017.
-
23Lê S, Josse J, Husson F. FactoMineR: An R Package for Multivariate Analysis. J Stat Software 2008; 25(1): 1-18. https://doi.org/10.18637/jss.v025.i01
» https://doi.org/10.18637/jss.v025.i01 -
24Instituto Nacional de Pesquisas Espaciais (INPE). TerraLib and TerraView Wiki Page [Internet] Brasil: INPE [accessed on Dec. 10, 2019]. Available at: http://www.dpi.inpe.br/terralib5/wiki/
» http://www.dpi.inpe.br/terralib5/wiki/ -
25Kang SY, Cramb SM, White NM, Ball SJ, Mengersen KJ. Making the most of spatial information in health: a tutorial in Bayesian disease mapping for areal data. Geospatial Health 2016; 11(2): 428. https://doi.org/10.4081/gh.2016.428
» https://doi.org/10.4081/gh.2016.428 -
26Luzardo JAR, Castañeda Filho RM, Rubim IB. Análise exploratória com o emprego do Índice de Moran. GEOgraphia 2017; 19(40): 161-79. https://doi.org/10.22409/GEOgraphia2017.v19i40.a13807
» https://doi.org/10.22409/GEOgraphia2017.v19i40.a13807 -
27Lima KJ, Chaves CS, Gomes EO, Lima MA, Candeira ECP, Teófilo FKS, et al. Health situation analysis: fetal mortality in the 10th health region of Ceará. Rev Bras Prom Saúde 2017; 30(1): 30-7. https://doi.org/10.5020/18061230.2017.p30
» https://doi.org/10.5020/18061230.2017.p30 -
28Barros PS, Aquino EC, Souza MR. Fetal mortality and the challenges for women's health care in Brazil. Rev Saúde Pública 2019; 53: 12. https://doi.org/10.11606/S1518-8787.2019053000714
» https://doi.org/10.11606/S1518-8787.2019053000714 -
29Malta DC, Prado RR, Saltarelli RMF, Monteiro RA, Souza MFM, Almeida MF. Preventable deaths in childhood, according to actions of the Unified Health System, Brazil. Rev Bras Epidemiol 2019; 22: E190014. https://doi.org/10.1590/1980-549720190014
» https://doi.org/10.1590/1980-549720190014 -
30Luque-Fernandez MA, Thomas A, Gelaye B, Racape J, Sanchez MJ, William MA. Secular trends in stillbirth by maternal socioeconomic status in Spain 2007-15: a population based study of 4 million births. Eur J Public Health 2019; 29(6): 1043-8. https://doi.org/10.1093/eurpub/ckz086
» https://doi.org/10.1093/eurpub/ckz086 -
31Garcia LP, Fernandes CM, Traebert J. Risk factors for neonatal death in the capital city with the lowest infant mortality rate in Brazil. J Pediatr (Rio J.) 2019; 95(2): 194-200. https://doi.org/10.1016/j.jped.2017.12.007
» https://doi.org/10.1016/j.jped.2017.12.007 -
32Page JM, Thorsten V, Reddy UM, Dudley DJ, Hogue CJR, Saade GR, et al. Potentially preventable stillbirth in a diverse U.S. cohort. Obstet Gynecol 2018; 131(2): 336-43. https://doi.org/10.1097/AOG.0000000000002421
» https://doi.org/10.1097/AOG.0000000000002421 -
33Monteiro MFV, Barbosa CP, Vertamatti MAF, Tavares MNA, Carvalho ACO, Alencar APA. Access to public health services and integral care for women during the puerperal gravid period period in Ceará, Brazil. BMC Health Serv Res 2019; 19(1): 851. https://doi.org/10.1186/s12913-019-4566-3
» https://doi.org/10.1186/s12913-019-4566-3 -
34Williams AD, Wallace M, Nobles C, Mendola P. Racial residential segregation and racial disparities in stillbirth in the United States. Health Place 2018; 51: 208-16. https://doi.org/10.1016/j.healthplace.2018.04.005
» https://doi.org/10.1016/j.healthplace.2018.04.005 -
35Leal MC, Bittencourt SA, Esteves-Pereira AP, Ayres BVS, Silva LBRAA, Thomaz EBAF, et al. Progress in childbirth care in Brazil: preliminary results of two evaluation studies. Cad Saúde Pública 2019; 35(7): e00223018. https://doi.org/10.1590/0102-311x00223018
» https://doi.org/10.1590/0102-311x00223018 -
36Lima SS, Braga MC, Vanderlei LCM, Luna CF, Frias PG. Assessment of the impact of prenatal, childbirth, and neonatal care on avoidable neonatal deaths in Pernambuco State, Brazil: an adequacy study. Cad Saúde Pública 2020; 36(2): e00039719. https://doi.org/10.1590/0102-311X00039719
» https://doi.org/10.1590/0102-311X00039719 -
37Mosley WH, Chen LC. An analytic framework for the study of child survival in developing countries. Popul Dev Rev 1984; 10(Supl.): 25-45. https://doi.org/10.2307/2807954
» https://doi.org/10.2307/2807954 -
38Programa das Nações Unidas para o Desenvolvimento, Instituto de Pesquisa Econômica Aplicada, Fundação João Pinheiro. Atlas do desenvolvimento humano no Brasil [Internet] Rio de Brasília: PNUD; 2020 [accessed on Mar. 10, 2020]. Available at: http://atlasbrasil.org.br/
» http://atlasbrasil.org.br/ -
39Callander EJ, Thomas J, Fox H, Ellwood D, Flenady V. What are the costs of stillbirth? Capturing the direct health care and macroeconomic costs in Australia. Birth (Berkeley, Calif.) 2020; 47(2): 183-90. https://doi.org/10.1111/birt.12469
» https://doi.org/10.1111/birt.12469 -
40Berman Y, Ibiebele I, Patterson JA, Randall D, Ford JB, Nippita T, et al. Rates of stillbirth by maternal region of birth and gestational age in New South Wales, Australia 2004-2015. ANZJOG 2020; 60(3): 425-32. https://doi.org/10.1111/ajo.13085
» https://doi.org/10.1111/ajo.13085 -
41Teixeira LO, Belarmino V, Gonçalves CV, Mendoza-Sassi RA. Temporal trend and spatial distribution of congenital syphilis in the state of Rio Grande do Sul between 2001 and 2012. Ciênc Saúde Colet 2018; 23(8): 2587-97. https://doi.org/10.1590/1413-81232018238.25422016
» https://doi.org/10.1590/1413-81232018238.25422016 -
42Figueirôa BQ, Frias PG, Vanderlei LCM, Vidal SA, Carvalho PI, Pereira CCB, et al. Evaluation of the implantation of the Mortality Information System in Pernambuco state, Brazil, in 2012. Epidemiol Serv Saúde 2019; 28(1): e2018384. https://doi.org/10.5123/s1679-49742019000100013
» https://doi.org/10.5123/s1679-49742019000100013
Publication Dates
-
Publication in this collection
16 Apr 2021 -
Date of issue
2021
History
-
Received
24 Aug 2020 -
Reviewed
12 Nov 2020 -
Accepted
03 Dec 2020


