Abstract
An austenitic stainless steel ISO 5832-9 used as a biomaterial was torsion-deformed over the temperature range of 1000-1200 °C and strain rates of 0.05, 0.1, 1.0 and 5.0 s- 1. The flow stress curves obtained showed two regions where firstly there is a rising on stress characterized as work hardening mechanism acting and secondly a decreasing in work-softening after a peak stress. The flow curves were modeled by adjusting the experimental data with Zener-Hollomom parameter to construct the constitutive equations that describe the plastic behavior in both regions. The first region was described until the peak stress, taking into consideration the competition between work hardening and recovery while the second one was described applying the softening time of 50% and the Avrami equation. In some hot deformation conditions the simulated curves showed good agreement with the experimental ones while in others conditions the simulated showed differences to experimental curves that was discussed and associated with other mechanisms that acted during hot deformation.
flow stress curves; modeling of hot deformation; dynamic recristalization
Prediction of hot flow plastic curves of ISO 5832-9 steel used as orthopedic implants
Samuel Filgueiras RodriguesI, * * e-mail: samuel.filgueiras@ifma.edu.br ; Eden Santos SilvaII; Gedeon Silva ReisI; Regina Célia de SousaIII; Oscar BalancinIV
IDepartment of Mechanic and Materials, Federal Institute of Education, Science and Technology of Maranhão - IFMA, Av. Getúlio Vargas, 4, Monte Castelo, CEP 65030-005, São Luís, MA, Brazil
IIDepartment of Physics, Federal Institute of Education, Science and Technology of Maranhão - IFMA, Av. Getúlio Vargas, 4, Monte Castelo, CEP 65030-005, São Luís, MA, Brazil
IIIDepartment of Physics, Federal University of Maranhão - UFMA, Av. dos Portugueses, University City, 1966, Bacanga, CEP 65080-805, São Luís, MA, Brazil
IVDepartment of Materials Engineering, Federal University of São Carlos - UFSCar, Rod. Washington Luiz, Km 235, CEP 13565-905, São Carlos, SP, Brazil
ABSTRACT
An austenitic stainless steel ISO 5832-9 used as a biomaterial was torsion-deformed over the temperature range of 1000-1200 °C and strain rates of 0.05, 0.1, 1.0 and 5.0 s - 1. The flow stress curves obtained showed two regions where firstly there is a rising on stress characterized as work hardening mechanism acting and secondly a decreasing in work-softening after a peak stress. The flow curves were modeled by adjusting the experimental data with Zener-Hollomom parameter to construct the constitutive equations that describe the plastic behavior in both regions. The first region was described until the peak stress, taking into consideration the competition between work hardening and recovery while the second one was described applying the softening time of 50% and the Avrami equation. In some hot deformation conditions the simulated curves showed good agreement with the experimental ones while in others conditions the simulated showed differences to experimental curves that was discussed and associated with other mechanisms that acted during hot deformation.
Keywords: flow stress curves, modeling of hot deformation, dynamic recristalization
1. INTRODUCTION
Austenitic stainless steel with high nitrogen content, when compared with others stainless steels, presents increased mechanical strength and corrosion resistance, providing better performance in its use on the human body1. In 1992, the International Organization for Standardization specified the ISO 5832-9 fixing composition limits of 22Cr - 10.6 Ni - 2.4 Mo - Nb 0.42-0.37 N, describes the features and defines test methods to austenitic stainless steels with high nitrogen used in orthopedic implants. These steels combines high strength with localized corrosion, even in the annealed condition and are of relatively low cost2,3.
The hot deformation processing of metallic materials, held at high temperatures aims to control shape changing, but also achieving optimal mechanical properties. The material workability, determined by the strain rate, strain, temperature, material microstructure and the stress state imposed by the tool in the deformation zone, is composed of two contributions: one related to the processing stress state and other intrinsic to the material4,5. The workability intrinsic to the material is directly linked with the material initial microstructure and its responses to imposed deformation conditions, such as, stress and microstructure variation with the processing variables4. Thus, under certain conditions, the material can respond with microstructural damage due to flow or localized unstable, may subsequently, be reconstituted due to restoration processes.
The increase in the mechanical resistance during the heat processing of metallic materials is due to mechanisms that interfere in the movement of dislocations. Among them, it can mentioned the work hardening, precipitation and solid solution mechanism. Depending on the temperature and strain rate, these mechanisms may occur simultaneously or not. The knowledge and control about when these mechanisms occurs is extremely important in the development of thermomechanical processing schemes, whereas, their deformation depend on the amount of strain to be applied in a sequence of mechanical forming passes directly influencing the final properties to be obtained3,4.
During the hot deformation of metallic materials, mechanisms for hardening and softening occur concomitantly and concurrently. When the softening of the material occurs between intervals of strain deformation or after, the restoration mechanisms are called static and metadynamic. However, softening may occur during deformation, in this case the restoration mechanisms are called dynamic. These are five types of distinct mechanisms that operate during restoration, after or between deformation passes. Dynamic Recovery (DRV), Dinamic Recrystallization (DRX), Static Recovery (SRV), Static Recrystallization (SRX) and Metadynamic recrystallization (MDRX)3,5-8.
During the plastic deformation, the strength of the material increases due to the hardening phenomenon as a result of the increase in dislocation density. The evolution of the dislocation density (ρ) with deformation (ε), in the hardening regime, is controlled by the competition between the increase and annihilation of these dislocations, and can be represented mathematically by two independent terms as listed below:

where the first term represents the contribution of work hardening, and the second term represents the contribution of the dynamic recovery. Performing the appropriate calculations for the development of Equation 1, gives the Equation 29-13.

This equation describes the stress-strain (σ × ε) relationship for materials that soften by intense dynamic recovery mechanism in isothermal processing condition.
Steels with low and intermediate stacking fault energy (SFE), such as austenitic stainless steels, during high temperature deformation tend to soften by dynamic recrystallization (DRX) after reaching a certain deformation imposed. This level of deformation is known as the critical strain (εc) and corresponds to the minimum amount of work applied to initialize the dynamic recrystallization5. This value reflects the upper limit of energy that can be stored locally in these materials during hot deformation. Only reach this level of energy, though necessary, is not sufficient onset of the dynamic recrystallization, being required that the rate of energy dissipation reaches a critical value. Poliak and Jonas14,15 have shown that the critical state for the onset of dynamic recrystallization occurs when:

which correspond to an inflection point in the work hardening rate (θ=dσ/dε) vs. applied stress (σ) diagram.
Soon the critical deformation is reached, the dynamic recrystallization begins with nucleation and growth of new grains free of strain16,17, with the increasing of strain, the recrystallized volume fraction increases, softening the material and reducing its mechanical strength. Considering that the decrease in stress with strain is due to dynamic recrystallization, the stress evolution with continued dynamic recrystallization can be represented by Equation 4.

where Xs represents the softened fraction, σsat the saturation stress, when occurs dynamic recovery only, and σss the steady state stress at completion dynamic recrystallization.
Assuming that the softened fraction is equal to recrystallized fraction and is described by the Avrami equation, Xs can be expressed as18:

where K is the Avrami constant, N is the Avrami exponent associated with the nucleation and expressed as a power law with the Zenner-Hollomon parameter (Z), and t0.5 represents the time required to obtain 50% of the dynamically recrystallized fraction.

where, q and A are constants characteristic of each material associated with the deformation conditions, R the universal gas constant, T is the absolute temperature and QDRX is the activation energy for dynamic recrystallization.
2. MATERIAL AND EXPERIMENTAL PROCEDURES
The steel used in this work was the austenitic stainless steel ISO 5832-9 The chemical composition of the material by weight is shown in Table 1.
Cylindrical specimens with 8 mm of effective diameter and 12 mm of effective length were machined out of hot rolled bars. Mechanical test were carried out on a computerized hot torsion machine. The samples were heated in a furnace by infrared radiation with a maximum power of 6 kW, mounted directly on the testing machine. The measurement and control of temperatures were made by using a Chromel-alumel thermocouple fixed in holes drilled near the useful sample part. The instantaneous torque and rotation angle were read and recorded during testing by specific software interfaced to torsion test machine that imposes parametric tests such as temperature, holding time, limit of strain and strain rate.
Hot torsion tests were carried out over temperature range of 1000-1200 °C at equivalent strain rates of 0.05, 0.1, 1.0 and 5.0 s - 1. The samples were heated up from room temperature to 1200 °C with a rate of 2 °C/s where they were held for 5 minutes and then cooled down to deformation temperature and held for 30 seconds before being deformed. All tests were performed to strain of 3.5 or until the sample fail. The equivalent stress, σeq, and equivalent plastic deformation εeq were obtained by followed expressions19.

where M is the torque, R is the radius of the sample, m and n are sensitivity coefficients of the material to strain rate and work hardening, respectively, θ is the rotation angle and L is the specimen effective length.
Some characteristic values of stress and strain are well-defined points in the flow plastic curves and can be read directly from the experimental curves, others, as critical stress for the onset of dynamic recrystallization (σc) and saturation stress (σss) need to be obtained from analytical calculations. The procedure proposed by Jonas at all was used to determine these points19.
3. EXPERIMENTAL RESULTS AND DISCUSSIONS
3.1. Plastic flow curves
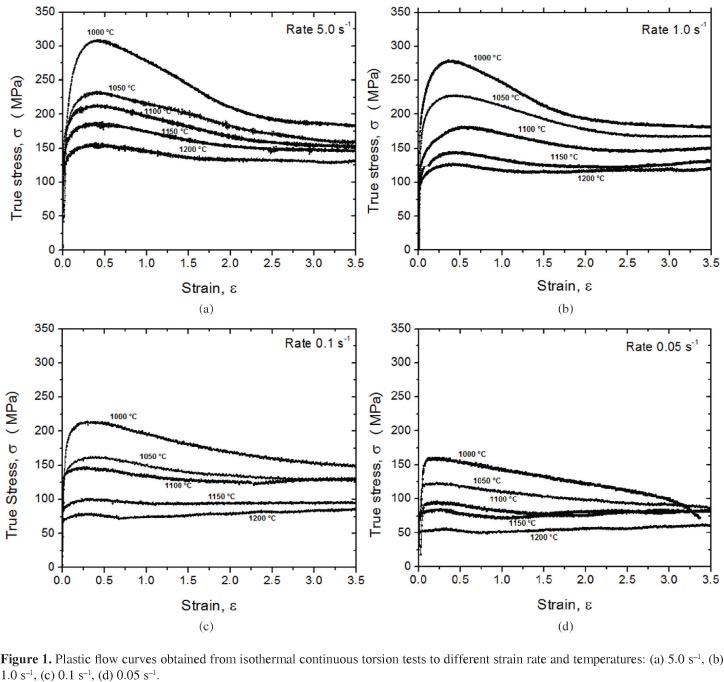
The plastic flow curves obtained from hot torsion tests are displayed in Figure 1. It is observed in the plastic flow curves shown, that at the beginning there is a region of increasing in plastic flow stress resulting from work hardening mechanism acting, presenting a change in curvature as the material is deformed. With continued deformation, the stress reaches a maximum value that corresponds to the peak stress. Finally, after a certain strain, the stress reaches a steady state.
The stress level decreases with the decreasing of strain rate and increasing with temperatures. However, the evolution of deformation with thermomechanical treatment condition has distinct behaviors. It is noted that curves at higher temperatures, have the hardening region shifted more to the right and, at lower temperatures the maximum stress tends to occur in smaller strain. At the 1000 °C, the samples did not reach the steady state until the imposed deformation during the experimental tests and specifically, at 1000 °C with 0.05 s - 1, the sample failed before the maximum imposed strain (ε = 3.5), also is worth noting that at this temperature, there is a relatively high drop in tension level in the softening region as the same at high strain rates.
In all experiments conducted at higher temperatures, the steady state stress was reached. Despite of some minor differences in the shape of the curves, the softening behavior is characteristic dynamic recrystallization.
The shape of the plastic flow curves changes depending on the thermomechanical treatments conditions applied, these changes have been more visible in the dynamic softening region after the peak stress with three types of curves: (i) curves at high temperature and low strain rate anticipating steady state for smaller strains, (ii) curves at low temperature and high strain rate with continuous softening and localized flow and (iii) curves at low strain rate and intermediate temperature flat type, where there is not large variation with the deformation.
3.2. Constitutive equations for peak stress (αp)
One can observe in Figure 1 that the stress level depends on the deformation condition: temperature and strain rate. Taking into account that the peak stress is a representative point of the material behavior, it can be seen that the peak stress (σp) increases when the temperature decrease and the strain rate increase. The Garofalo equation, first used for creep and modified by Sellars and Tegart20 for hot working, represents well the relationship between deformation conditions and the necessary stress for material deformation, represented by followed expression.
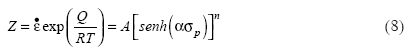
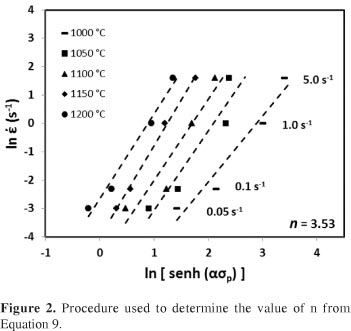
where  is the strain rate, Q is the apparent activation energy for deformation, R is the gases universal constant, T is the absolute temperature, Z is the Zener-Hollomom parameter, A, α and n are material constants. The constants of this equation were determined applying the method proposed by Uvira and Jonas21. A computational procedure was used to determine α value that better fit this equation. This value is attained from substitution the experimental data for and αp for each one temperature in this equation. With linear regression the n values were determined varying α in the range between 0.002 to 0.052 with step of 0.001. Plotting the standard deviation of n as a function of α for each one temperature and strain rate it was possible to see that there is a small range of α values that not depends on the temperature. The α value which presented the smallest standard deviation in all temperatures and strain rate was 0.01313.
Figure 2 shows that strain rate has the same effect on peak stress at each one temperature and the slope of this curve, Equation 9, is equal to n, the stress exponent of Equation 8: its average value being n = 3.54. This value is associated with the deformation mechanism that takes place during hot deformation; literature has reported values between 3.6 < n < 6.022 for dislocation climb.

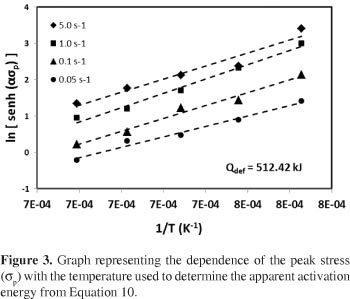
To determination of apparent activation energy (Q), it was made same manipulation on Equation 8 until to reach Equation 10 where is shown that Q can be determined from the slope of the curve  vs. 1/T shown in Figure 3. In the present work Q was measured as 512.42 KJ/mol.

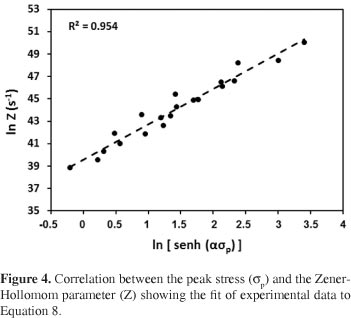
Thought the graph ln(Z) vs.  shown in Figure 4, it was performed a multiple linear regression analysis considering
  to find A value that was equal to 1.1783 × 10¹⁶ s - 1. The fit of experimental data to Equation 8 is displayed in Figure 4, which indicates that the values are appropriated for the procedure used and the Equation 8 becomes into the followed expressions.

3.3. Determination of softened fraction and Avrami exponent
According to Equation 4, the softened fraction at any time in the dynamic recrystallization process (Xs), is described as the ratio between the difference of dynamic recovery and recrystallization stresses at that time and the steady state. Following the step above, it was determined the evolution of softened fraction (XS) in function of the time. The results are shown in Figure 5.
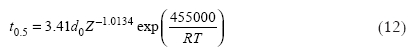
The values determined for apparent activation energy for dynamic recrystallization and q from Equation 6 were, QDRX = 455 KJ/mol and q = - 1.0134, such it become as the followed expression.
Plots of log [ln(1/(1-Xs))] vs. log t were used to determine the Avrami exponent. Table 2 shows the values of N for each imposed deformation condition on the material. These values are greater than that found for static and dynamic recrystallization for 316 L and 304 stainless steel respectively13,23. For small values of the Avrami exponent, n~1, the nucleation occurs preferentially on the grains surface and twins, for intermediate values, n~2, nucleation occurs more intensively in grains borders, to higher values, n~3, and the nucleation occurs primarily at grains vertices.
3.4. Parameterization of the plastic flow curves
Figure 6 suggest that the dependence of all parameters from Equations 2 and 5 on the deformation condition, Zener-Hollomon parameter, can be described by a single equation of the followed type:

Table 3 shows the parameters equation applied in Equations 2 and 5 to predicting the flow curves behavior at the thermomechanical treatment imposed on ISO 5832-9 austenitic stainless steel.
3.5. Comparison between modeling and experimental flow curves
The evolution equation for the flow curves behavior was solved for each thermomechanical treatment imposed on the material, each Z value, and compared with the original experimental data.
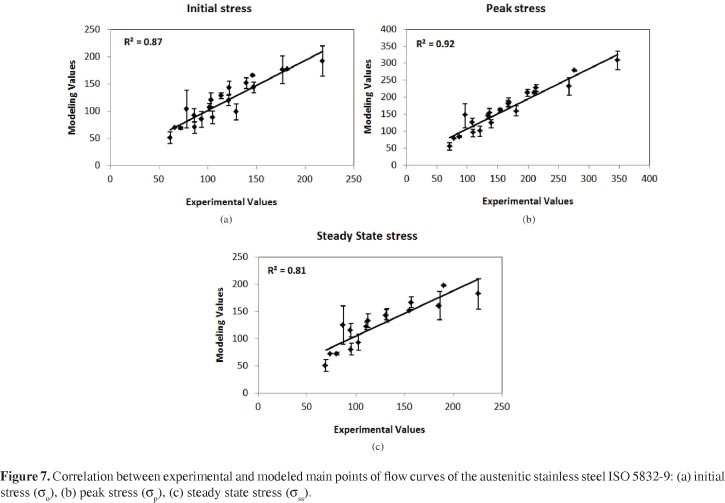
Making a comparison between the modeling and experimental results for the main stress points according to Equation 2 and 4, Figure 7 shows that the average and maximum standard deviation between modeling and experimental values were: for initial stress (σ0), average 8.7 and maximum 21.4 MPa, peak stress (σp), average 11.7 and maximum 35 MPa and for steady state stress (σss), average 11.4 and maximum 30.7 MPa. For initial peak stress the maximum difference occurred for the experiment carried out at 1000 °C with strain rate of 0.05 s - 1 while maximum differences for peak and steady state stresses occurred for the experiments carried out at 1100 °C with strain rate of 0.1 s - 1 and at 1000 °C with strain rate of 5.0 s - 1 respectively. Figure 7 still shows a good agreement between modeling and experimental values for main points of flow curves according to Equation 2 and 4.
Figure 8 shows experimental and simulated curves together, solid and dashed respectively. In Figure 8 is observed that there is a reasonable agreement between the modeled and experimental data. However, some differences are observed. This fact is clearly visible at the curves with rate of 0.05 s - 1 and the curves carried out at 1000 and 1050 °C with strain rate of 5.0 s - 1 where the modeled are overestimated compared to experimental curves. At highest strain rate (5.0 s - 1) and temperatures between 1000 and 1050 °C, strain rate of 1.0 s - 1 and temperatures between 1000 and 1100 °C, strain rate of 0.05 s - 1 and temperature of 1000 °C there is a lower dynamic recovery rate of the modeled curves compered to experimental, for instance, an underestimation value of r and also a relative displacement to the left side of the modeled in relation of the experimental indicating higher work hardening.
In relation of dynamic recrystallization kinetics, after the peak stress considered the second region of the stress vs. strain curves, note that for low values of the Avrami exponent (N), there is a delay in the dynamic recrystallization process also contributing to time delay for 50% of softening (t0.5). The major differences are in: strain rate of 5.0 s - 1 with temperatures of 1000 and 1050 °C, strain rate of 0.1 s - 1 with temperature of 1000 °C and the strain rate of 0.05 s - 1 with temperatures between 1000 and 1050 °C.
Bearing in mind that the stacking fault energy (SFE) influences dislocation climb and cross slip and the austenitic stainless steels are considered as a material having low and intermediate SFE level that is influenced by chemical composition, the calculated SFE for ISO 5832-9 was found to be (68.7 mJ/m2)24. This considered intermediate level of SFE has promoting high levels of dynamic recovery that has affected the shape of flow stress curves before the onset of dynamic recrystallization, and observed microstructure evaluation showed the softening by combination of dynamic recovery and recrystallization dependent on each imposed deformation conditions25. It also has been observed localized flow for this material26.
It is necessary to bear in mind that all values for the parameter were determined experimentally to be applied in the constitutive, evolutive and empirical equations. Therefore, each value of the main flow curves points fitted determined by these equation represents an average for each deformation condition. Otherwise, some differences in levels of stresses between modeling and experimental can be speculated from mathematic method that is necessary more investigation to find the cause of these deviations.
4. CONCLUSIONS
The method used to modeling flow curves for ISO 5832-9 austenitic stainless steel showed a reasonable agreement between modeled and experimental suggesting softening promoted by dynamic recovery and recrystallization after work hardening acting during hot deformation. Standard deviation for the main stress points according to used equation is considered not too high when compered modeling and experimental flow curves.
The first region of the modeled curves by constitutive equations, shows that thermally activated mechanisms such as, work hardening, possible presence of precipitates and intermediate SFE, delay the softening especially for low strain rates where its parameters are the competition between the work hardening and dynamic recovery DRV.
On the second region of the curves, the dynamic recrystallization is controlled by the time to 50% of softening (t0,5) and through Avrami exponent (N), which showed values from 0.65 to 2.94 being dependent on the hot deformation conditions associated with nucleation sites existing in the material. This region after the peak stress, presents tensions until the steady state promoted by dynamic softening with strong evidence of recovery in experimental curves still associated with intermediate SFE.
ACKNOWLEDGMENTS
The financial support of the Federal Institute of Education, Science and Technology of Maranhão (IFMA) and CAPES is gratefully acknowledged.
Received: May 21, 2013;
Revised: November 7, 2013
- 1. Giordani EJ, Guimarães VA, Pinto TB and Ferreira I. Effect of precipitates on the corrosion-fatigue crack initiation of ISO 5832-9 stainless steel biomaterial. International Journal of Fatigue 2004; 26:1129-1136. http://dx.doi.org/10.1016/j.ijfatigue.2004.03.002
- 2. Stein G and Menezel J. Nitrogen alloyed steels- a new generation of materials with extraordinary properties. International Journal of Materials and Products Technology 1995; 10(3-6):290-302.
- 3. McQueen HJ and Jonas JJ. Recovery and recrystallization during high temperature deformation. In: Arsenaut RJ, editor. Treatise on Materials Science and Technology London: Academic Press; 1976. 394 p.
- 4. Ahlblom B and Sandstro M. Hot workability of stainless steels: influence of deformation parameters, microstructural components, and restoration processes. International Materials Reviews 1982; 27(1):1-27. http://dx.doi.org/10.1179/095066082790324441
- 5. McQueen HJ. Development of dynamic recrystallization theory. Materials Science & Engineering: A. 2003; 387-389:203-208. http://dx.doi.org/10.1016/j.msea.2004.01.064
- 6. Cahn RW. Recovery and Recrystallization. In: Cahn RW and Haasen p, editors. Physical Metallurgy Wiley; 1965. p. 925.
- 7. McQueen HJ, Yue S, Ryan ND and Fly E. Hot Working Characteristics of steels In Austenitic State. Journal of Materials Processing Technology 1995; 53:293-310. http://dx.doi.org/10.1016/0924-0136(95)01987-P
- 8. Ryan ND and McQueen HJ. Flow stress, dynamic restoration, strain hardening and ductility in hot working of 316 steel. Journal of Materials Processing Technology 1990; 21(2):177-199. http://dx.doi.org/10.1016/0924-0136(90)90005-F
- 9. Laasraoui A and Jonas JJ. Prediction of Steel Flow Stresses at high Temperatures and Strain Rates. Metallurgical Transactions A 1991; 22(7):1545-1558. http://dx.doi.org/10.1007/BF02667368
- 10. Jonas JJ and Luton MF. Flow Softening at Elevated Temperatures. In: Burke JJ and Weiss V, editors. Advantages in Deformation Processing. Springer; 1978. p. 215-243. http://dx.doi.org/10.1007/978-1-4613-4024-9_7
- 11. Estrin Y and Mecking H. A unified phenomenological description of work hardening and creep based on one-parameter models. Acta Metallurgica 1984; 32(1):57-70. http://dx.doi.org/10.1016/0001-6160(84)90202-5
- 12. Kocks UF and Mecking H. Physics and phenomenology of strain hardening: the FCC case. Materials Science. 2003; 48:171-273.
- 13. Jorge AM Jr and Balancin O. Prediction of steel flow stresses under hot working conditions. Materials Research 2005; 8(3):309-315.
- 14. Poliak EI and Jonas JJ. A One-parameter approach to determining the critical conditions for the initiation of dymanic recrystallization. Acta Materialia 1995; 44(1):127-136. http://dx.doi.org/10.1016/1359-6454(95)00146-7
- 15. Poliak EI and Jonas JJ. Initiation of dynamic recrystallization in constant strain rate hot deformation. ISIJ International 2003; 43(5):684-691. http://dx.doi.org/10.2355/isijinternational.43.684
- 16. Ponge D and Gottstein G. Necklace formation during recrystallization Mechanisms and Impact on Flow Behavior. Acta Materialia. 1998; 46(1):69-80. http://dx.doi.org/10.1016/S1359-6454(97)00233-4
- 17. Sakai T and Jonas JJ. Dynamic Recrystallization: Mechanical and Microstructural Consideration. Acta Metallurgica 1984; 32:198-209. http://dx.doi.org/10.1016/0001-6160(84)90049-X
- 18. Jonas JJ, Quelennec X, Jiang L and Martin E. The Avrami kinetics of dynamic recrystallization. Acta Materialia. 2009; 57:2748-2756. http://dx.doi.org/10.1016/j.actamat.2009.02.033
- 19. Fields DS and Backofen WA. Determination of strain hardening characteristics by torsion testing. Proceedings American Society for Testing and Materials 1957:57:1259-1272.
- 20. Sellars CM, Tegart WJM. La relation entre la résistance et la structure dans la deformation à chaud. Mémoires Scientifiques de la Revue de Metallurgie 1966; 63:731-746.
- 21. Uvira JL and Jonas JJ. Hot Compression of Armco Iron and Silicon Steel. Transactions of the metallurgical society of AIME 1968; 242:1619-1626.
- 22. McQueen HJ and Ryan ND. Constitutive analyze in hot working. Materials Science and Engineering: A. 2002; 322:43-63. http://dx.doi.org/10.1016/S0921-5093(01)01117-0
- 23. Barbosa RANM and Sellars CM. Static recrystallization of type 316L stainless steel under hot working conditions. Materials Science Forum 1993; 113-115:461-466. http://dx.doi.org/10.4028/www.scientific.net/MSF.113-115.461
- 24. Giordani EJ, Jorge AM Jr and Balancin O. Proportion of recovery and recrystallization during interpass times at high temperatures on a Nb- and N-bearing austenitic stainless steel biomaterial. Scripta Materialia 2006; 55:743-746. http://dx.doi.org/10.1016/j.scriptamat.2006.05.015
- 25. Sousa RC, Silva ES, Jorge AM Jr, Cabrera JM and Balancin O. Dynamic recovery and dynamic recrystallization competition on a Nb- and N- bearing austenitic stainless steel biomaterial. Materials Science & Engineering: A. 2012; 582:96-107. http://dx.doi.org/10.1016/j.msea.2013.06.037
- 26. Silva ES, Sousa RC, Jorge AM Jr and Balancin O. Hot deformation behavior of an Nb- and N- bearing austenitic stainless steel biomaterial. Materials Science & Engineering: A. 2012; 543:69-75. http://dx.doi.org/10.1016/j.msea.2012.02.048
Publication Dates
-
Publication in this collection
24 Jan 2014 -
Date of issue
Apr 2014
History
-
Received
21 May 2013 -
Reviewed
07 Nov 2013