Abstract
In the present paper a continuous Finite Element Analysis (FEA) simulation method of the ball indentation hardness test is introduced in order to describe the deformation behavior of nanosilica composites and with this to extract precisely the material's stress-strain behavior. The developed procedure demonstrate in particular the adequacy of this method to determine the nanocomposites' elastic modulus which is compared with Halpin-Tsai and Lewis-Nielsen models as well as with experimental measurements taken from uniaxial tensile tests. The fracture area of all the tensile specimens was examined using a scanning electron microscope (SEM). It is shown that the correlation between the experimental results, the semi-empirical models and the FEA computational models concerning the elastic modulus values was satisfactory with very small deviations.
Keywords:
Nanocomposites; Ball Indentation; Finite Element Analysis
1. Introduction
In recent years there are concentrated efforts on the development of advanced materials through the addition of nano-reinforcements on various matrices for higher mechanical, thermal and physical properties. The nanomaterials era has attracted the structural scientists, engineers and industries with a simple target to design and develop new multi-functional nanocomposite materials with unique combination of properties unattainable with traditional materials. Like traditional composites, the nanocomposites could have a metallic, polymeric or ceramics matrix. In general, polymer matrix composites provide high specific stiffness, specific strength, fatigue and corrosion resistance than metals, yet, they have poor impact energy absorption and poor residual strength after impact especially in harsh environments11 Berketis K, Tzetzis D, Hogg PJ. The influence of long term water immersion ageing on impact damage behavior and residual compression strength of glass fibre reinforced polymer (GFRP). Materials & Design. 2008;29(7):1300-1310.
2 Berketis K, Tzetzis D. Impact damage behavior of composite materials after long-term exposure to a hydrothermal environment. In: Lechkov M, Prandzheva S, eds. Encyclopaedia of Polymer Composites: Properties, Performance and Applications. New York: Nova Science Publishers; 2009. p. 913-932.
3 Berketis K, Tzetzis D. Review on the Water Immersion and Impact Damage Effects on the Residual Compressive Strength of Composites. In: Song DB, ed. Resin Composites: Properties, Production and Applications. New York: Nova Science Publishers; 2011. p. 1-54.
4 Berketis K, Tzetzis D, Hogg PJ. Impact damage detection and degradation monitoring of wet GFRP composites using noncontact ultrasonics. Polymer Composites. 2009;30(8):1043-1049.-55 Berketis K, Tzetzis D. The compression-after-impact strength of woven and non-crimp composites subjected to long-term water immersion ageing. Journal of Materials Science. 2010;45(20):5611-5623.. Nanocomposites could alleviate such issues if problems such uniform dispersion of the nanofillers in the matrix is achieved through the selection of a suitable processing method. Nanofiller aggregation introduces local stress concentration within the structure, while a weak particle-matrix adhesion reduces the capability of the load transfer mechanism between the nanofillers. These lead to a premature failure of the polymer and thus reduce its strength and strain to failure. Another important aspect is the selection of the suitable nanofiller and its compatibility with the polymer matrix to create a strong interface. Various researchers have concentrated their efforts toward the development of polymers in which nanomaterials are embedded in polymer substrates and much promising results have been established primarily for improvement of the mechanical and dynamic properties66 Mansour G, Tsongas K, Tzetzis D. Investigation of the dynamic mechanical properties of epoxy resins modified with elastomers. Composites Part B: Engineering. 2016;94:152-159.,77 Mansour G, Tsongas K, Tzetzis D. Modal testing of nanocomposite materials through an optimization algorithm. Measurement. 2016;91:31-38.. More specifically, embedding silica nanoparticles into a polymeric matrix system, can dramatically improve the fracture toughness of the polymeric composites88 Hsieh TH, Kinloch AJ, Masania K, Taylor AC, Sprenger S. The mechanisms and mechanics of the toughening of epoxy polymers modified with silica nanoparticles. Polymer. 2010;51(26):6284-6294.,99 Hsieh TH, Kinloch AJ, Masania K, Sohn Lee J, Taylor AC, Sprenger S. The toughness of epoxy polymers and fibre composites modified with rubber microparticles and silica nanoparticles. Journal of Materials Science. 2010;45(5):1193-1210.. The fracture toughness is an important property in fibre polymer composite industry, since it prevents delamination damage, while it is also vital in composite repair and bonding procedures1010 Tzetzis D, Hogg PJ. The influence of surface morphology on the interfacial adhesion and fracture behavior of vacuum infused carbon fiber reinforced polymeric repairs. Polymer Composites. 2008;29(1):92-108.
11 Tzetzis D, Hogg PJ. Infield composites repair techniques for combat aircraft: research and development perspective. Materials Technology. 2007;22(1):2-9.-1212 Tzetzis D, Hogg PJ, Jogia M. Double cantilever beam Mode-I testing for vacuum infused repairs of GFRP. Journal of Adhesion Science and Technology. 2003;17(3):309-328..
Roscher et al.1313 Roscher C. Tiny particles, huge effect. European Coatings Journal. 2003;4:131-141. have shown that due to the small size of silica particles the viscosity of the epoxy does not notably increase. Also, Ragosta et al.1414 Ragosta G, Abbate M, Musto P, Scarinzi G, Mascia L. Epoxy-silica particulate nanocomposites: Chemical interactions, reinforcement and fracture toughness. Polymer. 2005;46(23):10506-10516. reported and improvement of the mechanical properties of epoxy resin by utilising silica particles of 10-15nm in diameter at 10 wt%. The fracture energy of the epoxy matrix increased by a factor of about 4, whereas the increase of fracture toughness was twofold. In addition, the normalized yield strength increased up to 1.3 and the normalized elastic modulus attained the value of 1.5. Kinloch et al.1515 Kinloch AJ, Mohammed R, Taylor AC, Eger C, Sprenger S, Egan D. The effect of silica nano particles and rubber particles on the toughness of multiphase thermosetting epoxy polymers. Journal of Materials Science. 2005;40(18):5083-5086. examined the fracture behaviour of GFRP laminates with an epoxy matrix modified by nanoparticles and found considerable increase in the strain energy release rate for both mode I and II loading conditions using silica nanoparticles alone and in combination with a CTBN toughening. Also, Blackman et al.1616 Blackman BRK, Kinloch AJ, Sohn Lee J, Taylor AC, Agarwal R, Schueneman G, Sprenger S. The fracture and fatigue behaviour of nano-modified epoxy polymers. Journal of Materials Science. 2007;42(16):7049-7051. found an increase of the fracture toughness in an epoxy matrix, using nanosilica particles. The fracture toughness improvement was up to 73% at 20 wt% along with an improvement in fatigue behaviour. In addition, Hui Zhang et al.1717 Zhang H, Zhang Z, Friedrich K, Eger C. Property improvements of in situ epoxy nanocomposites with reduced interparticle distance at high nanosilica content. Acta Materialia. 2006;54(7):1833-1842. showed that the static/dynamic modulus, microhardness, and fracture toughness of the nanocomposites were enhanced with increasing silica content up to 23 wt.%. Fractography using SEM indicated that, on a micrometre scale the nanoparticle-induced dimples were the major toughening mechanism causing energy dissipation. Jumahat et al.1818 Jumahat A, Soutis C, Jones FR, Hodzic A. Effect of silica nanoparticles on compressive properties of an epoxy polymer. Journal of Materials Science. 2010;45(21):5973-5983. studied the static uniaxial compression tests of cubic and cylindrical specimens in order to study the compressive stress-strain response, the failure mechanisms and damage characteristics of the pure and nanomodified with silica epoxy. It was found that the compressive stiffness and strength were improved with increasing nanosilica content without significant reduction in failure strain. The presence of nanosilica improved ductility and promoted higher plastic hardening behavior after yielding in comparison with the unmodified resin system. This result suggested that nanoparticles introduced additional mechanisms of energy absorption to enhance the compressive properties without reducing the deformation to failure.
Despite the rigorous research on the effect of nanosilica particles on the mechanical behavior of the composite materials, there is a necessity for utilizing procedures using small samples to minimize the high costs involved with the preparation of samples that have embedded nanomaterials as compared to the standard tensile and compression test samples. Alternative approaches have been utilized for determination of the mechanical properties of nanocomposites by using the instrumented indentation technique. This is a simple but powerful testing technique, which can provide useful information about the mechanical properties of materials. Various studies have compared the results obtained from such techniques with the results obtained from the traditional tensile tests especially for the elastic modulus calculation1919 Mansour G, Tzetzis D, Bouzakis KD. A Nanomechanical Approach on the Measurement of the Elastic Properties of Epoxy Reinforced Carbon Nanotube Nanocomposites. Tribology in Industry. 2013;35(3):190-199.
20 Tzetzis D, Mansour G, Tsiafis I, Pavlidou E. Nanoindentation Measurements of Fumed Silica Epoxy Reinforced Nanocomposites. Journal of Reinforced Plastics and Composites. 2013;32(3):163-173.-2121 Mansour G, Tzetzis D. Nanomechanical Characterization of Hybrid Multiwall Carbon Nanotube and Fumed Silica Epoxy Nanocomposites. Polymer-Plastics Technology and Engineering. 2013;52(10):1054-1062.. The instrumented indentation techniques have been long used for materials quality control in industrialised environments.
It is anticipated in the near future these techniques to be attractive also in the nanocomposites industry due to the simplicity and practicality of the experiments involved. Such techniques apart from the local characterization of the material might be also crucial in the study of the bulk material elastic properties if their results are manipulated through computational methods.
In this study in particular, specimens with highly dispersed nanosilica particles in the epoxy resin were fabricated. The silica nanoparticles were supplied as a colloidal sol and a series of nanocomposites with 15 and 25wt% nanosilica content were prepared. The mechanical performance of the nanocomposites was characterized by uniaxial compression tests and an instrumented ball indentation at room temperature. The results obtained from the experimental tests and more specifically the elastic modulus was compared the Halpin-Tsai and Lewis-Nielsen models as well as with a developed finite element model simulating the ball indentation experiment.
2. Experimental Details
2.1 Fabrication of nanosilica-filled epoxy specimens
The epoxy resin that has been used to form the nanocomposites was the SP115 supplied by Gurit, UK which is a standard diglycidyl ether of bis-phenol A/F (DGEBA/F) with a tensile modulus of 3.7 GPa and an epoxide equivalent weight (EEW) of 169,7 g/eq. as given by the manufacturer. The silica (SiO2) nanoparticles were supplied as a colloidal silica-sol at a concentration of 40 wt.% in a DGEBA epoxy resin (EEW= 295 g/eq.) as 'Nanopox F400' from Evonik, Germany. The modulus of silica can be found in the literature as 69 GPa2222 Zou M, Yang D. Nanoindentation of silica nanoparticles attached to a silicon substrate. Tribology Letters. 2006;22(2):189-196.. The silica nanoparticles for the Nanopox F400 are synthesised from an aqueous sodium silicate solution. They then undergo a process of surface modification, with an organosilane, and matrix exchange to produce a masterbatch of 40 wt% silica nanoparticles in the epoxy resin. Despite the relatively high silica-nanoparticle content of about 25 wt%, the nanofilled epoxy resin still has a comparatively low viscosity due to the agglomerate-free colloidal dispersion of the nanoparticles in the resin. The curing agent was a 3-aminomethyl-3,5,5-trimethylcyclohexylamine (SP 115 Hardener with amine-hydrogen equivalent weight of 42,3 g/eq.), also supplied by Gurit, UK. In order to prepare a series of nanocomposites with 10-25 wt% nanosilica content, the SP115 epoxy resin was mechanically mixed with Nanopox F400 nanosilica-DGEBA/F masterbatch for 10min. The mixture was degassed for 15 min in a vacuum oven to remove the entrapped air, which then was blended with the appropriate stoichiometric amounts of SP115 Hardener (based on the amount of DGEBA and the masterbatch) for 10 min. The nanomodified resin was afterwards degassed in the vacuum oven before curing to remove any air entrapped in the mixture and then poured into silicon moulds. Finally, the resin system was room temperature cured at 24hours following 16 hours at 50º C with a ramp rate of 1ºC/min followed by cooling down to room temperature at 1ºC/min.
3. Mechanical Testing Procedures
3.1 Tensile tests
Tensile tests were performed at room temperature (23°C) on a Zwick Z010 (Zwick, Germany) universal testing machine. The measurements followed the EN ISO 527 testing standard using dumbbell shaped specimens for the pure resin samples and for those reinforced with nanosilica at a strain rate of 0.01s-1. E-moduli were calculated within the linear section of the stress-strain curves. The local microstructure of the fractured areas of the specimens was qualitatively examined using a JEOL JSM-840A scanning electron microscope (SEM).
3.2 Ball indentation tests
Indentations were carried out using a cemented carbide ball diamond indenter of 0.4mm in diameter. The samples were fabricated as discussed in section 2.1 having a small cylindrical shape with dimensions 10mm in diameter and 10mm in height. These were subsequently machined on a lathe and polished to an accuracy of 0.01 mm (measured with a micrometer). After machining and polishing, a delay of at least 3 hours was steadily applied in order to let the samples cool down to ambient temperature. A weak preload was applied first in order to detect the surface contact and to establish a zero datum. Then a load controlled loading step to a maximum of 130N was applied as shown in the schematic in Figure 1, which was followed by a dwell time of 5s and then unloading down to 0mN at the same rate as the loading stage. On a given specimen, various points were selected which were purposely scattered on the surface. At least 10 measurements were conducted on each specimen.
4. Finite Element Modeling
The ball indentation experimental results were simulated with the aid of FEA-based procedure. The ball indentation results are the input data to the introduced FEM continuous simulation algorithm of the ball indentation test in order to calculate the whole stress-strain curve of the materials under study. In order to advance with the calculation an axisymmetric FEA model of the semi-infinite layered half-space was built in relation to other work2323 Bouzakis KD, Michailidis N, Erkens G. Thin hard coatings stress-strain curve determination through a FEM supported evaluation of nanoindentation test results. Surface and Coatings Technology. 2001;142-144:102-109.. Figure 2 shows the axisymmetric FEA model where the boundary conditions and the finite element discretization network are clearly represented. In order to describe the interface between the indentor and the surface of the epoxy nanocomposite samples contact elements were used. Preliminary results have shown that the contact element stiffness and friction coefficient in a large range of their values do not affect the evaluation results. The ball indentation test has been simulated by considering effectively two load steps. The first load step simulated the loading stage of the indenter into the epoxy nanocomposites. The second step, which can be called as the relaxation stage the ball indentor was removed leading to the material elastic-plastic recovery. In three-dimensional stress-strain problems, the material status is oriented by the position of the principal stress vector relative to the yield surface. In general, the two available hardening rules are the isotropic and the kinematic one. In the first case the yield surface remains centered on its initial center and expands in size as the plastic strain develops. On the other hand, the kinematic hardening assumes that the yield surface remains constant in size and the surface translates in stress space with progressive yielding, whereas the Besseling model is used2323 Bouzakis KD, Michailidis N, Erkens G. Thin hard coatings stress-strain curve determination through a FEM supported evaluation of nanoindentation test results. Surface and Coatings Technology. 2001;142-144:102-109.
24 ANSYS®. Academic Research, Release 16.2, Help System, Mechanical APDL. Canonsburg: ANSYS.-2525 Loubet JL, Georges JM, Meille G. Vickers Indentation Curves of Elastoplastic Materials. In: Blau PJ, Lawn BR, eds. Microindentation Techniques in Material Science and Engineering. West Conshohocken: ASTM International; 1985. p. 72-89., also called sub-layer or overlay model, to characterize the material behavior. Considering that the kinematic hardening rule leads to a rapid convergence in the corresponding FEM calculations, this feature was applied in the developed procedure.
5. Results and Discussion
5.1 Tensile test results
In Figure 3 typical stress-strain curves under tension loading are illustrated where the silica nanocomposites show higher tensile strengths and moduli than the neat epoxy without reducing significantly its failure strain even at high nanosilica content. Fracture of all specimens occurred soon after yielding and prior the full occurrence of plastic strain softening as observed from the stress-strain curves. The increase in the modulus of the nanocomposites was expected since the modulus of silica is about 69 GPa. In addition, the homogeneous dispersion of these high stiffness nanofillers in the matrix enhanced the fracture toughness of the system as indicated by the larger area under stress-strain curve of the nanocomposite system. As the tensile load increases, the matrix tries to elongate however, the nanofillers resist deformation. This result in slightly smaller deformation compared to the neat polymer. Therefore, nanocomposites sustain more loads compared to the pure epoxy system and contribute to a higher tensile modulus and strength. The modulus for the pure epoxy resin was measured to be 3.81GPa, while for the nanosilica reinforced epoxy the values were 4.58GPa and 5.81GPa for the 15wt% and 25wt% nanosilica respectively. The fracture surfaces of specimens having neat epoxy resin samples showed characteristic river lines and a smooth surface as shown in Figure 4(a). The silica nanocomposites revealed in contrary a fracture surface with severely distracted patterns as illustrated in Figure 4(b). It should be noted that the SEM used in the current work is incapable of revealing the details in a nano level. It is believed though that for the silica nanoparticle specimens the particle-matrix interfacial adhesion is indeed strong. This is probably because the silica nanoparticles were beforehand surface-modified with silane coupling agent, which can react with both inorganic particles and epoxy resin and yield strong interfacial adhesion, which results in the increase in moduli as monitored from the tensile tests.
Typical tensile stress-strain curves of nanosilica-modified SP115 compared to the neat epoxy.
An optical (confocal) 3D measurement system µsurf by Nanofocus was used to capture in detail the fracture surface of the tensile test samples. Figure 5 shown the 2D profiles of the neat epoxy and 25%wt nanosilica fractured surfaces. Both surface profiles show that they have a specific repeatable pattern that has characteristic large wavelengths and some arbitrary imperfections. As expected it is apparent from the surface profiles that the modified epoxy with nanosilica particles produced deeper valleys with large fluctuations than the neat epoxy resin on which this effect was on a lesser scale. A more multifaceted rapid crack propagation have been occurred through the silica nanoparticles. The arithmetic average surface roughness, (Ra), and the mean Roughness depth (Rz) develop similar tendency, as shown in Figure 6. Despite some scatter of the experimental data, the surface roughness rises dramatically at a nanofiller content of 15wt% where it remains pretty much stable for the 25wt% nanosilica loading.
Typical surface profiles generated from the fracture of the tensile test specimens showing a) neat epoxy resin and b) 25%wt nanosilica. The redline arrows in the optical microscope photos show the position of the line scans where the profiles where measured.
Surface texture parameters calculated from the profile traces as measured by the profilometer.
5.2 FEA-supported ball indentation analysis
Figure 7 illustrates typical depth-load curves of indentations made at a peak indentation load of 130N on the pure epoxy resins and the two types of nanocomposites. The creep under constant load is clearly visible. No cracks were formed during indentation as no steps or discontinuities were found on the loading curves. The indentation depths at the peak load range from around 50 to 80 µm. The lowest indentation depths are observed for the 25wt% nanocomposites while the highest depths are monitored for the neat epoxy specimen. The results portray clearly the stiffening effect that the nanosilica introduces to the epoxy resin.
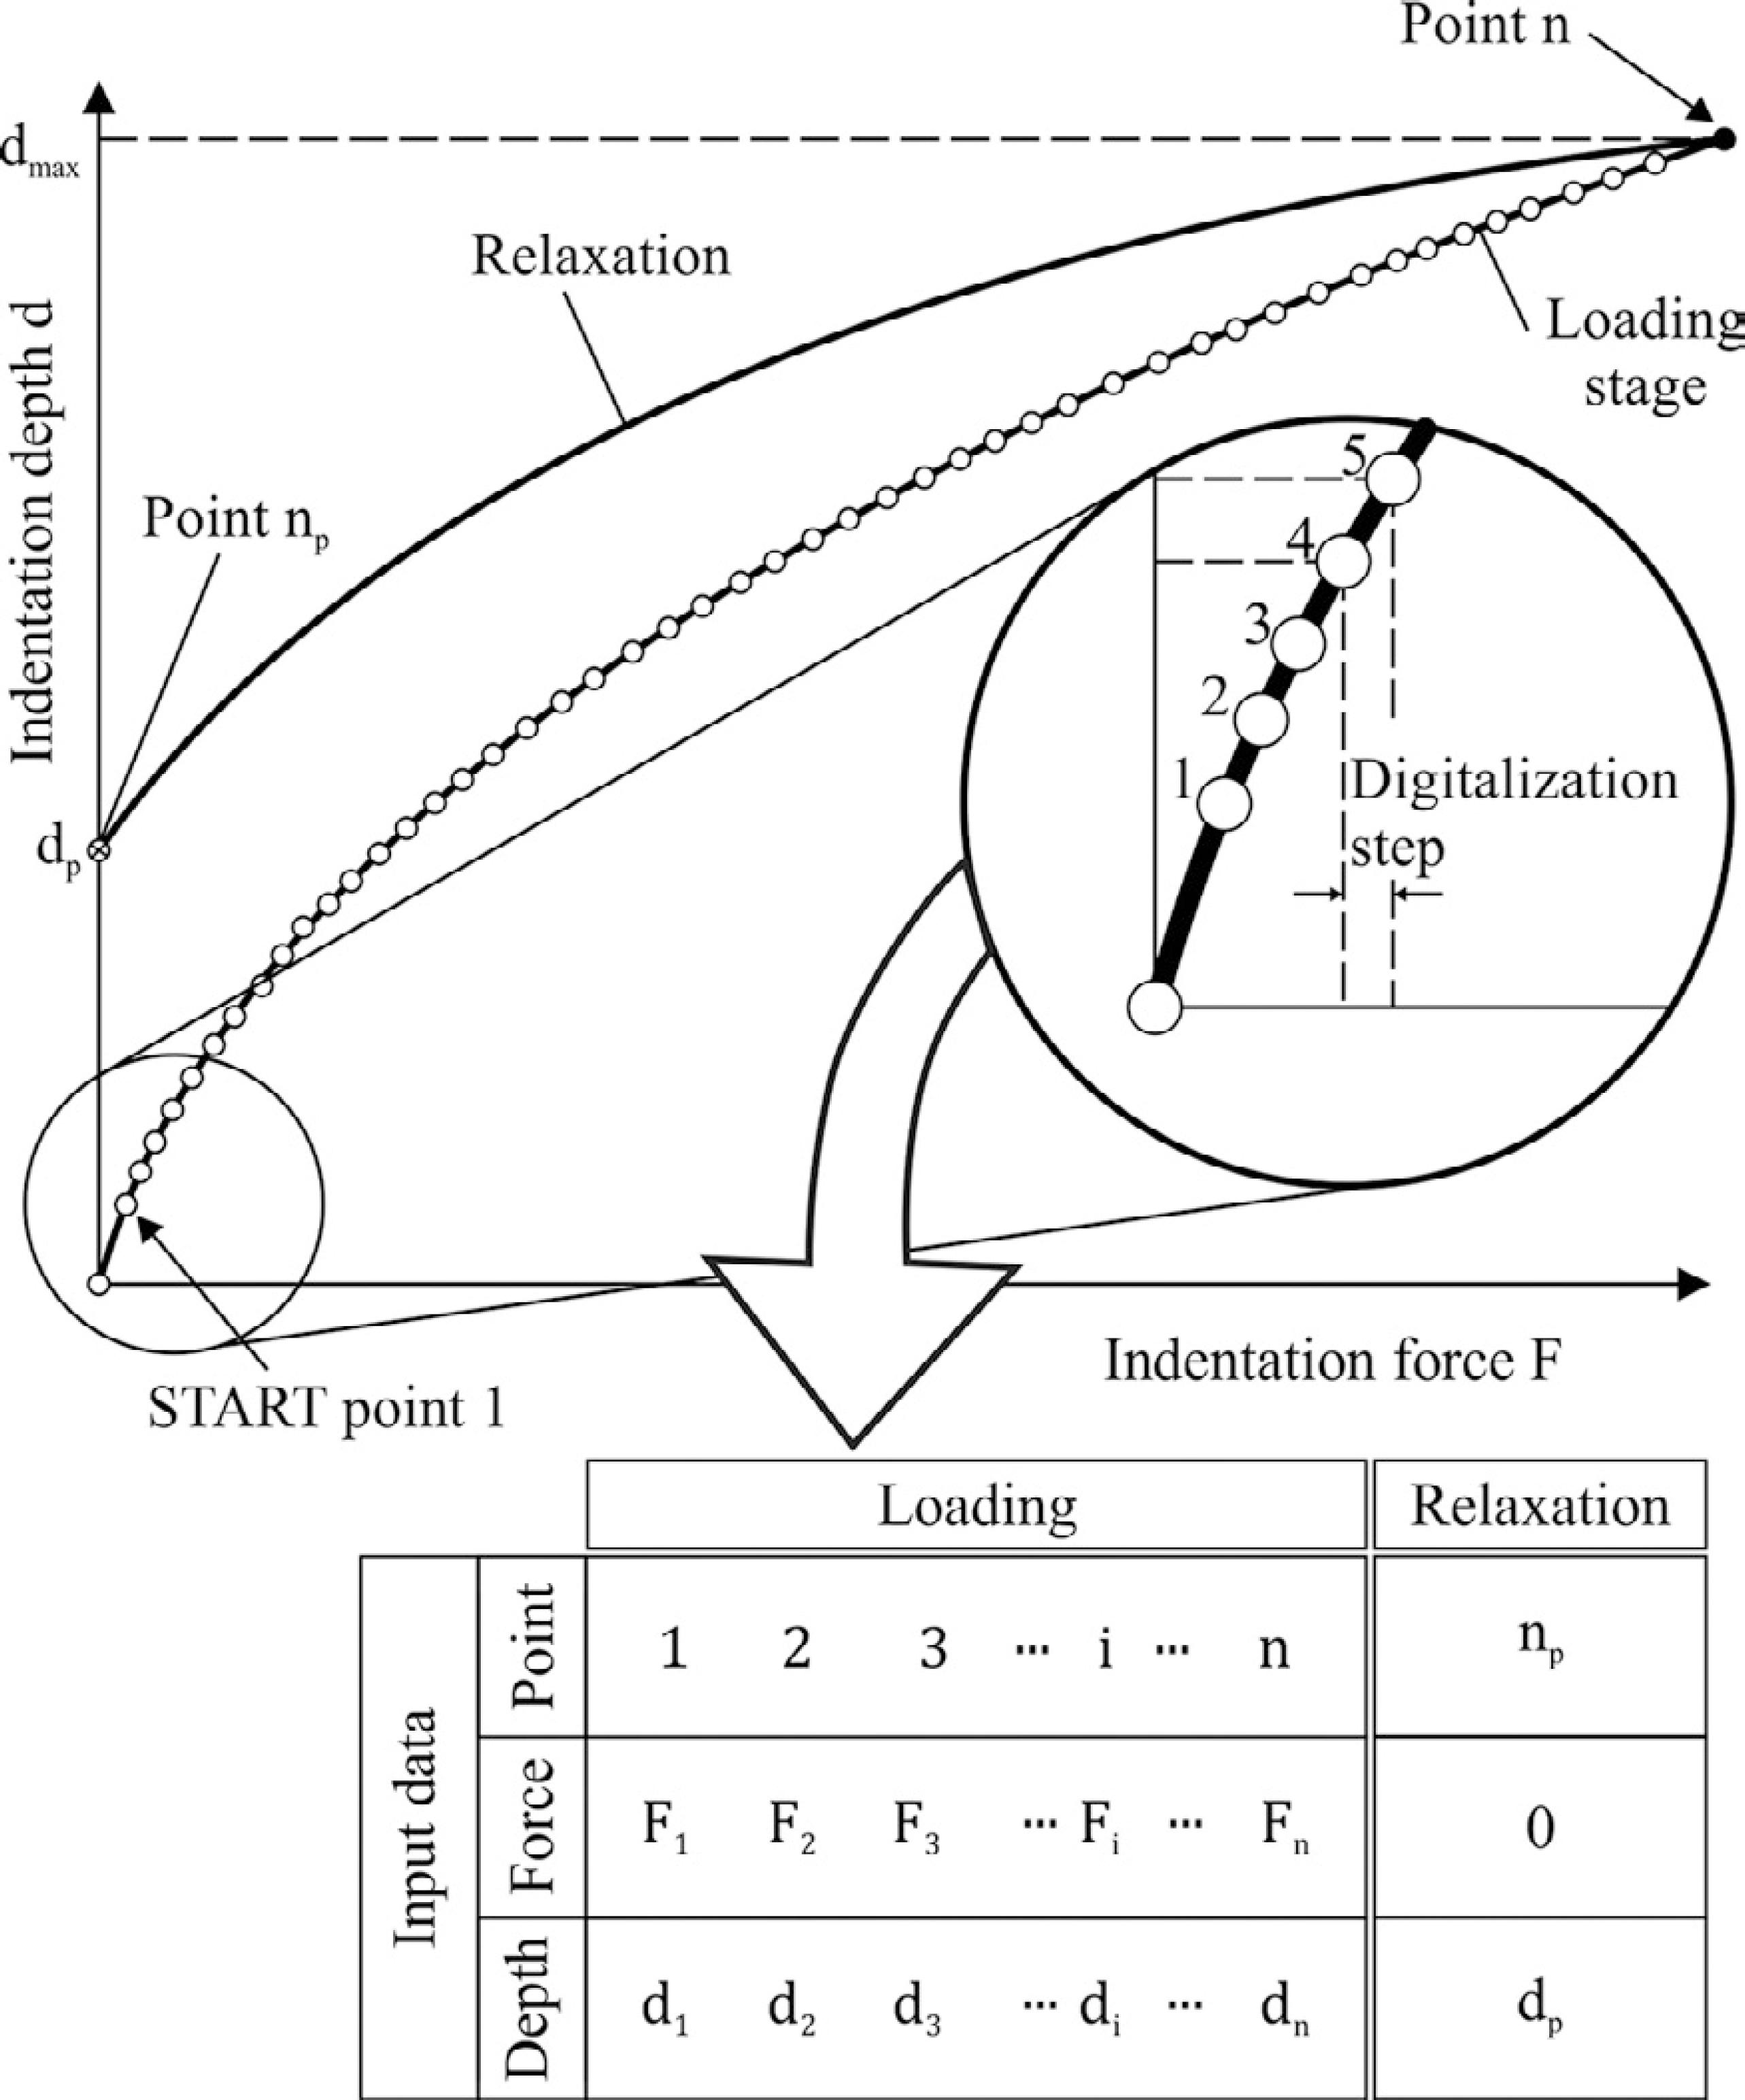
Figure 8 shows a typical diagram of both the loading and the relaxation stage during the indentation procedure describing the penetration depth d vs. the applied indentation force F. During the loading stage the curve is digitized in a number of Fi - di pairs as the corresponding table that is superimposed in the Figure 8 explains so to create the input data to the developed FEA. The first pair of the applied force F1 and the consequent penetration depth d1 are read initially. Assuming an initial value for the first tangent modulus E1 of the nanocomposites' stress-strain curve, corresponding to its elasticity modulus, the indentation FEA model, considering the depth d1, a penetration force FFEA1 is determined, which is compared to the measured real one F1. If there is deviation from the calculated force FFEM1 from the measured F1 then the value E1 is approximated again and the FEA solution is repeated.
Digitalization of the nanoindentation results diagram to create the input data to the developed algorithm.
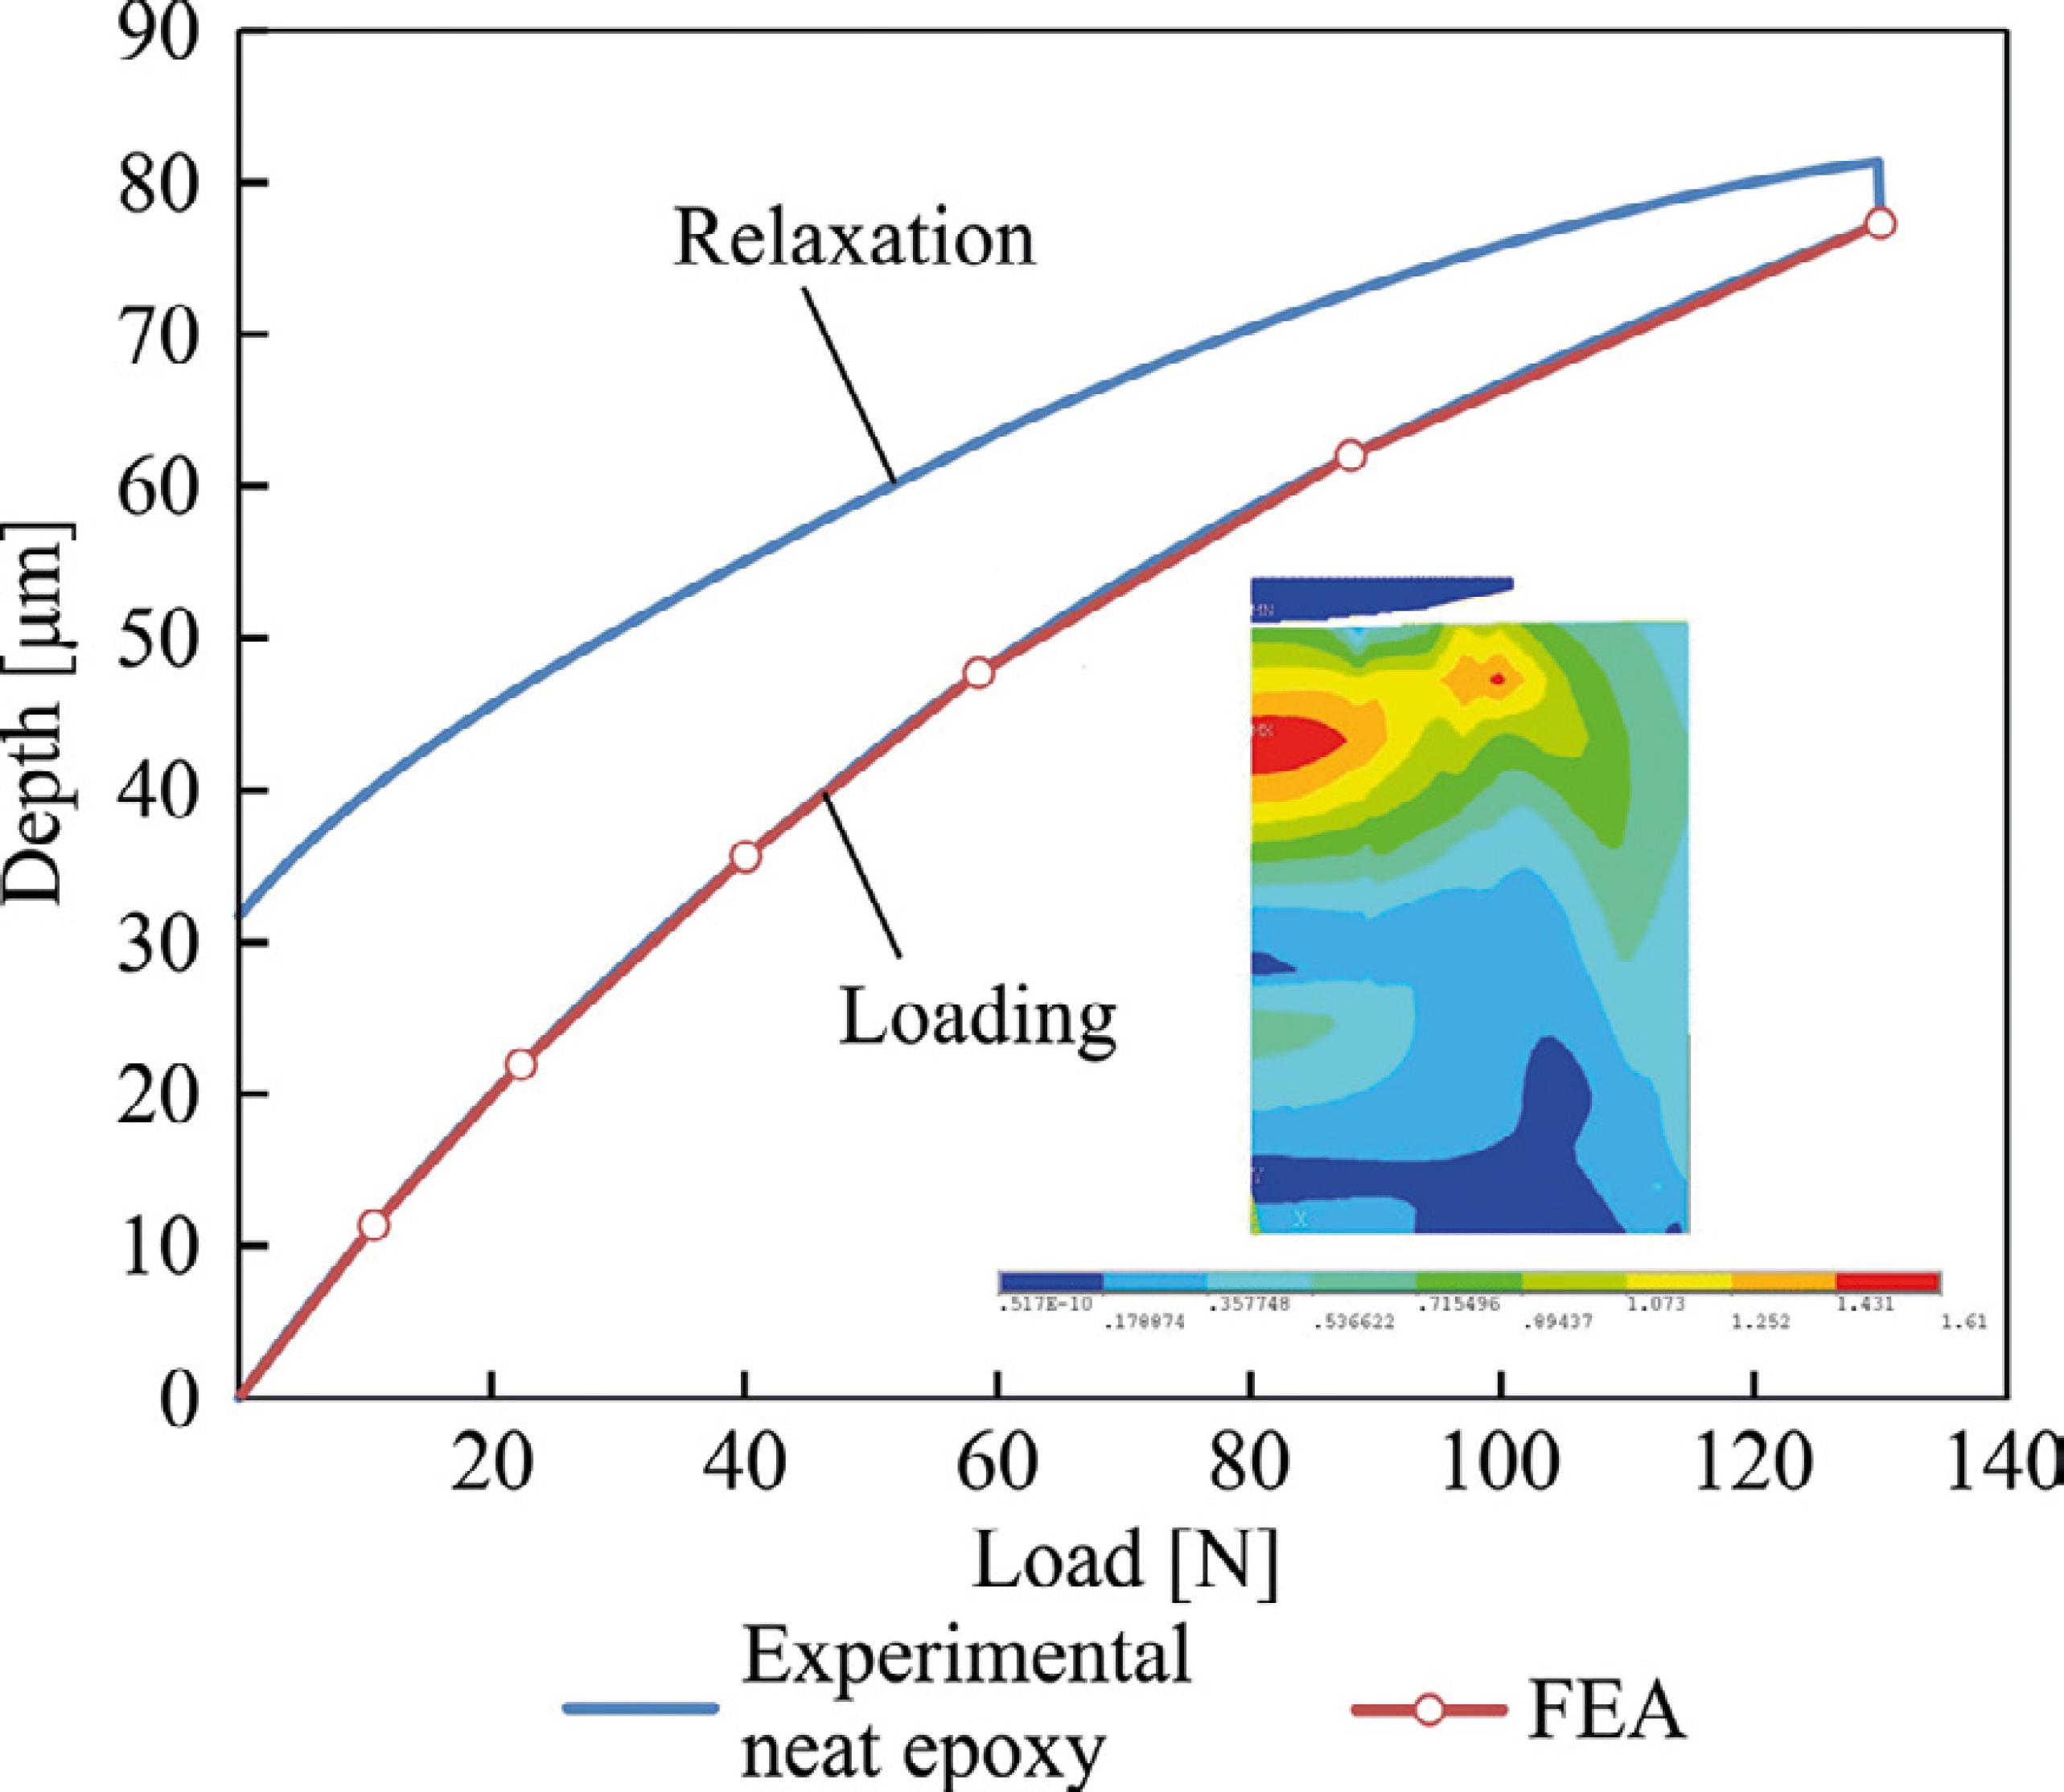
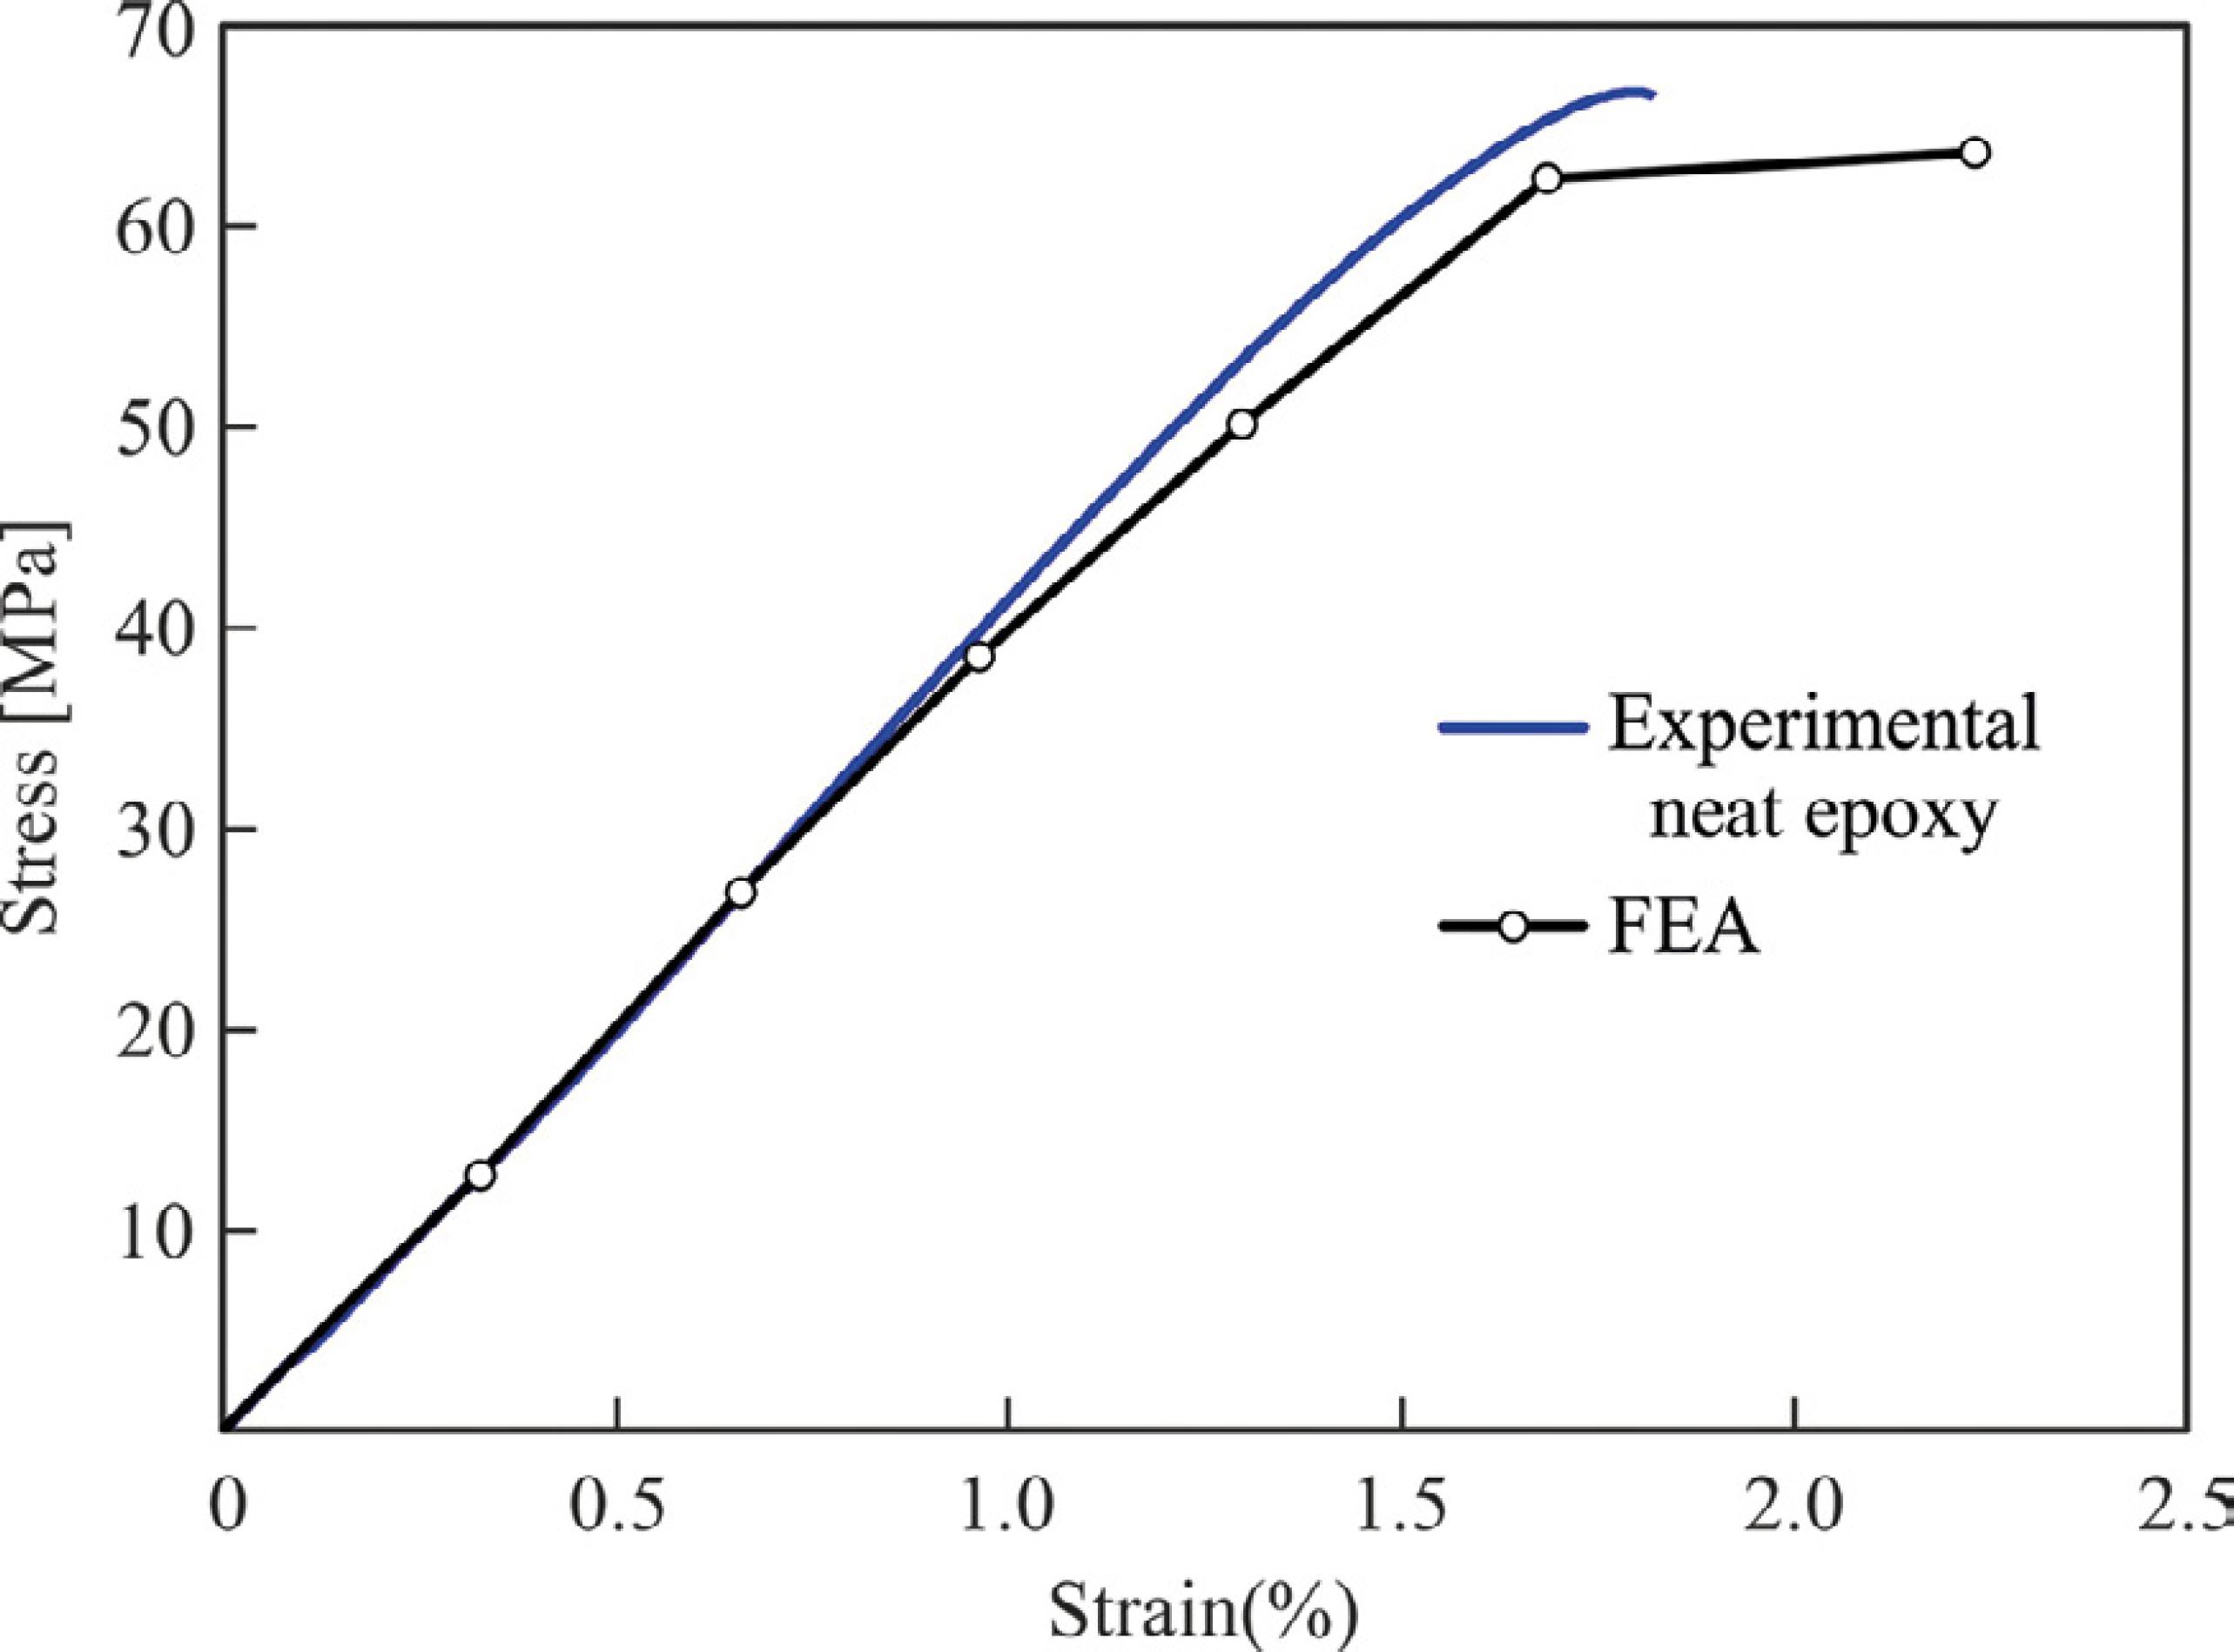
If where the calculated force FFEM1 coincides with the measured F1 then the value E1 is held and the next values pair (F2, d2) is applied to the model. The next calculation step now starts at an indentation depth d1, considering the already existing stress status as well as the previously obtained tangent modulus and ends at the penetration depth d2. The latter procedure is repetitive until the last pair of values (Fn, dn) is lastly considered and the loop ends. The FEA results are presented in the form of a depth-load graph as shown in Figure 9 along with a typical stress contour, while Figure 10 shows the good correlation that was obtained between the experimental and the predicted stress-strain curves in the case of the neat epoxy resin.
FEA-determined impression from the ball indentation through the developed FEA simulation and a typical stress contour.
5.3 Comparison of experimental and predicted elastic modulus
Despite the fact that there are many models that can predict the elastic modulus of silica particles modified composites in the present work the Halpin-Tsai and Lewis-Nielsen models were selected as most appropriate for the silica nanocomposites. The prediction of modulus of a material containing silica nanoparticles is modeled by the Halpin-Tsai2626 Halpin JC. Stiffness and Expansion Estimates for Oriented Short Fiber Composites. Journal of Composite Materials. 1969;3(4):720-724. micromechanical model, which is a well-known theory to predict stiffness of composites as a function of filler loading and aspect ratio. The predicted modulus of the silica-particle modified epoxy polymer, E, is given by:
where Eu is the modulus of the unmodified resin, ζ is the shape factor, Vf is the volume fraction of particles, and η is given by:
Halpin and Kardos2727 Halpin JC, Kardos JL. The Halpin-Tsai equations: a review. Polymer Engineering and Science. 1976;16(5):344-352. have suggested from comparison of their predictions with results from finite element analysis a shape factor of ζ= 2w/t, where w/t is the aspect ratio of the particles, when the particles are aligned with the loading direction. They proposed ζ to be equal to 2 for the modulus perpendicular to the loading direction. However, for the spherical nanoparticles used in the present work, the aspect ratio w/t=1 and hence ζ = 2 will be used.
Another model that has been used in the current work is Lewis-Nielsen model2828 Lewis TB, Nielsen LE. Dynamic mechanical properties of particulate-filled composites. Journal of Applied Polymer Science. 1970;14(6):1449-1471., which gives the modulus, E, of the silica-nanoparticle modified epoxy polymer by taking into consideration the work of McGee and McCullough2929 McGee S, McCullough RL. Combining rules for predicting the thermoelastic properties of particulate filled polymers, polymers, polyblends, and foams. Polymer Composites. 1981;2(4):149-161.:
where kE is the generalised Einstein coefficient, and β and µ are constants. The constant β is given by:
The constant β is identical to η in the Halpin-Tsai model when ζ=(kE-1). The value of µ which depends on the maximum volume fraction of particles, vmax, may be calculated from:
For random close packing, non-agglomerated spheres as the nanosilica particles used in the current work3030 Kinloch AJ, Mohammed RD, Taylor AC, Sprenger S, Egan D. The interlaminar toughness of carbon-fibre reinforced plastic composites using 'hybrid toughened' matrices. Journal of Materials Science. 2006;41(15):5043-5046. it is given that vmax = 0.632 which have been published by Nielsen and Landel3131 Nielsen LE, Landel RF. Mechanical Properties of Polymers and Composites. Boca Raton: CRC Press; 1993. for a range of particle types and packing.
The degree of adhesion determines the values of kE. So kE =2.167 if there is 'no slippage' at the silica particle-epoxy matrix interface, which indicates a very good adhesion and kE= 0.867 if there is interfacial slip occurs which indicates a relatively low adhesion3232 Johnsen BB, Kinloch AJ, Mohammed RD, Taylor AC, Sprenger S. Toughening mechanisms of nanoparticle-modified epoxy polymers. Polymer. 2007;48(2):530-541..
The values of the Young's modulus, E, measured from the tensile tests are illustrated in Table 1. The values obtained were between 3.81 to 5.81 GPa for the unmodified epoxy resin and the silica nanocomposites. The addition of silica nanoparticles increased the modulus as obtained from the experimental results. This is attributed to the much higher modulus of the silica.
Comparison of the elastic moduli of the specimens determined with tensile tests, arithmetic and numerical predictions.
The Halpin-Tsai model predictions are also compared in Table 1 with the experimental results. Clearly the predictions reveal a linear relationship and slightly underpredict the moduli of the silica nanocomposites for the 15wt% nanosilica while for the higher nanofiller loading the difference is increased. In Table 1 also the predictions from the Lewis-Nielsen model are compared with the experimental results and the results obtained from the FEA model. Markedly, reducing the adhesion of the nanoparticle/epoxy-polymer interface and thereby enabling 'slippage' reduces the value of the predicted modulus. On the other hand, when the interfacial adhesion is high the agreement between the predictions and the experimental data is more comparable. It should be noted that these three models have been used previously to predict the moduli of silica nanoparticle in epoxy polymers1818 Jumahat A, Soutis C, Jones FR, Hodzic A. Effect of silica nanoparticles on compressive properties of an epoxy polymer. Journal of Materials Science. 2010;45(21):5973-5983.. This study found that at concentrations of nanosilica such as at 20%wt the Lewis-Nielsen 'slip' model gave the best agreement with the measured values. However, at relatively low values of nanosilica concentration the Halpin-Tsai and the Lewis-Nielsen 'no-slip' models gave better agreement. The FEA results have shown a very accurate prediction of the elastic modulus of the neat epoxy resin and nanosilica composites. For the neat resin the difference between the predicted and the experimental results was only 4%, while for the 15wt% nanosilica and 25wt% nanosilica the difference was 4% and 9.5% respectively. It is critical though to say that the results of the ball indentation FEA study as compared with the experimental results should be interpreted with caution. It is well-known that the epoxy resin is a viscoelastic material and its deformation behavior is time dependent. Different rate of deformation will cause a difference in properties of the epoxy as well as to its nanocomposites. Therefore, the difference obtained between the tensile tests and the FEA supported ball indentation test results may be much influenced by the rate-dependent behavior of the materials under study in both testing techniques. Additionally, the strain fields in indentation are not uniform, therefore also the strain-rate fields cannot be uniform either; thus, a monotonically direct comparison of rate dependence to tensile tests should be deduced with carefulness.
6. Conclusion
A series of epoxy nanocomposites were developed based on nanosilica and SP115 epoxy resin. The SEM micrographs revealed composites with well-dispersed nanosilica that were non-agglomerated. The performance of the nanocomposites was evaluated via static uniaxial tensile tests. The silica nanocomposites offered higher tensile strength and stiffness as compared to the neat epoxy without sacrificing the material's strain to failure. A procedure to extract the nanocomposites' constitutive laws based on an evaluation of ball indentation results through a developed FEA continuous simulation of the indentor penetration into a sample is presented. The FEA considers the ball indentation results as input data to the described model and extracts the stress-strain curves of the silica nanocomposites. The introduced indentation test result evaluation method is a very efficient procedure to characterize the elastic plastic deformation behavior of the silica nanocomposites. The predicted modulus of elasticity using the FEA as well as the semi-empirical models of Halpin-Tsai and Lewis-Nielsen models showed a very good agreement when compared to the experimentally measured values.
7. References
-
1Berketis K, Tzetzis D, Hogg PJ. The influence of long term water immersion ageing on impact damage behavior and residual compression strength of glass fibre reinforced polymer (GFRP). Materials & Design 2008;29(7):1300-1310.
-
2Berketis K, Tzetzis D. Impact damage behavior of composite materials after long-term exposure to a hydrothermal environment. In: Lechkov M, Prandzheva S, eds. Encyclopaedia of Polymer Composites: Properties, Performance and Applications New York: Nova Science Publishers; 2009. p. 913-932.
-
3Berketis K, Tzetzis D. Review on the Water Immersion and Impact Damage Effects on the Residual Compressive Strength of Composites. In: Song DB, ed. Resin Composites: Properties, Production and Applications New York: Nova Science Publishers; 2011. p. 1-54.
-
4Berketis K, Tzetzis D, Hogg PJ. Impact damage detection and degradation monitoring of wet GFRP composites using noncontact ultrasonics. Polymer Composites 2009;30(8):1043-1049.
-
5Berketis K, Tzetzis D. The compression-after-impact strength of woven and non-crimp composites subjected to long-term water immersion ageing. Journal of Materials Science 2010;45(20):5611-5623.
-
6Mansour G, Tsongas K, Tzetzis D. Investigation of the dynamic mechanical properties of epoxy resins modified with elastomers. Composites Part B: Engineering 2016;94:152-159.
-
7Mansour G, Tsongas K, Tzetzis D. Modal testing of nanocomposite materials through an optimization algorithm. Measurement 2016;91:31-38.
-
8Hsieh TH, Kinloch AJ, Masania K, Taylor AC, Sprenger S. The mechanisms and mechanics of the toughening of epoxy polymers modified with silica nanoparticles. Polymer 2010;51(26):6284-6294.
-
9Hsieh TH, Kinloch AJ, Masania K, Sohn Lee J, Taylor AC, Sprenger S. The toughness of epoxy polymers and fibre composites modified with rubber microparticles and silica nanoparticles. Journal of Materials Science 2010;45(5):1193-1210.
-
10Tzetzis D, Hogg PJ. The influence of surface morphology on the interfacial adhesion and fracture behavior of vacuum infused carbon fiber reinforced polymeric repairs. Polymer Composites 2008;29(1):92-108.
-
11Tzetzis D, Hogg PJ. Infield composites repair techniques for combat aircraft: research and development perspective. Materials Technology 2007;22(1):2-9.
-
12Tzetzis D, Hogg PJ, Jogia M. Double cantilever beam Mode-I testing for vacuum infused repairs of GFRP. Journal of Adhesion Science and Technology 2003;17(3):309-328.
-
13Roscher C. Tiny particles, huge effect. European Coatings Journal 2003;4:131-141.
-
14Ragosta G, Abbate M, Musto P, Scarinzi G, Mascia L. Epoxy-silica particulate nanocomposites: Chemical interactions, reinforcement and fracture toughness. Polymer 2005;46(23):10506-10516.
-
15Kinloch AJ, Mohammed R, Taylor AC, Eger C, Sprenger S, Egan D. The effect of silica nano particles and rubber particles on the toughness of multiphase thermosetting epoxy polymers. Journal of Materials Science 2005;40(18):5083-5086.
-
16Blackman BRK, Kinloch AJ, Sohn Lee J, Taylor AC, Agarwal R, Schueneman G, Sprenger S. The fracture and fatigue behaviour of nano-modified epoxy polymers. Journal of Materials Science 2007;42(16):7049-7051.
-
17Zhang H, Zhang Z, Friedrich K, Eger C. Property improvements of in situ epoxy nanocomposites with reduced interparticle distance at high nanosilica content. Acta Materialia 2006;54(7):1833-1842.
-
18Jumahat A, Soutis C, Jones FR, Hodzic A. Effect of silica nanoparticles on compressive properties of an epoxy polymer. Journal of Materials Science 2010;45(21):5973-5983.
-
19Mansour G, Tzetzis D, Bouzakis KD. A Nanomechanical Approach on the Measurement of the Elastic Properties of Epoxy Reinforced Carbon Nanotube Nanocomposites. Tribology in Industry 2013;35(3):190-199.
-
20Tzetzis D, Mansour G, Tsiafis I, Pavlidou E. Nanoindentation Measurements of Fumed Silica Epoxy Reinforced Nanocomposites. Journal of Reinforced Plastics and Composites 2013;32(3):163-173.
-
21Mansour G, Tzetzis D. Nanomechanical Characterization of Hybrid Multiwall Carbon Nanotube and Fumed Silica Epoxy Nanocomposites. Polymer-Plastics Technology and Engineering 2013;52(10):1054-1062.
-
22Zou M, Yang D. Nanoindentation of silica nanoparticles attached to a silicon substrate. Tribology Letters 2006;22(2):189-196.
-
23Bouzakis KD, Michailidis N, Erkens G. Thin hard coatings stress-strain curve determination through a FEM supported evaluation of nanoindentation test results. Surface and Coatings Technology 2001;142-144:102-109.
-
24ANSYS® Academic Research, Release 16.2, Help System, Mechanical APDL Canonsburg: ANSYS.
-
25Loubet JL, Georges JM, Meille G. Vickers Indentation Curves of Elastoplastic Materials. In: Blau PJ, Lawn BR, eds. Microindentation Techniques in Material Science and Engineering West Conshohocken: ASTM International; 1985. p. 72-89.
-
26Halpin JC. Stiffness and Expansion Estimates for Oriented Short Fiber Composites. Journal of Composite Materials 1969;3(4):720-724.
-
27Halpin JC, Kardos JL. The Halpin-Tsai equations: a review. Polymer Engineering and Science 1976;16(5):344-352.
-
28Lewis TB, Nielsen LE. Dynamic mechanical properties of particulate-filled composites. Journal of Applied Polymer Science 1970;14(6):1449-1471.
-
29McGee S, McCullough RL. Combining rules for predicting the thermoelastic properties of particulate filled polymers, polymers, polyblends, and foams. Polymer Composites 1981;2(4):149-161.
-
30Kinloch AJ, Mohammed RD, Taylor AC, Sprenger S, Egan D. The interlaminar toughness of carbon-fibre reinforced plastic composites using 'hybrid toughened' matrices. Journal of Materials Science 2006;41(15):5043-5046.
-
31Nielsen LE, Landel RF. Mechanical Properties of Polymers and Composites Boca Raton: CRC Press; 1993.
-
32Johnsen BB, Kinloch AJ, Mohammed RD, Taylor AC, Sprenger S. Toughening mechanisms of nanoparticle-modified epoxy polymers. Polymer 2007;48(2):530-541.
Publication Dates
-
Publication in this collection
31 Aug 2017 -
Date of issue
Nov-Dec 2017
History
-
Received
01 May 2017 -
Reviewed
13 July 2017 -
Accepted
26 July 2017