Abstract
Two experiments were carried out with twenty-four male weaned Holstein calves to verify the influence of different dietary cation-anion concentrate and roughage proportions on calves metabolism. In the first experiment, calves were fed rations with -100, +200 and +400 mEq cation-anion balance/kg of dry matter, containing 60% of roughage and 40% of concentrate. In the second experiment, calves (117.6±20.8 kg average weight) received rations with similar dietary cation-anion balance but in diets of 40% roughage and 60% concentrate. As the dietary cation-anion balance became more positive, there was a quadratic response of blood pH in both diets with 60 and 40% roughage. A linear increase following increased dietary cation-anion balance was observed on bicarbonate concentration, carbon dioxide tension, carbon dioxide partial pressure and urine pH on both experiments, while anion gap decreased linearly. Blood urea nitrogen and base excess increased quadratically according to increased dietary cation-anion balance on 60% roughage, whereas those same parameters showed a linear increase on 40% roughage. Growing ruminant metabolism both in cationic and anionic diets was modified when the roughage:concentrate ratio was altered.
bicarbonate; BUN; DCAB; nutrition; pCO2; pH
RUMINANTS
Metabolic changes in ruminant calves fed cation-anion diets with different proportions of roughage and concentrate1 1 Research financially supported by FAPESP
Márcia Saladini Vieira SallesI; Marcus Antonio ZanettiII; João Alberto NegrãoII; Fernando André SallesI; Thiago Mauro Carvalho RibeiroII; Arlindo Saran NettoII; Gustavo Ribeiro Del ClaroII
IAPTA Regional de Ribeirão Preto
IIFZEA/USP
ABSTRACT
Two experiments were carried out with twenty-four male weaned Holstein calves to verify the influence of different dietary cation-anion concentrate and roughage proportions on calves metabolism. In the first experiment, calves were fed rations with -100, +200 and +400 mEq cation-anion balance/kg of dry matter, containing 60% of roughage and 40% of concentrate. In the second experiment, calves (117.6±20.8 kg average weight) received rations with similar dietary cation-anion balance but in diets of 40% roughage and 60% concentrate. As the dietary cation-anion balance became more positive, there was a quadratic response of blood pH in both diets with 60 and 40% roughage. A linear increase following increased dietary cation-anion balance was observed on bicarbonate concentration, carbon dioxide tension, carbon dioxide partial pressure and urine pH on both experiments, while anion gap decreased linearly. Blood urea nitrogen and base excess increased quadratically according to increased dietary cation-anion balance on 60% roughage, whereas those same parameters showed a linear increase on 40% roughage. Growing ruminant metabolism both in cationic and anionic diets was modified when the roughage:concentrate ratio was altered.
Key Words: bicarbonate, BUN, DCAB, nutrition, pCO2, pH
Introduction
The pH of biological solutions has influence on different biochemical reactions which are essential for life maintenance (Wheeler, 1980), affecting properties such as volume, pressure, osmolarity and ionic concentration of different aqueous compartments cellular, transcellular, interstitial, and plasmatic of the organism. As a consequence, acid-base homeostasis influences both the metabolism and the performance of domestic animals, including calves (Jackson et al., 1992; Ross, et al., 1994a, 1994b; Fauchon et al., 1995; Jackson et al., 2001).
In this context, the respiratory, renal and buffering systems (hemoglobin/oxyhemoglobin, bicarbonate/carbonic acid, acid/basic proteins, monoacidic/diacidic phosphates) are activated so that the organism pH is kept within an ideal range (Patience, 1990; Field et al., 2001). The base and acid excess produced or absorbed by the organism is usually buffered and/or eliminated through respiration, urine and feces. Thereby, ion H+, carbonic gas (pCO2-), and bicarbonate (HCO3-) concentration study on the biological fluids (plasma, urine, saliva and other aqueous secretions) is very important for the understanding of pH regulation mechanisms and normal functioning of the organism (Wheeler, 1980; Patience, 1990).
However, a diet can be manipulated to change acid-base balance in the organism. Making use of this principle, nutritionists can change the dietary cation-anion balance (DCAB) and change the organism pH as a result (Patience, 1990; Block, 1994; Morse et al., 2007). Some minerals commonly offered to animals (Na+, K+, Cl-, S-), measured in mEq/kg, can cause important changes in acid-base balance. Therefore, acidic or alkaline diets can be offered to avoid metabolic problems common in high performance animals decreasing the incidence of paresis, laminitis, edema and ketosis (Wheeler, 1980; Block, 1994; Morse et al., 2007).
The aim of this experiment was to study the influence of different DCAB and its relation to the proportions of diet roughage and concentrate (Experiment I - 60% roughage/40% concentrate; Experiment II - 40% roughage/60% concentrate) on the metabolism of growing calves aiming at assisting the nutritional and feeding management in order to enhance general health and performance of the animals.
Material and Methods
Twenty-four male weaned Holstein calves, with average age of 90 days (12 of them rumen-fistulated) were submitted to two experiments in a completely randomized blocks design. Blocks were formed by both intact and fistulated animals with eight repetitions per treatment (three DCAB levels); each animal was considered an experimental unit. Each experiment lasted 35 days: 14 days for diet and cage adaptation, and 21 days for data collection.
In the first experiment (Experiment I), calves had average weight of 90.2±12.4 kg and were fed rations with the following DCAB treatments: -100, +200 and +400 mEq/kg DM, with 60% roughage and 40% of concentrate. In the second experiment (Experiment II), calves had an average weight of 117.6±20.8 kg, and were fed with the same DCAB values, but 40% roughage and 60% of concentrate diet. In both experiments, animals were kept in individual metabolic cages equipped with rubber mats, water and feed buckets.
A diet with -100 mEq/kg DM of DCAB was preliminarily chosen to cause mild acidosis in the animals so that metabolic responses to help the management of animals that suffer from acidosis due to feeding management (high concentrate proportions) were obtained, and metabolic mechanisms to improve prepartum cow management were understood. Experimental treatments of +200 and +400 mEq/kg of DM were chosen to obtain physiological responses and determine the best DCAB level in different roughage:concentrate ratios that already cause different actions in the acid-base system, without inducing alkalosis.
The diet was a TMR (Table 1) offered ad libitum once a day at 8:00 (the quantity was supplied and the leftover was weighed the following morning before the amount for that day was given). In both experiments, corn silage was used as roughage, and ammonium sulfate and sodium bicarbonate were added to obtain the positive and negative balance desired for the treatments.
Temperature and humidity of the experimental site were measured three times a day during the experiments. The mean temperature and humidity in Experiment I were 19.5 °C and 63.5%, and in Experiment II, 21.5 °C and 65.0%, respectively.
Chemical analyses of rations were carried out according to AOAC (1995) procedures, as follows: dry matter (method 930.15), crude protein (method 984.13), ash (method 942.05), and ether extract (method 920.39). Neutral detergent fiber was analyzed according to Van Soest et al. (1991). Ration was ground, dry-digested and solubilized prior to mineral analysis. An atomic absorption spectrophotometer (Perkin Elmer model) with lanthanun added into the solubilized solution was used to assess Ca concentration. The molybdenum blue colorimetric technique was employed to assess P concentration, in a Fentro colorimeter (725 nm wavelength), following the methodology described by Malavolta et al. (1997). To determine S concentration, the same methodology was employed (420 nm wavelength). Na and K were determined in a flame photometer (Analyser®). Cl concentration was accessed according to the Mohr method (AOAC, 1995).
The DCAB value was obtained from the difference between the minerals (Na + K) (Cl + S) expressed in mEq/kg of DM from the diet and consumed water.
Blood and urine samples, used to obtain the mean value, were collected on the 14th, 21st, 28th and 35th experimental days, in a total of four samples per animal. In Experiment I (60% roughage), the urine sample was collected right after feeding, and the blood sample was collected four hours after. In Experiment II (40% roughage), the urine sample was collected right after feeding, and the blood, three hours after.
All the blood samples were collected by jugular vein puncture, and immediately analyzed for blood urea nitrogen (BUN), carbon dioxide tension (TCO2), anion gap ([Na+] + [K+]) ([Cl-] + [HCO3-]), hematocrit (HCT), hemoglobin (Hb via HCT), pH, carbon dioxide partial pressure (pCO2), base excess and HCO3- concentration [HCO3-] using and automatic i-STAT analyzer. The cartridge contains microsensors and performs specific analyses through its chemically sensitive biosensors on the silicon chip. Both the calibration process and analyses are included in the same cartridge by a microfluidics process. When the analysis is started, the calibrant solution is released on the sensor so that the validation proceeds. Once the validation is completed, the calibrant solution goes to the waste chamber and is replaced by blood, which is then analyzed.
Urine samples were collected using buckets adapted to the cages for 24 hours, and fecal bags were used to prevent urine contamination with feces. Urine pH was measured with Nova Técnica portable pHmeter as soon as buckets were removed from cages.
In both experiments data were analyzed in completely randomized block design with a SAS PROC GLM (Statistical Analysis System, version 8) used to determine variation and treatment effects (linear and quadratic) tested by orthogonal polynomial contrast. The graphics show the least-squares means and standard error.
Results and Discussion
There was a quadratic increase in the blood pH of calves as a consequence of the DCAB increase in the 60% roughage (P<0.01) diet and 40% roughage diet (P = 0.04) (Figure 1).
The acid-base balance is critical to the maintenance of pH within the narrow range required by several enzymatic systems to keep the animal body functioning normally. The blood pH oscillations beyond the normal levels (7.3 to 7.5) are indicative of acid-base imbalance, and can be classified as acidosis and alkalosis (Morse et al., 2007). According to Boron (1989), there are four primary disorders in the acid-base system that lead to alterations in blood CO2 and HCO3-: 1) respiratory acidosis, when there is an increase of [H+] and decrease of blood pH, increasing pCO2; 2) metabolic acidosis, when there is an increase in [H+] and decrease in blood pH, lowering the [HCO3-]; 3) metabolic alkalosis, when there is a decrease of [H+] and blood pH decrease, causing a decrease of pCO2; 4) metabolic alkalosis, when there is a decrease of [H+] and blood pH increase, increasing the [HCO3-].
The necessary parameters to determine the existence of acid-base imbalance are: blood pH, pCO2 (respiratory parameter), [HCO3-], TCO2 and blood AnGap (metabolic parameters). If any of these parameters are not within their normal range, it means that there is some kind of acid-base balance abnormality in the animal organism (Morse et al., 2007).
There are compensatory responses that the body will employ to maintain blood pH within normal range in cases of acidosis or alkalosis. The compensatory mechanism for metabolic acidosis is hyperventilation, and for metabolic alkalosis, hypoventilation. Respiratory acidosis works by urinary acidification, while respiratory alkalosis works by urinary alkalinization (Boron, 1989). Ruminant urine pH ranges from 6.0 to 9.0; extreme values possibly occur as a response to acidosis or alkalosis (Cunninghan, 1992).
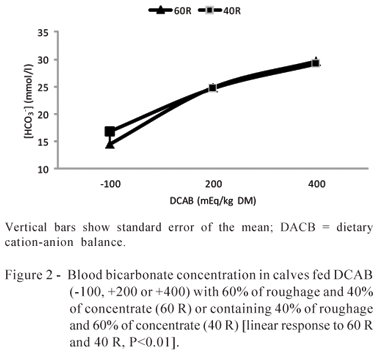
[HCO3-] (Figure 2), TCO2 (Figure 3), pCO2 (Figure 4), and urine pH (Figure 5) increased linearly as a result of DCAB increase in the 60 (P<0.01) and 40% roughage (P<0.01) diets.
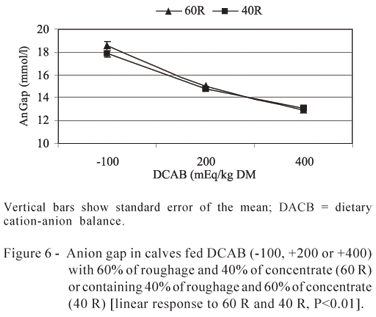
The anion gap (Figure 6) decreased linearly as a result of DCAB increase in the 60 (P<0.01) and 40% roughage (P<0.01) diets.
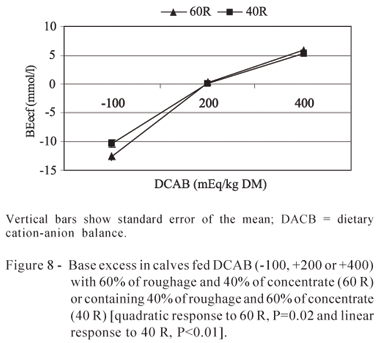
Blood urea nitrogen (BUN) (Figure 7) and base excess (Figure 8) concentration increased quadratically with increased DCAB with 60% roughage (BUN, P<0.01 and base excess, P<0.03), and increased linearly in the diet with 40% roughage (BUN, P<0.04 and base excess, P<0.01).
Animals on treatment -100 showed lower values of blood pH, pCO2, [HCO3-], TCO2, base excess, and urine pH; and increased blood anion gap. Hersom et al. (2010), on a previous study on dietary cation-anion balance effect (-100 e + 250 mEq/kg of DM containing 70% roughage) on the physiological parameters of beef cows also demonstrated decreased blood pH, [HCO3- and base excess with the decrease of cation-anion balance causing the decrease of urine pH. These authors reported that animals fed anionic diets caused the organism to disseminate the acid load of the blood to other tissues and fluids causing urine pH increase. In his article, Wheeler (1980) reports that blood pH of animals can range from 7.3 to 7.5. In this experiment, only the animals fed -100 diets had blood pH out of the normal range.
Animals fed +200 and +400 showed increased pH, pCO2, [HCO3-], TCO2, BEecf, urine pH, and increased blood anion gap, with the highest values of all variables in treatment +400.
According to Boron (1989), under normal circumstances, average blood pH should be 7.4, pCO2 40 mmHg, [HCO3-] 24 mM and anion gap 12 ± 4 mEq/L. Animals fed DCAB of -100 showed blood pH values of 7.26, pCO2 32.49 mmHg, and [HCO3-] 14.57 mmol/L in diet with 60% roughage; and 7.30, 35.04 mmHg and 16.81 mmol/L for the same variables in diets with 40% roughage, indicating that animals on both diets developed metabolic acidosis. According to Emmet & Seldin (1989), maximum respiratory compensation during severe metabolic acidosis may lower pCO2 to a minimum of 12 to 15 mmHg. However, during the present experiments, no acute acidosis incidence was observed on calves fed negative DCAB diets.
Changes in TCO2 cause immediate alteration in [HCO3-] following chemical equation: CO2 + H2O « H2CO3 « H+CO3-. Whenever TCO2 level increases, the equation will shift to the right increasing [HCO3-] (Emmett e Seldin, 1989). That is what happened with the TCO2 and [HCO3- parameters during the experiments with a linear TCO2 increase due to DCAB increase, and with [HCO3-] increase for both roughage and concentrate proportions.
Base excess concentration is increased with more alkaline diets and decreased with more acidogenic diets. According to Ortolani (2003), bovine base excess ranges from -2.3 to 3.7 mM indicating the amount of buffering in the blood the more negative the number, the higher the buffer loss in the blood, causing more acidosis. Conversely, the higher above normal the number is, the higher the accumulation of buffers in the blood indicating alkalosis. The base excess values found by Nagy et al. (2003) in 24-week old calf blood fed 50% roughage was 4.5±2.7 mmol/L. The authors of the present study noticed that base excess values were negative for DCAB of -100, as expected, and it increased as DCAB increased; however, at +400, this variable presented a different response between the proportions of roughage and concentrate. Although diets had been balanced to present the same DCAB, base excess values were higher for animals fed 40 (5.32 mmol/L) than for those fed 60% roughage (1.75 mmol/L).
Animals submitted to a DCAB of +400 presented pCO2 and [HCO3-] values slightly above those considered normal and might even be considered as mild metabolic alkalosis, but anion gap and urine pH for this treatment are within the normal range leading to the assumption that these animals were not in alkalosis with this DCAB level. According to Field et al. (2001), in the event of a metabolic alkalosis, pCO2 reaches 55 mmHg.
In these experiments, the average DCAB value of +200 was 38.6 mmHg, and of +400 it was 41.5 mmHg. In experiments with ruminant calves, Ross et al. (1994b) used DCAB of +450 mEq/kg DM and found 32.93 mmHg of pCO2. Jackson et al. (1992) used DCAB of +370 mEq/kg DM and found 47 mmHg of pCO2, and Jackson et al. (2001), using DCAB of +200 mEq/kg DM found the highest values of pCO2, 48.8 mmHg.
Evaluating the parameters previously discussed, the animals fed DCAB of -100 40% roughage showed pCO2 and blood [HCO3- values slightly higher, leading to an increase in urine pH (6.72 in 60 R and 7.17 in 40% roughage). Even though pCO2 and [HCO3-] values were close in treatments +200 and +400, urine pH also showed a slight increase during these treatments (7.53 and 8.31 in 60% roughage, and 7.89 and 8.57 in 40% roughage, respectively). Since it is an exponential variable, such differences in mean urine pH are significant in terms of discussing the reason why animals fed higher concentrated diet had lower acidic urine levels, but blood pH and bicarbonate concentrations similar to those fed more roughage. According to Kohn et al. (2005), there is a high correlation between BUN and urinary N excretion rate for all animal species whenever BUN levels is low, urine N excretion levels is also low, and the other way around. As BUN levels were lower in animals fed 40% roughage, regardless of DCAB, if compared with the ones fed 60% roughage, it is expected that urine N concentration also be lower, explaining urine pH increase.
Blood urea nitrogen is used to monitor protein and energy supply in healthy animals (Hammond, 1998). BUN levels were lower in animals fed 40% roughage diets (9.12 mg/dL), regardless of DCAB, if compared with 60% roughage (13.51 mg/dL). According to Hammond (1998), as energy intake increases, there is a BUN concentration decrease probably related to more efficient use of N in the rumen; whereas whenever energy intake is low, there is a BUN concentration increase related to diets with constant protein ingestion. The animals in treatment 40% roughage had an average dry matter ingestion of 3.9 % of BW and 3.5 % in treatment 60 R, which explains the reason why animals fed 40% roughage presented 4.39 mg/dL less BUN.
There was no difference between Hb (7.55; 7.19; 8.56 g/dL in the experiment with 60% roughage; and 7.50; 8.08; 7.69 g/dL in the experiment with 40% roughage, with -100, +200 and +400 of DCAB respectively), and Hct (22.29; 21.22; 25.16 % in experiment 60% roughage and 22.22; 22.72; 22.62 % in the experiment with 40% roughage, with -100, +200 and +400 of DCAB respectively) in the blood for the treatments (P>0.05).
Although there was no difference between Hb and Hct among the DCAB values, there was a different response pattern between roughage and concentrate proportions with +200 and +400 of DCAB. The animals fed 60% roughage diet had similar Hb and Hct values with these DCAB; however, animals fed 60% roughage showed a reasonable Hb and Hct increase when comparing the results with +200 and +400. Byers et al. (1952) reported an average hemoglobin value of Holstein cattle of 10.6 g/100 mL, ranging from 8.5 to 12.5 g/100 mL, and Rusoff et al. (1953), hematocrit values varying from 37 % to 50 % in the blood from the same breed. The animals from the current study showed lower values, only the animals fed 60% roughage and + 400 of DCAB showed values closer to Hb and Hct normal ranges. The authors from this study do not know the reason why the experimental animals presented values below these parameters, since they were fed balanced diets, and why they presented low incidence of diseases (only diarrhea, 60% roughage a calf on -100 and two on +200 diets; 40 R two calves on each DCAB diet). According to Gunn (1989), whenever buffering is under discussion, one has to consider the red blood cells apart from the other cells and tissues, since they present a high buffering capacity of the blood which is quickly available to the extracellular fluid in exchange for chloride and bicarbonate. For any unknown reason, the animals fed 60% roughage diets showed an increase in Hb and Hct when the diet was changed from +200 to +400.
The animals fed 40% roughage responded more efficiently to acidosis caused by DCAB of -100 if compared with 60% roughage, showing higher pCO2, base excess, TCO2 and [HCO3-] values. The [HCO3-] increase in the blood of these animals may have contributed to this response, since part of blood HCO3- is recycled in the rumen, limiting pH decrease, thus controlling rumen acidosis (Apper-Bossard et al., 2010).
Animals fed positive DCAB showed difference in nitrogen metabolism changing BUN response and urine pH between 60 and 40% roughage diets. These results demonstrate that even in diets containing the same DCAB, the outcomes, when the proportion of roughage and concentrate was modified, were different; probably due to different responses to mineral balance and nutrient intake.
Conclusions
The metabolism of growing ruminants changes both on cationic and anionic diets, whenever the proportion of roughage and concentrate is modified. Animals fed higher concentrate proportions have more efficient response to acidosis when compared with higher roughage proportions, for having the adjusted number of metabolites in the blood that regulates acidosis.
Acknowledgements
The authors thank Fundação de Amparo à Pesquisa do Estado de São Paulo (FAPESP) for sponsoring this study, and Faculdade de Zootecnia e Engenharia de Alimentos da Universidade de São Paulo for providing facilities.
Received December 20, 2010 and accepted July 11, 2011.
Corresponding author: marciasalles@apta.sp.gov.br
- APPER-BOSSARD, E.; FAVERDIN, P.; MESCHY, F. et al. Effects of dietary cation-anion difference on ruminal metabolism and blood acid-base regulation in dairy cows receiving 2 contrasting levels of concentrate in diets. Journal of Dairy Science, v.93, p.4196-4210, 2010.
- ASSOCIATION OF OFFICIAL ANALYTICAL CHEMISTS - AOAC. Official methods of analysis 16.ed. Arlington: AOAC International, 1995. 1025p.
- BLOCK, E. Manipulation of dietary cation-anion difference on nutritionally related production diseases, productivity, and metabolic responses of dairy cows. Journal of Dairy Science, v.77, p.1437-1450, 1994.
- BORON, W.F. Chemistry of buffer equilibria in blood plasma. In: Seldin, D.W.; Giebisch, G. (Eds). The regulation of acid-base balance New York: Raven Press, 1989. p.3-32.
- BYERS, J.H.; JONES, I.R.; HAAG, J.R. Blood hemoglobin values of dairy cattle. Journal of Dairy Science, v.35, p.661-667, 1952.
- CUNNINGHAM, J.G. Tratado de fisiologia veterinária Rio de Janeiro: Guanabara, 1992. 454p.
- EMMETT, M.; SELDIN, D.W. Evaluation of acid-base disorders from plasma composition. In: SELDIN, W.; GIEBISCH, G. (Eds). The regulation of acid-base balance New York: Raven Press, 1989. p.213-264.
- FAUCHON, C.; SEOANE, J.R.; BERNIER, J.F. Effects of dietary cation-anion concentrations on performance and acid-base balance in growing lambs. Canadian Journal of Animal Science, v. 75, p.145-151, 1995.
- FIELD, M.; HARRIS, D.; POLLOCK, C. The renal system: systems of the body series. Sydney: Churchill Livingstone Australia/ Department of Medicine of University of Sydney, 2001. 169p.
- GUNN, R.B. Buffer equilibria in red blood cells. In: Seldin, D.W.; Giebisch, G. (Eds.) The regulation of acid-base balance New York: Raven Press, 1989. p.57-68.
- HAMMOND, A. Use of BUN and MUN as guides for protein and energy supplementation in cattle. Revista Corpoica, v.2, p.44-48, 1998.
- HERSOM, M.J.; HANSEN, G.R.; ARTHINGTON, J.D. Effect of dietary cation-anion difference on measures of acid-base physiology and performance in beef cattle. Journal of Animal Science, v.88, p.374-382, 2010.
- JACKSON, J.A.; AKAY, V.; FRANKLIN, S.T. et al. The effect of cation-anion difference on calcium requirement, feed intake, body weight, and blood gasses and mineral concentration of dairy calves. Journal of Dairy Science, v.84, p.147-153, 2001.
- JACKSON, J.A.; HOPKINS, D.M.; XIN, Z. et al. Influence of cation-anion balance on feed intake, body weight gain, and humoral response of dairy calves. Journal of Dairy Science, v.75, p.1281-1286, 1992.
- KOHN, R.A.; DINNEEN, M.M.; RUSSEK-COHEN, E. Using blood urea nitrogen to predict nitrogen excretion and efficiency of nitrogen utilization in cattle, sheep, goats, horses, pigs and rats. Journal of Animal Science, v. 83, p.879-889, 2005.
- MALAVOLTA, E.; VITTI, G.C.; OLIVEIRA, S.A. Avaliação do estado nutricional das plantas 2.ed. Piracicaba: Associação Brasileira para a Pesquisa da Potassa e do Fosfato, 1997. 319p.
- MORSE, H.; WEBB, J.L; LEROY, B.E. Acid-base balance, an overview Athens: Veterinary Clinical Pathology Clerkship Program of University of Georgia, 2007. 7388p.
- NAGY, O.; SEIDEL, H.; KOVÁC, G. et al. Acid-base balance and blood gases in calves in relation to age and nutrition. Czech Journal of Animal Science, v.48, p.61-68, 2003.
- ORTOLANI, E.L. Diagnóstico e tratamento de alterações ácido-básicas em ruminantes. In: SIMPÓSIO DE PATOLOGIA CLÍNICA VETERINÁRIA DA REGIÃO SUL DO BRASIL, 1., 2003, Porto Alegre. Anais... Porto Alegre: Gráfica da Universidade Federal do Rio Grande do Sul. 2003. p.17-29.
- PATIENCE, J.F. A review of the role of acid-base balance in amino acid nutrition. Journal of Dairy Science, v.68, p.398-408, 1990.
- ROSS, J.G.; SPEARS, J.W.; GARLICH, J.D. Dietary electrolyte balance effects on performance and metabolic characteristics in growing steers. Journal of Animal Science, v.72, p.1842-1848, 1994a.
- ROSS, J.G.; SPEARS, J.W.; GARLICH, J.D. Dietary electrolyte balance effects on performance and metabolic characteristics in finishing steers. Journal of Animal Science, v.72, p.1600-1607, 1994b.
- RUSOFF, L.L.; JOHNSTON, J.E.; BRANTON, C. Blood studies of breeding dairy bull. I. Hematocrit. Hemoglobin, plasma calcium, plasma inorganic phosphorus, alkaline phosphatase values, erythrocyte count, and leucocyte count. Journal of Dairy Science, v.37, p.30-36, 1954.
- VAN SOEST, P.J.; ROBERTSON, J.B.; LEWIS, B.A. Methods for dietary fiber, neutral detergent fiber, and nonstarch polysaccharides in relation to animal nutrition. Journal of Dairy Science, v.74, p.3583-3597, 1991.
- WHEELER, W.E. Importance of cation-anion balance in ruminant nutrition Nebraska: Science and Education Administration/Agricultural Research Clay Center, 1980. p.17-27.
Publication Dates
-
Publication in this collection
19 Mar 2012 -
Date of issue
Feb 2012
History
-
Received
20 Dec 2010 -
Accepted
11 July 2011