Abstract
Protein supply and requirements by ruminants have been studied for more than a century. These studies led to the accumulation of lots of scientific information about digestion and metabolism of protein by ruminants as well as the characterization of the dietary protein in order to maximize animal performance. During the 1980s and 1990s, when computers became more accessible and powerful, scientists began to conceptualize and develop mathematical nutrition models, and to program them into computers to assist with ration balancing and formulation for domesticated ruminants, specifically dairy and beef cattle. The most commonly known nutrition models developed during this period were the National Research Council (NRC) in the United States, Agricultural Research Council (ARC) in the United Kingdom, Institut National de la Recherche Agronomique (INRA) in France, and the Commonwealth Scientific and Industrial Research Organization (CSIRO) in Australia. Others were derivative works from these models with different degrees of modifications in the supply or requirement calculations, and the modeling nature (e.g., static or dynamic, mechanistic, or deterministic). Circa 1990s, most models adopted the metabolizable protein (MP) system over the crude protein (CP) and digestible CP systems to estimate supply of MP and the factorial system to calculate MP required by the animal. The MP system included two portions of protein (i.e., the rumen-undegraded dietary CP - RUP - and the contributions of microbial CP - MCP) as the main sources of MP for the animal. Some models would explicitly account for the impact of dry matter intake (DMI) on the MP required for maintenance (MPm; e.g., Cornell Net Carbohydrate and Protein System - CNCPS, the Dutch system - DVE/OEB), while others would simply account for scurf, urinary, metabolic fecal, and endogenous contributions independently of DMI. All models included milk yield and its components in estimating MP required for lactation (MPl) and calf birth weight and some form of an empirical, exponential equation to compute MP for pregnancy (MPp). The MP required for growth (MPg) varied tremendously among the original models and their derivative works mainly due to the differences in computing growth pattern and the composition of the gain. The calculation of MCP differs among models; some rely on the total digestible nutrient (TDN; e.g., NRC, CNCPS level 1) intake to estimate MCP, while others use fermentable organic matter (FOM; e.g., INRA, DVE/OEB), fermentable carbohydrate (e.g., CNCPS level 2, NorFor), or metabolizable energy (ME; e.g., ARC, CSIRO, Rostock). Most models acknowledged the importance of ruminal recycled N, but not all accounted for it. Our Monte Carlo simulation indicated the prediction of most models for required MPl overlapped, confirming uniformity among models when predicting requirements for lactating animals, but a large variation in required MPg for growing animals exists.
modeling; nutrition; prediction; ruminants; simulation
Introduction
Historically, protein requirements for cattle recommended by the National Research Council (NRC) were expressed as concentrations in the diet because most of the feeding trials were conducted by measuring animal responses to graduated concentrations in the diet. Scientific investigations regarding protein requirements for growing cattle most likely started in 1908 with the release of Henry P. Armsby's report as Chairman of the Organization Committee of the American Society of Animal Nutrition, in which Armsby emphasized the need for cooperative studies to improve the quality of protein research (Forbes, 1924Forbes, E. B. 1924. Cooperative Experiments upon the protein requirements for the growth of cattle - II. No. 42. National Academy Press, Washington, DC.). A series of protein requirement experiments from 1919 to 1923 were published and suggestions for future experimentation were provided by the report of the Subcommittee on Animal Nutrition, which was chaired by Dr. E. B. Forbes (Forbes, 1924Forbes, E. B. 1924. Cooperative Experiments upon the protein requirements for the growth of cattle - II. No. 42. National Academy Press, Washington, DC.). Subsequently, additional research was conducted to understand the chemical constitution of protein and its nutritive value for feeding domesticated animals, and published as a report by the Subcommittee on Animal Nutrition chaired by Dr. H. H. Mitchell in 1926. In particular, it was shown that different proportions of amino acids in the protein would modify the nutritive value of the protein and thence "protein requirement ultimately can be expressed in terms of the amounts of the different indispensable amino acids, function, either singly or together, as its components" (Mitchell, 1926Mitchell, H. H. 1926. The determination of the protein requirements of animals and of the protein values of farm feeds and rations. No. 55. National Research Council, Washington, DC. 44p.). In 1929, a detailed report by the Subcommittee on Animal Nutrition chaired by Dr. H. H. Mitchell provided the first guidelines for minimum protein requirements of cattle (Mitchell, 1929Mitchell, H. H. 1929. The minimum protein requirements of cattle. No. 67. National Academy Press, Washington, DC. 84p.). In addition, because electronic calculators did not become available until the 1970s, most diets were balanced with hand calculations and the recommendations had to be simple enough to balance a diet with either trial and error or by Pearson's square.
Prior to the 1970s, the requirement for protein was based on the summary of experiments using feeding trials in which performance and digestibilities were routinely measured. In the 1960s, metabolism trials started to take place and by the 1980's the factorial method was used to compute protein requirements. Throughout the years, better fractionation of feed protein and requirement for protein by the different physiological stages of the animal were determined, but little advancement with individual amino acid requirements instead of protein requirement had been made. During the late 1980s and 1990s, desktop computers and software became powerful enough to calculate series of complex equations to estimate requirements. Thus, the development of nutrition models that could be used on farms became feasible when adequate data had been published to describe mathematically each of the above physiological functions, and computer technology advanced tremendously to integrate and apply them in production situations. Concurrent to the evolution of the NRC publications, other feeding systems (British: Agricultural Research Council, 1980ARC - Agricultural Research Council. 1980. The nutrient requirements of ruminant livestock. Agricultural Research Council. The Gresham Press, London.; French: Institut National de la Recherche Agronomique, 1989INRA - Institut National de la Recherche Agronomique. 1989. Ruminant nutrition. Recommended allowances and feed tables. Institut National de la Recherche Agronomique, John Libbey Eurotext, Montrouge, France.; Australian: Commonwealth Scientific and Industrial Research Organization, 1990CSIRO - Commonwealth Scientific and Industrial Research Organization. 1990. Feeding standards for Australian livestock. Ruminants. Commonwealth Scientific and Industrial Research Organization, Melbourne, Australia.; and German: Beyer et al., 2003 Beyer, M.; Chudy, A.; Hoffman, H. L.; Jentsch, W.; Laube, W.; Nehring, K. and Schiermann, R. 2003. Rostock Feed Evaluation System; Reference numbers of feed value and requirement of the base of net energy. Gottlob Volkhardtsche Druckerei, Amorbach.) were developed and some overlap existed among them regarding protein requirements.
For purposes of this paper, we define a ruminant nutrition model as an integrated set of equations and coefficients that predict animal requirements for maintenance, growth, pregnancy, and lactation, and supply of nutrients available to meet those requirements as the result of rumen fermentation, intestinal digestion, and metabolism of the feeds consumed in each unique production situation. The prediction of protein and amino acid requirements are components of this model, because their requirements are interdependent with energy requirements and the complete model is needed to determine which is first limiting.
The objectives of this paper are (1) to describe selected feeding systems (i.e., nutrition models) that are currently being used in production situations to predict protein requirements, (2) to compare the protein requirement calculations of these models, and (3) to summarize our vision for the next generation of cattle nutrition models. Table 1 has the list of acronyms used in this paper.
Description of major feeding systems
National Research Council (NRC)
In 1945, the NRC released the "Recommended Nutrient Allowances for Beef Cattle" (NRC, 1945NRC - National Research Council. 1945. Recommended nutrient allowances for beef cattle. Recommended nutrient allowances for domestic animals. National Academy Press, Washington, DC.), in which the requirements for protein were based on the factorial concepts previously delineated by Mitchell (1929)Mitchell, H. H. 1926. The determination of the protein requirements of animals and of the protein values of farm feeds and rations. No. 55. National Research Council, Washington, DC. 44p.. For maintenance, 0.6 lb of digestible protein (DP) was assigned for 1,000 lb of live body weight (BW), which is essentially 0.6 g DP/kg BW. For growth, a Missouri dataset was used and a protein digestibility of 50% was assumed to compute the DP of feeds. It was established at that time that lower percentages of protein were needed for finishing cattle as their BW increased. The first revision of the beef NRC publication was released in 1950. In addition to the 1945 Beef NRC, the "Recommended Nutrient Allowances for Dairy Cattle" was also released in 1945. The first revision of the dairy NRC was issued in 1950 and the second revision was issued six years later in 1956 with a different title: "Nutrient Requirements of Dairy Cattle" (NRC, 1956 NRC - National Research Council. 1956. Nutrient requirements of dairy cattle. 2nd ed. Nutrient requirements of domestic animals. National Academy Press, Washington, DC.). The concept of digestible protein was still being adopted and the 0.6 lb/1000 lb for maintenance was still used but the amounts for other BW were calculated at the same rate per unit of metabolic BW (BW0.75), which would be equivalent to approximately 2.77 g DP/kg0.75 of BW (i.e., (0.6/2.204) × 1000/(1000/2.204)0.75). Several other releases of the beef and dairy NRC publications were disseminated throughout the years, some with minor while others with major modifications.
The beef NRC had the second revision released in 1958 (NRC, 1958 NRC - National Research Council. 1958. Nutrient requirements of beef cattle. 2nd ed. Nutrient requirements of domestic animals. National Academy Press, Washington, DC.), the third revision in 1963 (NRC, 1963 NRC - National Research Council. 1963. Nutrient requirements of beef cattle. 3rd ed. Nutrient requirements of domestic animals. National Academy Press, Washington, DC.), and the fourth revision in 1970 (NRC, 1970 NRC - National Research Council. 1970. Nutrient requirements of beef cattle. 4th ed. Nutrient requirements of domestic animals. National Academy Press, Washington, DC.). The NRC (1970) included a new section on "Nutrient needs of rumen microorganisms". The fifth revision was released in 1976 (NRC, 1976 NRC - National Research Council. 1976. Nutrient requirements of beef cattle. 5th ed. Nutrient requirements of domestic animals. National Academy Press, Washington, DC.) and the sixth revision was released in 1984 (NRC, 1984NRC - National Research Council. 1984. Nutrient requirements of beef cattle. 6th ed. Nutrient requirements of domestic animals. National Academy Press, Washington, DC.). The NRC (1984) had major changes in the energy requirements section and included the concepts of ruminal protein degradation and bypass.
Likewise, the dairy NRC had its third revision released in 1966 (NRC, 1966 NRC - National Research Council. 1966. Nutrient requirements of dairy cattle. 3rd ed. Nutrient requirements of domestic animals. National Academy Press, Washington, DC.), the fourth revision in 1971 (NRC, 1971 NRC - National Research Council. 1971. Nutrient requirements of dairy cattle. 4th ed. Nutrient requirements of domestic animals. National Academy Press, Washington, DC.), and the fifth revision in 1978 (NRC, 1978 NRC - National Research Council. 1978. Nutrient requirements of dairy cattle. 5th ed. Nutrient requirements of domestic animals. National Academy Press, Washington, DC.). The NRC (1978) NRC - National Research Council. 1978. Nutrient requirements of dairy cattle. 5th ed. Nutrient requirements of domestic animals. National Academy Press, Washington, DC. contained major modifications to the calculation of protein requirements as proposed by Swanson (1977)Swanson, E. W. 1977. Factors for computing requirements of protein for maintenance of cattle. Journal of Dairy Science 60:1583-1593. and discussions about unavailable feed protein and feed protein solubility. The sixth revision was released in 1989 (NRC, 1989 NRC - National Research Council. 1989. Nutrient requirements of dairy cattle. 6th ed. Nutrient requirements of domestic animals. National Academy Press, Washington, DC.) and included the concept of rumen-undegraded protein (RUP) and microbial CP (MCP) being the main sources of metabolizable protein (MP).
Because of limitations in accuracy of inputs available and variation accounted for, recommendations were in terms of feeding allowances, which included substantial amounts added for safety factor. The development of net energy (NE) systems for beef (NRC, 1970 NRC - National Research Council. 1970. Nutrient requirements of beef cattle. 4th ed. Nutrient requirements of domestic animals. National Academy Press, Washington, DC., 1984) and dairy (NRC, 1971 NRC - National Research Council. 1971. Nutrient requirements of dairy cattle. 4th ed. Nutrient requirements of domestic animals. National Academy Press, Washington, DC., 1989) cattle and mathematically describing rumen fermentation (NRC, 1985 NRC - National Research Council. 1985. Ruminant nitrogen usage. National Academy Press, Washington, DC., 1989, 1996) provided the equations needed to begin predicting requirements for each primary physiological function (maintenance, growth, pregnancy, lactation, rumen fermentation, intestinal digestion and absorption, and metabolism).
The seventh and most recent revision of the beef NRC was released in 1996 (NRC, 1996 NRC - National Research Council. 1996. Nutrient requirements of beef cattle. 7th ed. Nutrient requirements of domestic animals. National Academy Press, Washington, DC.) and updated in 2000 (NRC, 2000 NRC - National Research Council. 2000. Nutrient requirements of beef cattle. updated 7th ed. Nutrient requirements of domestic animals. National Academy Press, Washington, DC.). These versions of the beef NRC included more complex and mechanistic nutritional models. Similarly, the seventh and most recent revision of the dairy NRC was released in 2001 (NRC, 2001 NRC - National Research Council. 2001. Nutrient requirements of dairy cattle. 7th ed. Nutrient requirements of domestic animals. National Academy Press, Washington, DC.). This version included the concept of degradation kinetics for feed protein to compute readily, potentially, and unavailable protein fractions. In the last two decades, the NRC (1996, 2000, 2001) developed nutrition models for cattle to predict energy, protein and amino acid requirements to support precision feeding, which became a priority due to the need to reduce cost/unit of production while reducing the excretion of excess nutrients, including N, P, and greenhouse gasses to meet government regulations.
The beef NRC. The NRC (2000) NRC - National Research Council. 2000. Nutrient requirements of beef cattle. updated 7th ed. Nutrient requirements of domestic animals. National Academy Press, Washington, DC.has two different approaches to compute MP supply, depending on the level of solution used. The solution level 1 assumes that MP is comprised of 80% of the undegraded intake protein (UIP, also known as RUP) and 64% of MCP. The UIP is a user input value while the MCP is computed as 13% of TDN and corrected for the effect of rumen pH, using physically effective neutral detergent fiber (peNDF) as described by Russell et al. (1992)Russell, J. B.; O'Connor, J. D.; Fox, D. G.; Van Soest, P. J. and Sniffen, C. J. 1992. A net carbohydrate and protein system for evaluating cattle diets: I. Ruminal fermentation. Journal of Animal Science 70:3551-3561.. The solution level 2 uses the Cornell Net Carbohydrate and Protein System (CNCPS) as described by Fox et al. (1992)Fox, D. G.; Sniffen, C. J.; O'Connor, J. D.; Russell, J. B. and Van Soest, P. J. 1992. A net carbohydrate and protein system for evaluating cattle diets: III. Cattle requirements and diet adequacy. Journal of Animal Science 70:3578-3596., Sniffen et al. (1992)Sniffen, C. J.; O'Connor, J. D.; Van Soest, P. J.; Fox, D. G. and Russell, J. B. 1992. A net carbohydrate and protein system for evaluating cattle diets: II. Carbohydrate and protein availability. Journal of Animal Science 70:3562-3577., Russell et al. (1992)Russell, J. B.; O'Connor, J. D.; Fox, D. G.; Van Soest, P. J. and Sniffen, C. J. 1992. A net carbohydrate and protein system for evaluating cattle diets: I. Ruminal fermentation. Journal of Animal Science 70:3551-3561., and O'Connor et al. (1993)O'Connor, J. D.; Sniffen, C. J.; Fox, D. G. and Chalupa, W 1993. A net carbohydrate and protein system for evaluating cattle diets: IV Predicting amino acid adequacy. Journal of Animal Science 71:1298-1311..
The dairy NRC. The MP requirement for lactation (MPl) is computed from net protein (NP) in the milk with 67% efficiency (Eq. [3] and [7]). However, the efficiency of use of MP to NP may not be constant for ruminal N deficient diets (Ruiz et al., 2002) and may be as high as 75% (NRC, 1985). Lapierre et al. (2005)Lapierre, H.; Berthiaume, R.; Raggio, G.; Thivierge, M. C.; Doepel, L.; Pacheco, D.; Dubreuil, P. and Lobley, G. E. 2005. The route of absorbed nitrogen into milk protein. Animal Science 80:11-22. analyzed 14 studies (33 treatment means) and reported an average apparent N digestibility of 65%, which is the efficiency adopted by the beef NRC (2000) (Eq. [7]). The NRC (2001) recommended the use of essential AA (EAA) requirement for methionine and lysine as 2.2 to 2.4% and 6.6 to 7.2% of MP, respectively, with an optimum lysine:methionine ratio of 3 to further fine tune diet formulation for lactating dairy cows. The NRC (2001) also adopted a variable rumen-degradable protein (RDP)/RUP based on the kinetics of in situfermentation of protein as described by Ørskov and McDonald (1979)Ørskov, E. R. and McDonald, I. 1979. The estimation of protein degradability in the rumen from incubation measurements weighted according to rate of passage. Journal of Agricultural Science 92:449-503. (Eq. [1] and [2]):
RDP = a + b × (kd/(kd + kp)), [1]
RUP = b × (kp/(kd + kp)) + c, [2]
in which a is the soluble protein; b is potentially RDP; and c is indigestible protein.
Although this kinetic method provides a more mechanistic modeling approach, it also contains inaccuracies. The soluble protein fraction (a) is comprised of fine particles, intact protein, and non-protein N - NPN, which contains peptides, and it is not completely degraded in the rumen (Gierus et al., 2005Gierus, M.; de Jonge, L. and Meijer, G. A. L 2005 . Physico-chemical characteristics and degradation rate of soluble protein obtained from the washout fraction of feeds. Livestock Production Science 97:219-229.) and between 7 and 13% of the non-ammonia N (NAN) escapes the rumen (Aufrère et al., 2002Aufrère, J.; Graviou, D. and Demarquilly, C. 2002. Protein degradation in the rumen of red clover forage at various stages of growth and conserved as silage or wrapped big bales. Reproduction Nutrition Development 42:559-72.), suggesting a possible overprediction of RDP. Interestingly, Broderick et al. (2010)Broderick, G. A.; Huhtanen, P.; Ahvenjärvi, S.; Reynal, S. M. and Shingfield, K. J. 2010. Quantifying ruminal nitrogen metabolism using the omasal sampling technique in cattle - A meta-analysis. Journal of Dairy Science 93:3216-3230. meta-analyzed data of 32 studies and reported that the NRC (2001) NRC - National Research Council. 2001. Nutrient requirements of dairy cattle. 7th ed. Nutrient requirements of domestic animals. National Academy Press, Washington, DC.underpredicted RDP (i.e., overpredicted RUP) by 22% than observed omasal values. This discrepancy may be due to incorrect prediction of fractional passage rate (kp) or microbial protein, which is assumed to be 130 g MCP per kg of TDN discounted for that not degraded in the rumen. Additionally, the NRC (2001) committee recommended estimating TDN by using an empirical equation similar to that proposed by Weiss et al. (1992)Weiss, W. P.; Conrad, H. R. and St Pierre, N. R. 1992. A theoretically-based model for predicting total digestible nutrient values of forages and concentrates. Animal Feed Science Technology 39:95-110.. These two approaches entail a calculation disconnection between energy and protein in the rumen (i.e., predicted RDP and RUP with Eq. [1] and [2] are not explicitly used in the prediction of TDN), posing another level of difficulty in formulating and optimizing rations.
Requirement for maintenance. The dairy NRC (2001) NRC - National Research Council. 2001. Nutrient requirements of dairy cattle. 7th ed. Nutrient requirements of domestic animals. National Academy Press, Washington, DC. uses the factorial approach by including equations for scurf, urinary, metabolic fecal CP, and endogenous requirements in predicting the MP required for maintenance (MPm), whereas the beef NRC (2000) NRC - National Research Council. 2000. Nutrient requirements of beef cattle. updated 7th ed. Nutrient requirements of domestic animals. National Academy Press, Washington, DC. uses a much simpler approach as shown in Eq. [3]:

in which CW is conceptus weight, kg; MPBact is MP supplied by microbial protein, g/d; and MPEndo is endogenous MP (i.e., 0.4×EndoCP).
Requirement for growth. The dairy NRC (2001) NRC - National Research Council. 2001. Nutrient requirements of dairy cattle. 7th ed. Nutrient requirements of domestic animals. National Academy Press, Washington, DC. uses the equations developed by the beef NRC (2000) to predict growth requirements for NP (NPg). These equations predict the protein required for growth from equivalent shrunk BW (EqSBW), retained energy (RE), and shrunk weight gain (SWG). The EqSBW uses a scaling approach to determine the BW of the actual animal that is equivalent in composition to the medium-frame size steer used to develop the California NE system (Lofgreen and Garrett, 1968Lofgreen, G. P. and Garrett, W. N. 1968. A system for expressing net energy requirements and feed values for growing and finishing beef cattle. Journal of Animal Science 27:793-806.). The MPg is computed based on NPg and an efficiency of use that depends on EqSBW as shown in Eq. [4] and [5]:
NPg = SWG × (268 − 29.4 × RE/SWG), [4]

Requirement for lactation. The dairy NRC (2001) NRC - National Research Council. 2001. Nutrient requirements of dairy cattle. 7th ed. Nutrient requirements of domestic animals. National Academy Press, Washington, DC. and beef NRC (2000) NRC - National Research Council. 2000. Nutrient requirements of beef cattle. updated 7th ed. Nutrient requirements of domestic animals. National Academy Press, Washington, DC. compute the required MPl using the milk yield (MY) and its content of true protein (TP), but with a different efficiency of conversion of MP to NP for lactation (NPl). The beef NRC (2000) predicts MY based on estimated peak milk production, while the dairy NRC (2001) requires an input.
NPl = MY × Milk TP, [6]

Requirement for pregnancy. The MP required for pregnancy (MPp, g/d) is computed differently between the dairy NRC (2001) NRC - National Research Council. 2001. Nutrient requirements of dairy cattle. 7th ed. Nutrient requirements of domestic animals. National Academy Press, Washington, DC. and beef NRC (2000) NRC - National Research Council. 2000. Nutrient requirements of beef cattle. updated 7th ed. Nutrient requirements of domestic animals. National Academy Press, Washington, DC., as shown in Eq. [8]. Remarkably, the dairy NRC (2001) assumes an efficiency with which MP is used for pregnancy of 33%, whereas the beef NRC (2000) uses 65%. Both systems adjust for calf birth weight (CBW).

in which t is days pregnant (gestating).
Cornell Net Carbohydrate and Protein System (CNCPS)
The most recent complete CNCPS version published is that described by Fox et al. (2003) Fox, D. G.. and Tedeschi, L. O.. 2003. Predicting dietary amino acid adequacy for ruminants. p.389-410. In: Amino acids in animal nutrition. D'Mello, J. P. F., ed. CABI Publishing, Cambridge, MA. and Fox et al. (2004) Fox, D. G..; Tylutki, T. P..; Tedeschi, L. O..; Van Amburgh, M. E..; Chase, L. E..; Pell, A. N..; Overton, T. R.. and Russell, J. B.. 2003. The Net Carbohydrate and Protein System for evaluating herd nutrition and nutrient excretion: Model documentation. Mimeo No. 213. Animal Science Department, Cornell University, Ithaca, NY. 292p., which includes both beef and dairy cattle with two levels of solution (L1 and L2). Modifications have been made to L2 for CPM Dairy as described by Tedeschi et al. (2008) Tedeschi, L. O.; Fox, D. G. and Russell,J. B. 2000b. Accounting for ruminal deficiencies of nitrogen and branched-chain amino acids in the structure of the Cornell net carbohydrate and protein system. p.224-238. In: Proceedings of Cornell Nutrition Conference for Feed Manufacturers, Rochester, NY. New York State College of Agriculture & Life Sciences, Cornell University., CNCPS version 6.0 as described by Tylutki et al. (2008), and CNCPS v. 6.1 as described by Van Amburgh et al. (2010), and to both levels for the Large Ruminant Nutrition System (LRNS) as described by Tedeschi and Fox at http://nutritionmodels.tamu.edu/lrns.html. The original description of the mechanistic ruminal fermentation submodel of the CNCPS was provided by Russell et al. (1992)Russell, J. B.; O'Connor, J. D.; Fox, D. G.; Van Soest, P. J. and Sniffen, C. J. 1992. A net carbohydrate and protein system for evaluating cattle diets: I. Ruminal fermentation. Journal of Animal Science 70:3551-3561., Sniffen et al. (1992)Fox, D. G.; Sniffen, C. J.; O'Connor, J. D.; Russell, J. B. and Van Soest, P. J. 1992. A net carbohydrate and protein system for evaluating cattle diets: III. Cattle requirements and diet adequacy. Journal of Animal Science 70:3578-3596., and O'Connor et al. (1993)O'Connor, J. D.; Sniffen, C. J.; Fox, D. G. and Chalupa, W 1993. A net carbohydrate and protein system for evaluating cattle diets: IV Predicting amino acid adequacy. Journal of Animal Science 71:1298-1311., and the original requirements' submodels were described by Fox et al. (1992)Fox, D. G.; Sniffen, C. J.; O'Connor, J. D.; Russell, J. B. and Van Soest, P. J. 1992. A net carbohydrate and protein system for evaluating cattle diets: III. Cattle requirements and diet adequacy. Journal of Animal Science 70:3578-3596.. Additional modifications and submodels were developed subsequently (Tylutki et al., 1994Tylutki, T. P.; Fox, D. G. and Anrique, R. G. 1994. Predicting net energy and protein requirements for growth of implanted and nonimplanted heifers and steers and nonimplanted bulls varying in body size. Journal of Animal Science 72:1806-1813.; Tedeschi et al., 2000aTedeschi, L. O.; Fox, D. G.; Chase, L. E. and Wang, S. J. 2000a. Whole-herd optimization with the Cornell net carbohydrate and protein system I. Predicting feed biological values for diet optimization with linear programming. Journal of Dairy Science 83:2139-2148.; Tedeschi et al., 2000cTedeschi, L. O.; Fox, D. G. and Russell, J. B. 2000c. Accounting for the effects of a ruminal nitrogen deficiency within the structure of the Cornell net carbohydrate and protein system. Journal of Animal Science 78:1648-1658.; Tedeschi et al., 2001Tedeschi, L. O.; Pell, A. N.; Fox, D. G. and Llames, C. R. 2001. The amino acid profiles of the whole plant and of four residues from temperate and tropical forages. Journal of Animal Science 79:525-532.; Tedeschi et al., 2002aTedeschi, L. O.; Boin, C.; Fox, D. G.; Leme, P. R.; Alleoni, G. F. and Lanna, D. P. D 2002a . Energy requirement for maintenance and growth of Nellore bulls and steers fed high-forage diets. Journal of Animal Science 80:1671-1682.; Tedeschi et al., 2002bTedeschi, L. O.; Fox, D. G.; Pell, A. N.; Lanna, D. P. D. and Boin, C. 2002b. Development and evaluation of a tropical feed library for the Cornell Net Carbohydrate and Protein System model. Scientia Agricola 59:1-18.; Tedeschi et al., 2008Tedeschi, L. O.; Chalupa, W.; Janczewski, E.; Fox, D. G.; Sniffen, C. J.; Munson, R.; Kononoff, P. J. and Boston, R. C. 2008. Evaluation and application of the CPM Dairy nutrition model. Journal of Agriculture Science 146:171-182.). The CPM Dairy was developed for dairy cattle based on the engine of the CNCPS version 5 with additional features as published by Boston et al. (2000) Boston, R. C..; Fox, D. G..; Sniffen, C. J..; Janczewski, R..; Munsen, R.. and Chalupa, W.. 2000. The conversion of a scientific model describing dairy cow nutrition and production to an industry tool: the CPM Dairy project. p.361-377. In: Modelling nutrient utilization in farm animals. McNamara, J. P.; France, J. and Beever, D., eds. CABI Publishing, Oxford. and Tedeschi et al. (2008)Tedeschi, L. O.; Chalupa, W.; Janczewski, E.; Fox, D. G.; Sniffen, C. J.; Munson, R.; Kononoff, P. J. and Boston, R. C. 2008. Evaluation and application of the CPM Dairy nutrition model. Journal of Agriculture Science 146:171-182.. A historical perspective on the development of the CPM Dairy was given by Chalupa and Boston (2003) Chalupa, W. and Boston, R. 2003. Development of the CNCPS and CPM models: The Sniffen affect. p.15-24. In: Proceedings of Cornell Nutrition Conference for Feed Manufacturers, Syracuse, NY. New York State College of Agriculture & Life Sciences, Cornell University.. Similar to the beef NRC (2000) NRC - National Research Council. 2000. Nutrient requirements of beef cattle. updated 7th ed. Nutrient requirements of domestic animals. National Academy Press, Washington, DC., the CNCPS version 5 has two levels of solution. Solution level 1 uses empirical equations to compute MP (Eq. [9] and [10]), in which MCP is computed assuming 13% of discounted TDN (dTDN), 64% availability, and dietary peNDF and RUP is discounted for level of intake above maintenance energy requirement (dRUP) and 80% of availability. The CNCPS uses the neutral detergent fiber (NDF) content and feed particle size to predict ruminal pH and its impact on microbial growth.
MP = dTDN × DMI × 0.13 × 0.64 × peNDF f + dRUP × CP ×DMI × 0.8, [9]

Solution level 2 uses the fractionation of protein, fractional rates of ruminal degradation and ruminal passage, MCP using the microbial growth submodel (Russell et al., 1992Russell, J. B.; O'Connor, J. D.; Fox, D. G.; Van Soest, P. J. and Sniffen, C. J. 1992. A net carbohydrate and protein system for evaluating cattle diets: I. Ruminal fermentation. Journal of Animal Science 70:3551-3561. ; Tedeschi et al., 2000bTedeschi, L. O.; Fox, D. G. and Russell, J. B. 2000c. Accounting for the effects of a ruminal nitrogen deficiency within the structure of the Cornell net carbohydrate and protein system. Journal of Animal Science 78:1648-1658.), and intestinal digestibility to compute MP. The MCP yield is predicted by two groups: those that grow slowly on fiber carbohydrates (FC) and those that grow more rapidly on non-fiber carbohydrates (NFC). Each feed carbohydrate (CHO) fraction (A is sugars, B1 is starch and pectins, B2 is available NDF, and C is unavailable fiber) and protein (PROT) fraction (A is NPN, B1 is soluble true, B2 is non-cell wall, B3 is available cell wall, and C is unavailable cell wall) has their own fractional degradation rate (kd). Undegraded fractions flow out of the rumen with either the solid or the liquid kp. In CNCPS version 6 (Tylutki et al., 2008Tylutki, T. P.; Fox, D. G.; Durbal, V. M.; Tedeschi, L. O.; Russell, J. B.; Van Amburgh, M. E.; Overton, T. R.; Chase, L. E. and Pell, A. N. 2008. Cornell Net Carbohydrate and Protein System: A model for precision feeding of dairy cattle. Animal Feed Science and Technology 143:174-202.), the CHO fractions are expanded to provide separate pools for organic and volatile fatty acids and soluble fiber as documented by Lanzas et al. (2007a)Lanzas, C.; Sniffen, C. J.; Seo, S.; Tedeschi, L. O. and Fox, D. G. 2007a. A revised CNCPS feed carbohydrate fractionation scheme for formulating rations for ruminants. Animal Feed Science and Technology 136:167-190. and new kp developed by Seo et al. (2006)Seo, S.; Tedeschi, L. O.; Schwab, C. G. and Fox, D. G. 2006. Development and evaluation of empirical equations to predict feed passage rate in cattle. Animal Feed Science and Technology 128:67-83.. In CNCPS version 6.1 (Van Amburgh et al., 2010 Van Amburgh, M. E.; Chase, L. E.; Overton, T. R.; Ross, D. A.; Rechtenwald, R. J.; Higgs, R. J. and Tylutki, T. P. 2010. Updates to the Cornell Net Carbohydrate and Protein System v6.1 and implications for ration formulation. p.144-159. In: Proceedings of Cornell Nutrition Conference for Feed Manufacturers, Syracuse, NY. New York State College of Agriculture & Life Sciences, Cornell University.), peptides are shifted from the NPN to the soluble protein fraction that degrades with a reduced kd, and the liquid kp is used to predict the proportion of this fraction that passes undegraded from the rumen, as documented by Lanzas et al. (2008)Lanzas, C.; Broderick, G. A. and Fox, D. G. 2008. Improved feed protein fractionation schemes for formulating rations with the Cornell Net Carbohydrate and Protein System. Journal of Dairy Science 91:4881-4891..
Requirement for maintenance. The CNCPS uses the factorial approach to compute MPm: urinary protein (term 1 in Eq. [11]), scurf protein (term 2 in Eq. [11]), and metabolic fecal protein (term 3 in Eq. [11]), which is assumed to be 9% of indigestible dry matter (IDM). The IDM can be computed as one minus total tract digestibility of the DM, multiplied by DMI to obtain IDM as g/d. Like the NRC (2001), the efficiency of MPm to NP for maintenance (NPm) is assumed to be 67%.
MPm = (2.75 × SBW 0.5)/0.67 + (0.20 × SBW 0.6)/0.67 + 0.09 × IDM. [11]
Requirement for growth. The NPg is computed as shown in Eq. [4] and MP for growth (MPg) with the beef NRC (2001) (Eq. [5]).
Requirement for lactation. It is identical to the dairy NRC (2001) and beef NRC (2000) NRC - National Research Council. 2000. Nutrient requirements of beef cattle. updated 7th ed. Nutrient requirements of domestic animals. National Academy Press, Washington, DC..
Requirement for pregnancy. It is identical to the dairy NRC (2001) NRC - National Research Council. 2001. Nutrient requirements of dairy cattle. 7th ed. Nutrient requirements of domestic animals. National Academy Press, Washington, DC. for dairy cattle, but the CNCPS uses an efficiency of use of MPp of 50% for beef cattle, whereas in the beef NRC (2000) NRC - National Research Council. 2000. Nutrient requirements of beef cattle. updated 7th ed. Nutrient requirements of domestic animals. National Academy Press, Washington, DC. it is 65% in computing NE for pregnancy (NPp).
Detailed description of the AA submodel was given by Fox and Tedeschi (2003) Fox, D. G.. and Tedeschi, L. O.. 2003. Predicting dietary amino acid adequacy for ruminants. p.389-410. In: Amino acids in animal nutrition. D'Mello, J. P. F., ed. CABI Publishing, Cambridge, MA.. One of the key challenges in the AA submodel is the determination of efficiency of use of specific AA. In the CNCPS, each AA has a fixed efficiency of use of MP depending on the physiological stage of the animal (i.e., maintenance, pregnancy, or lactation), except for growth, which uses a common efficiency of use.
Agricultural Research Council (ARC)
As with other national systems, early ARC committees utilized digestible CP (i.e., DP) to compute their protein requirement recommendations, which had limitations when NPN sources were used in protein supplements. The protein equivalent method was proposed to correct the overestimation of the NPN value by assuming that NPN was fully digested but had only half of the value of DP. However, after the 1960s, the DP method was again being used because the protein equivalent method was underestimating the value of NPN in some feedstuffs such as silages (ARC, 1980ARC - Agricultural Research Council. 1980. The nutrient requirements of ruminant livestock. Agricultural Research Council. The Gresham Press, London.). The specific problem with silages was determining the best source of supplemental protein in the diet and other factors such as energy supply, interaction among feeds, and processing levels of feedstuffs, among many others. The next step to overcome most of the problems found with the DP method surfaced in 1965 when the available protein methodology based on the factorial system was used to express the protein requirements for ruminants. In that way, the CP that would meet the nutritional requirements for a given situation would have to have a biological value which would meet the requirements for tissue retention (body and conceptus) or milk production and maintenance (endogenous loss in urine, scurf, and hair). The approach allowed independence of the value in any particular feed (ARC, 1980ARC - Agricultural Research Council. 1980. The nutrient requirements of ruminant livestock. Agricultural Research Council. The Gresham Press, London.), breed or rates of productivity.
The newly proposed protein methodology (i.e., factorial system) also had its limitations that were especially related to the practical separation of the N excreted in the feces into undegraded feed and metabolic N sources. The metabolic sources vary with the extent and type of AA from RUP from the diet. Consequently, a new approach based on the total amount and individual characterization of AA absorbed from the small intestine was proposed (ARC, 1980ARC - Agricultural Research Council. 1980. The nutrient requirements of ruminant livestock. Agricultural Research Council. The Gresham Press, London.). Part of the AA required for the animal would be met by the microbial protein that was synthesized in the rumen and the rest of the requirements would be provided by the protein that had escaped the ruminal fermentation (i.e., RUP). Thus, the concept of MP was born. It is defined as the amount of protein digested (or AA absorbed) in the post-ruminal portion of the alimentary tract and it has been implemented since the 1970s.
The source of those AA can be variable because not all N required by the tissue will be necessarily supplied by the rumen microbial amino acid N. If the amino acid N available for the tissue is greater than the tissue requirements then the tissue requirements are the rumen-degraded N needed by rumen microorganisms. If the N provided by the rumen microorganisms does not suffice the total tissue requirements then extra N has to be provided as rumen-undegraded protein.
The ARC (1980) computes the N transactions into four categories: N needed by the ruminal microbes, amino acid N supplied by ruminal microbes, N from undegraded feedstuffs, and total N required by the animal.
Requirement for rumen-degraded N. The rumen-degraded N (RDN) requirement is the amount of N required for ruminal microbial growth, which is predicted as ME intake (MEI) times a coefficient (1.25) as shown in Eq. [12]. This coefficient was derived from the conversion of ME into digestible organic matter (DOM) and the average microbial N yield/kg of DOM with the following assumptions: (a) the efficiency of conversion of DE into ME was 82% and 19 was MJ of DE present in the diet, leading to a factor of 0.06418 (1/(0.82×19); (b) the proportion of ruminal apparent DOM was 0.65; (c) the microbial N yield was 30 g/kg of DOM; and (d) the efficiency to convert degraded N into microbial N was 100%.
RDN = MEI × 0.06418 × 0.65 × 30 × 1 = 1.25 × MEI. [12]
Available ruminal microbe amino acid N. The amount of ruminal microbe amino acid N available to the ruminant (TMN) is based on RDN requirement and a coefficient (Eq. [13]) that assumed the (a) proportion of amino acid N in ruminal microbial N is 0.80; (b) the apparent absorbability of microbial amino acid N in the small intestine is 0.70; and (c) the efficiency of utilization of absorbed microbial amino acid N is 0.75.
TMN = RDN × 0.80 × 0.70 × 0.75 = 0.42 × RDN = 0.53 × MEI. [13]
Requirement for undegraded dietary N. The undegraded dietary N (UDN) is computed based on the tissue N requirement and the amount of TMN supplied, assuming an efficiency of 0.525 (0.7 × 0.75) as shown in Eq. [14]. If the tissue N required is less than TMN, then UDN is zero because no extra N is required to fulfill the animal's requirement of N. The total N requirement by the animal is the sum of RDN and UDN.

in which TN is total N required by the animal (N retention + N required for lactation + N required for maintenance), in g/d.
Requirement for pre-ruminant calves. The pre-ruminant tissue requirement for protein (CPr) is computed assuming the N retention (RN, g/d), endogenous urinary N (EUN, g/d), dermal N losses (EDN), the apparent N digestibility (0.92 for milk protein, lower value for non-milk protein sources), and efficiency of use of absorbed N (0.80 for milk protein, possibly lower value for some non-milk protein sources), as shown in Eq. [15].
CPr = 6.25 × RN + EUN + EDN /(0.92 × 0.80). [15]
Requirement for growth. The tissue-required protein or total protein requirement (maintenance + growth) is the sum of EUN and EDN, and the net protein required for ADG (NPg).
EUN = 6.25 × (5.9206 log(BW) − 6.76), [16]
EDN = 6.25 × (0.018 BW 0.75), [17]
NPg = ADG × (168.07 − 0.16869 × BW+ 0.0001633 × BW 2)
× (1.12 − 0.1223 × ADG). [18]
A 10% increase is recommended for bulls and large (late maturity) breeds, and a 10% discount is recommended for heifers and small (early maturity) breeds. The conversion of empty BW (EBW) to live BW is BW = 1.09 × (EBW + a), in which a is the weight of the gut fill content (4 for high concentrate diets, 14 for green forages, pelleted dry forages and many mixed diets, and 25 for long dried roughages).
Requirements for lactation and pregnancy. The requirement for lactation and pregnancy include EUN (Eq. [16]), EDN (Eq. [17]), protein secreted in the milk (Eq. [19]) for lactating animals, and gravid uterus for pregnant animals (Eq. [20] and [21]), assuming a calf birth weight of 40 kg.
NPl = MY × CP in milk, [19]
NPp (g/d) = TPt × 0.03437 × e−0.00262×t, [20]
log TPt = 3.707 − 5.698 × e−0.00262×t, [21]
in which t is the number of days from conception.
Agriculture and Food Research Council (AFRC)
The AFRC (1993)AFRC - Agricultural, and Food Research Council. 1993. Energy and protein requirements of ruminants. Agricultural and Food Research Council. CAB International, Wallingford, UK. is a revision of the ARC (1965, 1980) that was originally released as a series of publications by the AFRC committee (AFRCAFRC - Agricultural, and Food Research Council 1987a. AFRC Technical Committee on Responses to Nutrients, Report 1: Characterisation of feedstuffs: energy. Nutrition Abstracts and Reviews (Series B) 57:507-523., 1987a AFRC - Agricultural, and Food Research Council 1987b. AFRC Technical Committee on Responses to Nutrients, Report 2: Characterisation of feedstuffs: nitrogen. Nutrition Abstracts and Reviews (Series B) 57:713-736., b, 1988 AFRC - Agricultural, and Food Research Council 1988. AFRC Technical Committee on Responses to Nutrients, Report 3: characterisation of feedstuffs: other nutrients. Nutrition Abstracts and Reviews (Series B) 58:549-571., 1990 AFRC - Agricultural, and Food Research Council 1990. AFRC Technical Committee on Responses to Nutrients, Report 5: Nutritive requirements of ruminant animals: energy. Nutrition Abstracts and Reviews (Series B) 60:729-804., 1991 AFRC - Agricultural, and Food Research Council 1991. AFRC Technical Committee on Responses to Nutrients, Report 6: A reappraisal of the calcium and phosphorus requirements of sheep and cattle. Nutrition Abstracts and Reviews (Series B) 61:573-612., 1992 AFRC - Agricultural, and Food Research Council 1992. AFRC Technical Committee on Responses to Nutrients, Report 9: Nutritive requirements of ruminant animals: protein. Nutrition Abstracts and Reviews (Series B) 62:787-835.). Due to its factorial nature, the total MP requirements are computed as the sum of each relevant metabolic function.
Requirement for maintenance. The required MPm (Eq. [22]) is the sum of the endogenous N, scurf, and hair losses. The efficiency of use is 100% (NPm = MPm).
MPm = 2.30 × BW 0.75. [22]
Requirement for lactation. The required MPl (Eq. [23]) are based on the composition of the milk, and the efficiency of use of absorbed AA for milk production is 68%.
MPl = (1/0.68) × milk TP = 1.471 × milk TP. [23]
For dairy and beef cows in the UK, the committee considered a 95% of TP content in milk with mean density of 1.03 kg/L; therefore, MPl can be computed as shown in Eq. [24].
MPl = ((1.41 × CP × 10 × 0.95)/1.03) = 13.57 × CP. [24]
Requirement for growth. The MP and NP required for growth are given by the content of protein in the ADG (Eq. [18]).
The C6 coefficient in Eq. [25] is an adjustment for a medium-size steer so the actual values have to be corrected for maturity (breed) size and gender. A 10% increase is recommended for bulls and large (late maturity) breeds, and a 10% discount is also recommended for heifers and small (early maturity) breeds. The MPg is computed from NPg assuming an efficiency of 59% (1/0.59 = 1.695), as shown in Eq. [25].
MPg = C6 × (168.07 − 0.16869 × BW + 0.0001633 × BW 2)× (1.12 − 0.1223 × ADG) × 1.695 × ADG. [25]
Requirement for pregnancy. The pregnancy requirements for net and metabolizable protein (NPp and MPp, respectively) are computed based on the daily protein retention in the gravid uterus tissue, assuming an efficiency of use of 85% (Eq. [26] to [28]).
NPp = TPt × 34.37 × e−0.00262×t, [26]
log TPt = 3.707 − 5.698 × e−0.00262×t, [27]
MPp = 1.01 × Wc × (TPt × e−0.00262×t ), [28]
in which Wc represents conceptus weight, kg; and t is days.
Requirement for body reserves change. For lactating, growing cows, the AFRC (1993)AFRC - Agricultural, and Food Research Council. 1993. Energy and protein requirements of ruminants. Agricultural and Food Research Council. CAB International, Wallingford, UK. assumed an efficiency of 59% for tissue deposition and 100% for tissue mobilization for the BW change requirements for maintenance and gain, respectively, as shown in Eq. [29].

Feed into Milk (FiM)
The FiM (Thomas, 2004Thomas, C. 2004. Feed into milk: A new applied feeding system for dairy cows: An advisory manual. Nottingham University Press, Nottingham, UK.) has been reported as the most used system in the UK because the recommendations from AFRC (1993)AFRC - Agricultural, and Food Research Council. 1993. Energy and protein requirements of ruminants. Agricultural and Food Research Council. CAB International, Wallingford, UK. were no longer answering the urges of industry and producers. The main concerns were the prediction of DMI, energy standards for cows especially at high levels of production, and the inaccuracy of the MP prediction. The FiM shares the main core calculation of the AFRC (1993) for MP requirements for dairy cows, but with a modified maintenance requirement.
MPm = 4.1 × BW 0.75 + 0.3 × BW 0.6 + 30 × DMI − 0.5 × (DMTP/0.8 − DMTP) + 2.34 × DMI, [30]
in which DMTP is the digestible MTP.
In the AFRC (1993)AFRC - Agricultural, and Food Research Council. 1993. Energy and protein requirements of ruminants. Agricultural and Food Research Council. CAB International, Wallingford, UK., FME has been reported unsatisfactory to estimate the energy supply to the ruminal microbes because it is an imprecise estimate of the ME and includes undegraded carbohydrates and proteins that do not provide available energy in the rumen. The FiM adopted adenosine triphosphate yield and the effective degradable N. For each feed in the ration, the first limiting potential MCP calculated from either adenosine triphosphate yield or effective degradable N is used.
Commonwealth Scientific and Industrial Research Organization (CSIRO)
The CSIRO (1990CSIRO - Commonwealth Scientific and Industrial Research Organization. 1990. Feeding standards for Australian livestock. Ruminants. Commonwealth Scientific and Industrial Research Organization, Melbourne, Australia., 2007 CSIRO - Commonwealth Scientific and Industrial Research Organization. 2007. Nutrient requirements of domesticated ruminants. Commonwealth Scientific and Industrial Research Organization, Collingwood, VIC.) also uses the factorial approach to predict requirements and supply of N by ruminants, and it is a modification of the ARC (1965ARC - Agricultural Research Council. 1965. The nutrient requirements of farm livestock. No. 2, Ruminants. H.M. Stationery Office, London, UK., 1980) and AFRC (1993) for Australian conditions. The conversion factor adopted to convert N to CP was 6.25 except for the milk protein, which was 6.38. Since 1990, the CSIRO has divided the intake of protein in two fractions: RDP and undegraded dietary protein (UDP). The RDP is the sum of all N in the rumen/reticulum that can be assimilated by microbes, including dietary protein, recycling urea (through saliva and rumen wall diffusion, which is assumed to offset intermittent inadequacies of RDP for short periods) and sloughed cell from the rumen/reticulum epithelium; it is composed mainly of peptides, amino acids, and ammonia. Differently from other systems, the CSIRO (2007) CSIRO - Commonwealth Scientific and Industrial Research Organization. 2007. Nutrient requirements of domesticated ruminants. Commonwealth Scientific and Industrial Research Organization, Collingwood, VIC. did not evaluate the kinetics of these components separately. Thus, the entire N in the RDP is the source of N for microbial protein synthesis, which they define as MCP. The UDP contains all N sources from the diet that were not available for microorganism assimilation and eventually escaped the rumen. This fraction is estimated by using models of degradation and auxiliary analysis of neutral and acid detergent insoluble proteins, as shown in Eq. [31] to [33].
dg = a + b × (1 − exp(−c × t)), [31]
Edg = a + b × c/(c + kp), [32]
Udg = b × kp/(c+ kp) + d, [33]
in which dg is degradability; a is the soluble component of the CP, which disappears rapidly; a + b is the total amount of potentially degradable CP in the feed; c is the rate of disappearance, per h, of the CP in the component b; Edg is effective degradation; Udg is the fraction of protein escaping undegraded from the rumen; and d is the fraction of protein that is completely indigestible.
Alternatively, it can be estimated using the feed composition (Eq. [34]). The UDP added to MCP multiplied by their small intestinal digestibility coefficients represent the truly digestible protein leaving the rumen (DPLS; Eq. [36]).
Edg = (0.9 − 2.4 × k) × (CP − 0.059 × NDF)/CP, [34]
UDP = ADIP + (NDIP − ADIP) × (kp/(kp + c)), [35]
DPLS = a × (0.85 × b × FOM) + c × (UDP), [36]
in which a, b, and c are digestibility coefficients.
The CSIRO (2007) CSIRO - Commonwealth Scientific and Industrial Research Organization. 2007. Nutrient requirements of domesticated ruminants. Commonwealth Scientific and Industrial Research Organization, Collingwood, VIC. ignored the endogenous CP contribution to this pool and discards 15% of protein from MCP because that fraction contains nucleic acids and other non-AA nitrogen (NAAN) compounds that the ruminant animal does not use. In addition, 25% of its protein is not available because is indigestible microbial cell wall, resulting in 60% of MCP being truly absorbed. For the UDP digestibility, two equations, one for concentrate supplement and another for forages, are used to estimate MCP yield. The MCP yield (Eq. [37]) is dependent on the rumen-fermentable ME (FME) and level of feeding, represented as a multiple of ME required for maintenance. The FME is adopted rather than other variables (e.g., DOM) because FME excludes energy substrates (e.g., lipid, RUP, and acids from silage fermentation) that are not available to the microbes in the rumen or provide little energy to them.
MCP = FME × (7 + 6 × (1 − exp(−0.35 × L))). [37]
For fresh temperate forages, Eq. [37] is corrected by an expression that depends on the latitude and day of the year to account for the effects of location and season (Eq. [38]). For tropical forages, there is no correction for season effects, but the intercept of Eq. [37] is reduced by one unity due to the lower efficiency of synthesis for these feeds when compared with temperate forages.
MCP = FME × (7 + 6 × (1 − exp(−0.35 × L))) × (1.0 + 0.1 × ( λ × sin(0.0172 × t)/40)), [38]
MCP = FME × (6 + 6 × (1 − exp(−0.35 × L))). [39]
in which λ is the latitude (negative for the south hemisphere) and tis the day of the year.
Requirement for maintenance. The maintenance requirements are the sum of protein lost through excreta and skin. The CSIRO (1990CSIRO - Commonwealth Scientific and Industrial Research Organization. 1990. Feeding standards for Australian livestock. Ruminants. Commonwealth Scientific and Industrial Research Organization, Melbourne, Australia., 2007 CSIRO - Commonwealth Scientific and Industrial Research Organization. 2007. Nutrient requirements of domesticated ruminants. Commonwealth Scientific and Industrial Research Organization, Collingwood, VIC.) adopted different equations to estimate the endogenous protein losses. The main reason is that the equation used by the ARC (1980)ARC - Agricultural Research Council. 1980. The nutrient requirements of ruminant livestock. Agricultural Research Council. The Gresham Press, London. to predict total endogenous N loss based on BW gives unrealistic results when applied to common scenarios in Australia with cattle surviving on poor-quality pastures. Even with a diet with much better quality than those, the animal would have a protein deficiency status. However, the CSIRO (1990, 2007) adopted the same equation presented by the ARC (1980) to predict endogenous urinary protein (EUP; Eq. [40]), and recommended a reduction of 20% for B. indicus cattle.
EUP = 16.1 × ln (BW) − 42.2). [40]
The estimated EUP obtained with Eq. [40] is lower than that obtained with the CNCPS (Fox et al., 2004Fox, D. G.; Tedeschi, L. O.; Tylutki, T. P.; Russell, J. B.; Van Amburgh, M. E.; Chase, L. E.; Pell, A. N. and Overton, T. R. 2004. The Cornell Net Carbohydrate and Protein System model for evaluating herd nutrition and nutrient excretion. Animal Feed Science and Technology 112:29-78.). The experimental data used to develop the equation used by ARC (1980) was collected from animals receiving diets with little or no protein, which probably underestimates the excretion on higher N diets, and may explain the difference when compared with the CNCPS. The endogenous fecal loss (EFP; Eq. [41]) is computed using the work of Hulme et al. (1986)Hulme, D. J.; Kellaway, R. C.; Booth, P. J. and Bennett, L. 1986. The CAMDAIRY model for formulating and analysing dairy cow rations. Agricultural Systems 22:81-108.:
EFP = 15.2 × DMI. [41]
Based on experimental confirmation of the protein requirements for dairy cattle provided by the NRC (1978) NRC - National Research Council. 1978. Nutrient requirements of dairy cattle. 5th ed. Nutrient requirements of domestic animals. National Academy Press, Washington, DC., when it allowed an EFP of 15.2 g/kg of DMI, the estimates become similar to other studies that evaluated the EFP. The dermal loss (ED) is computed in the same way as ARC (1980).
Requirement for pregnancy. The requirement for pregnancy follows the ARC (1980).
Requirement for growth. The protein gained or lost (g/kg) is a function of breed, relative weight (BW/standard reference weight, with a maximum of 1), and level of nutrition as a multiple of ME required for maintenance (Eq. [42]). In addition, the protein gain or loss can be assessed based on the variation in the BCS (Eq. [43]).

CPg = EWG × (d − f × BCS), [43]
in which b is 120 for Charolais, Simmental, Chianina, Maine Anjou, Limousin, and Blonde d'Aquitaine, and 140 for all other beef breeds;Z is the proportion of BW relative to the standard body weight, with a maximum value of 1; d is 144 for Charolais, Simmental, Chianina, Maine Anjou, Limousin, and Blonde d'Aquitaine, 124 for all other beef breeds and 119 for dairy cattle; R is an adjustment for rate of gain or loss and is equal to the MEI divided by the MEm requirement minus 2; and f is 17.3 for beef cattle and 10.4 for dairy cattle. The body condition score (BCS) varies from 0 to 5 for beef and 1 to 8 for dairy cattle, in which 0 and 1 are emaciated animals and 5 and 8 are very fat animals, respectively.
Requirement for lactation. The requirement for lactation follows the ARC (1980).
Requirement for pre-ruminant calves. Because of the absence of significant microbial activity, the requirements are based on the protein digestibility of the feed (for milk, 92%) and a constant efficiency of use of 0.80. The other requirements such as gain and maintenance are equal to ruminants except for the fecal endogenous losses that adopted the value of 12 g/kg of DMI.
Institut National de la Recherche Agronomique (INRA)
The French system, developed by the Institut National de la Recherche Agronomique (INRA, 1989INRA - Institut National de la Recherche Agronomique. 1989. Ruminant nutrition. Recommended allowances and feed tables. Institut National de la Recherche Agronomique, John Libbey Eurotext, Montrouge, France., 2007), adopted a different approach that prioritizes the maximization of forage intake. Therefore, the concentrate portion of the diet is used for diet formulation if the forage itself does not offset the energy and protein requirements. The basic unit of this system is the digestible protein at the intestinal level (PDI), which is divided into two categories: the protein contribution for a diet in which energy is the limiting nutrient to microbial protein synthesis (PDIE, Eq. [44]) and the protein contribution for a diet in which there is a deficiency of N (PDIN, Eq. [45]). Together, they represent the sum of the undegraded protein from the diet (PDIA, Eq. [46]) and the protein synthesized in the rumen by the microbial population (PDIM, Eq. [47]). The amount of PDIM is limited by the fermentable energy (PDIME) and degradable protein (PDIMN) in the diet. The protein degradability is estimated by the in situ and in sacco techniques and is essential for the calculation of PDIA and PDIMN, the latter being one multiplied by 0.576 to correct for digestibility and N availability derived from ruminal microbes to the intestine.
PDIE = PDIA + PDIME, [44]
PDIN = PDIA + PDIMN, [45]
PDIA = CP × [1.11 × (1 − a)] × b, [46]
PDIM = CP × [1.11 × (1 − a)] × 0.9 × 0.8 × 0.8, [47]
in which a is protein degradability and b is intestinal digestibility of AA.
The PDIA is also adjusted for the digestibility of protein in the intestine, which is estimated by the protein not digested in the lower digestive tract. This digestibility is determined using the mobile nylon bags technique and the digestibility of the organic matter (OM). Otherwise, the PDIME is estimated through the fermentable OM (FOM), which is the result of the subtraction of ether extract (EE), RUP, and silage acids from the total DOM (TDOM). Then, PDIME is calculated as shown in Eq. [48].
PDIME = FOM × 0.145 × 0.8 × 0.8, [48]
According to the INRA system, a diet meets the protein requirement when the dietary PDIE and PDIN are provided in equal amounts, meaning that the rumen microbe requirements for energy and N had been met. This condition is almost impossible to be achieved in practical situations; therefore, it is accepted that there will be some difference between these fractions, since both exceed the required PDI. This accepted difference varies with the animal category. For example, a dairy cow with MY greater than 25 but less than 35 kg is allowed a difference of -4 while a growing beef steer older than 2 years of age is allowed a -18 in favor of PDIE.
The dairy cattle requirements for MP, as in others systems, is computed using the factorial approach in which the total requirement of protein for dairy cattle is the sum of the requirements for maintenance, growth (primiparous or young animals), lactation, and pregnancy.
Requirement for maintenance. The PDI requirement for maintenance for dairy cattle is computed as 3.25 g/BW0.75, which does not include physical activity. For primiparous or females younger than 40 months, the daily maintenance requirements is increased by 422 g of PDI minus 10.4 times the age in months, as shown in Eq. [49]:
BesPDIc = 422 − (10.4 × Age), [49]
in which BesPDIc is the requirement for maintenance.
Requirement for lactation. The PDI requirements for lactation were based on the MY (kg), milk TP content (g), and the fixed efficiency of use of 64% (Eq. [50]).
BesPDIPL = (MY × TP)/0.64, [50]
in which BesPDIPL is the requirement for milk production.
Requirement for pregnancy. The PDI requirements for early pregnancy are low but increase rapidly in the last three months of gestation. For pregnant cows with low MY or during the dry period, the pregnancy requirement is easily met by rations usually fed. The requirement follows an exponential function of the week of pregnancy and CBW (Eq. [51]).
BesPDIG = 0.07 × CBM × e (0.11×WIP), [51]
in which BesPDIG is the requirements for pregnancy; and WIP is week of pregnancy.
Requirement for amino acids. The high demand for protein for lactation can make the EAA the first limiting nutrient for milk synthesis. This can be offset by the supplementation of EAA in the fixed proportions in relation to the PDIE required as follows: methionine, 2.5%; lysine, 7.3%; leucine, 8.9%; and histidine, 3.0 to 3.5% (Rulquin et al., 1993Rulquin, H.; Pisulewski, P. M.; Vérité, R. and Guinard, J. 1993. Milk production and composition as a function of postruminal lysine and methionine supply: a nutrient-response approach. Livestock Production Science 37:69-90.; Rulquin and Vérité, 1993 Rulquin, H.. and Vérité, R.. 1993. Amino acid nutrition of dairy cows: productive effects and animal requirements. p.55-77. In: Recent advances in animal nutrition. Garnsworthy, P. C. and Cole, D. J. A., eds. Nottingham University Press, Nottingham, UK.; Rulquin et al., 1995 Rulquin, H..; Vérité, R..; Guinard, J.. and Pisulewski, P. M.. 1995. Dairy cows' requirements for amino acids. p.143-160. In: Animal science research and development: Moving toward a new century. Ministry and Services Canada, Ottawa, Canada.). Based on this information, the optimum requirement of duodenal flow of lysine to duodenal flow of methionine ratio for dairy cows is 3.0 (Rulquin et al., 1993Rulquin, H.; Pisulewski, P. M.; Vérité, R. and Guinard, J. 1993. Milk production and composition as a function of postruminal lysine and methionine supply: a nutrient-response approach. Livestock Production Science 37:69-90.).
The beef cattle requirements for MP are based on specific parameters of the Gompertz growth curve that was adjusted to 16 different genotypes as described by INRA (1989)INRA - Institut National de la Recherche Agronomique. 1989. Ruminant nutrition. Recommended allowances and feed tables. Institut National de la Recherche Agronomique, John Libbey Eurotext, Montrouge, France.. These parameters were obtained by fitting the Gompertz non-linear function to the BW and body composition of reference animals from different genotypes. The protein composition for animals at different BW is estimated with the Gompertz parameters, allometric relations between body composition, EBW, and ADG. It is also used to predict the composition of the gain for growing animals. Therefore, the requirements for beef cattle are the sum of maintenance protein requirements (3.25 g/kg0.75) and the protein content of the gain divided by an efficiency of conversion of PDI. This coefficient is affected by the sex, age, and genotype, as presented by Geay et al. (1987)Geay, Y.; Micol, D.; Robelin, J.; Berge, P. and Malterre, C. 1987. Recommandations alimentaires pour les bovins en croissance et à l'engais. Bulletin Technique du Centre de Recherches Zootechniques et Veterinaires de Theix 70:173-183..
The Dutch System (DVE/OEB)
The Dutch protein system for dairy cattle, also known as the Wageningen model (Tamminga et al., 1994Tamminga, S.; Van Straalen, W. M.; Subnel, A. P. J.; Meijer, R. G. M.; Steg, A.; Wever, C. J. G. and Blok, M. C. 1994. The Dutch protein evaluation system: the DVE/OEB-system. Livestock Production Sicience 40:139-155.), was developed based on the French system (INRA, 1989INRA - Institut National de la Recherche Agronomique. 1989. Ruminant nutrition. Recommended allowances and feed tables. Institut National de la Recherche Agronomique, John Libbey Eurotext, Montrouge, France.) because it was the most accurate system for predicting milk synthesis under Dutch conditions (Van Straalen et al., 1994Van Straalen, W. M.; Salaun, C.; Veen, W. A. G.; Rijpkema, Y. S.; Hof, G. and Boxem, T. 1994. Validation of protein evaluation systems by means of milk production experiments with dairy cows. Netherlands Journal of Agricultural Science 42:89-104.). The basic unit is the TP digested in the small intestine (DVE), which is the sum of UDP and MCP absorbed in the small intestine minus the endogenous losses due to digestion process (Eq. [52]).
DVE = DVBE + DVME −DVMFE, [52]
in which DVBE is undegraded feed CP digested in the small intestine; DVME is rumen synthesized MCP digested in the small intestine; and DVMFE is endogenous protein losses during the digestion.
Different from other models, the endogenous N losses are discounted from the feed instead of being included in the maintenance requirement, and they are estimated from the total amount of IDM multiplied by a factor of 0.075, which is the result of a loss of 50 g of protein/kg of IDM with an efficiency of re-synthesis of 0.67. The IDM is estimated from the subtraction of DMI minus DOM and digestible inorganic matter. The impact of IDM on endogenous N loses is similar to the approach used by the CNCPS.
The degradation of the feed protein is estimated with the nylon bag technique and assuming a kp of 4.5 %/h for roughages and 6 %/h for concentrates. The digestibility of RUP is estimated with the mobile nylon bag technique and for feeds lacking experimental data, it is calculated using empirical equations. In the Dutch system, the percentage of AA in this fraction is not considered. Like the French system, the microbial growth is estimated from the FOM. However, a correction (0.75 plus 10% of the total starch) is allowed for undegraded starch estimated by the nylon bag technique. For silage products of fermentation (volatile fatty acids), a 50% discount over the total amount due to the inefficiency of energy utilization for microbial growth was adopted. For microbial protein synthesis, the value of 150 g of microbial protein/kg of FOM, which is slightly greater than the value used by the French system (145 g/kg of FOM), was adopted. The reasoning is because the French system does not correct for undegradable starch and due to the greater level of DMI by high-producing cows that improves the microbial synthesis compared to the low DMI of animals during the trials used to derive the French value. For the N in this fraction, it was assumed that 75% are AA and a true digestibility of 85%, resulting in a total digestible MCP of 95.625 g of TP/kg of FOM. Like the French system, it is possible to check for balance between energy and protein availability in the rumen in order to improve the microbial synthesis. The goal is to have a value closer to zero (or slightly greater than zero) for the difference between potential microbial protein synthesis based on the available RDP and the potential MCP yield from the FOM.
Requirement for maintenance. Because the endogenous fecal losses are assigned to the feed, the maintenance cost (DVEM) is the losses of N through the urine and skin, divided by a efficiency of use of 0.67 (Eq. [53]).
DVEM= (2.75 × BW 0.75 + 0.2 × BW 0.6 )/0.67. [53]
Requirement for lactation. The Dutch system is based on production trials performed under Dutch conditions only and it has variable efficiency of milk protein synthesis whereas other systems use a fixed coefficient. This efficiency depends on the diet energy/protein and level of production. Therefore, the protein requirement for milk synthesis is assessed by a quadratic regression with the milk protein production (g/d) as the independent variable (Eq. [54]).
DVEP = 1.396 × GRP + 0.000195 × GRP 2, [54]
in which GRP is milk protein production, in g/d.
Requirements for growth and tissue mobilization. For growth and mobilization of tissue, the Dutch system adopted the efficiencies of 50% (growth and replenish body protein) and 80% for protein mobilized for milk synthesis from AA when a negative energy balance occurs. It is also assumed that from the energy in the body reserves, 10% is derived from protein, which contains 24 MJ/kg. This means that an animal with a negative energy balance of 6.9 MJ/d has a loss of 29 g of protein in products such as milk and the animal has to mobilize 36 g of body protein, compared with 45 g if protein were derived from DVE. On the other hand, for a positive energy balance of 6.9 MJ, the restoration process would require 57 g of protein.
Requirement for pregnancy. The pregnancy requirement for protein is based on the NRC (1985) NRC - National Research Council. 1985. Ruminant nitrogen usage. National Academy Press, Washington, DC. with a double exponential equation that used days pregnant (ranging from 141 to 281) as the independent variable and a fixed efficiency of protein use of 50% (Eq. [55]).
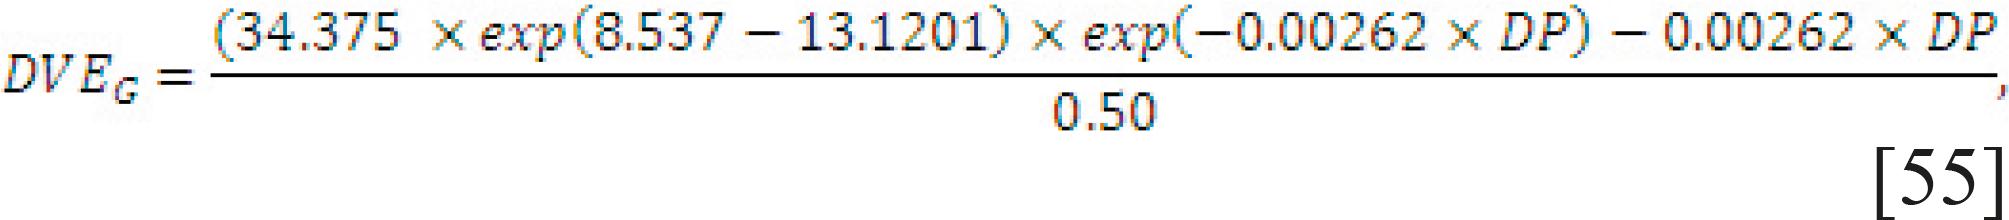
in which DP is days after conception, from 141 to 281.
A Brazilian System (BR-Corte)
The first version of a Brazilian system for nutritional requirements of zebu cattle (Bos indicus and crosses) was published in 2006 as the result of an effort of the research group at Universidade Federal de Viçosa (Valadares Filho et al., 2006b Valadares Filho, S. C.; Paulino, P. V. R.; Magalhães, K. A.; Paulino, M. F.; Detmann, E.; Pina, D. S. and Azevedo, J. A. G. 2006b. Tabelas de composição de alimentos e exigências nutricionais de zebuínos: Dados brasileiros. p.47-80. In: Proceedings of the 5th International Symposium of Beef Production (SIMCORTE) . Suprema Gráfica e Editora Ltda., Viçosa, MG, Brazil .). The core database was composed mainly of empirical data obtained from several trials using the comparative slaughter technique conducted at UFV since the 1990s (Valadares Filho et al., 2006a Valadares Filho, S. C.; Paulino, P. V. R. and Magalhães, K. A. 2006a. Exigências nutricionais de zebuínos e tabelas de composição de alimentos - BR-Corte. 1st ed. Suprema Gráfica Ltda, Viçosa, MG.). The second and revised edition was released in 2010 (Valadares Filho et al., 2010) with a database integration among the universities and research centers that participated in this National Institute of Science and Animal Science Technology (INCT-Ciência Animal) study funded by the National Council of Scientific Development and Technology (CNPq). The microbial N requirement is assumed to be 120 g MCP/kg of TDN and the TDN is computed based on Detmann et al. (2008)Detmann, E.; Valadares Filho, S. C.; Pina, D. S.; Henriques, L. T.; Paulino, M. F.; Magalhães, K. A.; Silva, P. A. and Chizzotti, M. L. 2008. Prediction of the energy value of cattle diets based on the chemical composition of the feeds under tropical conditions. Animal Feed Science and Technology 143:127-147.. The RDP requirement is assessed by multiplying the MCP by 1.11 and the required UDP (g/d) is computed as shown in Eq. [56]. The total CP requirement is the sum of RDP and UDP.
UDP = [(MP − (MCP × 0.64)]/0.80. [56]
Requirement for maintenance. The original MPm calculation (Eq. [57]) was evaluated with an updated dataset using a meta-analytical regression.
MPm = 4 × BW 0.75. [57]
Requirement for growth. The MPg considers the gender and gain composition. The NPg (Eq. [58]) is computed from empty weight gain (EWG) and RE. The RE is computed for each class differently and the efficiency MPg to NPg is computed depending on the EBW of the animal (Eq. [59]).

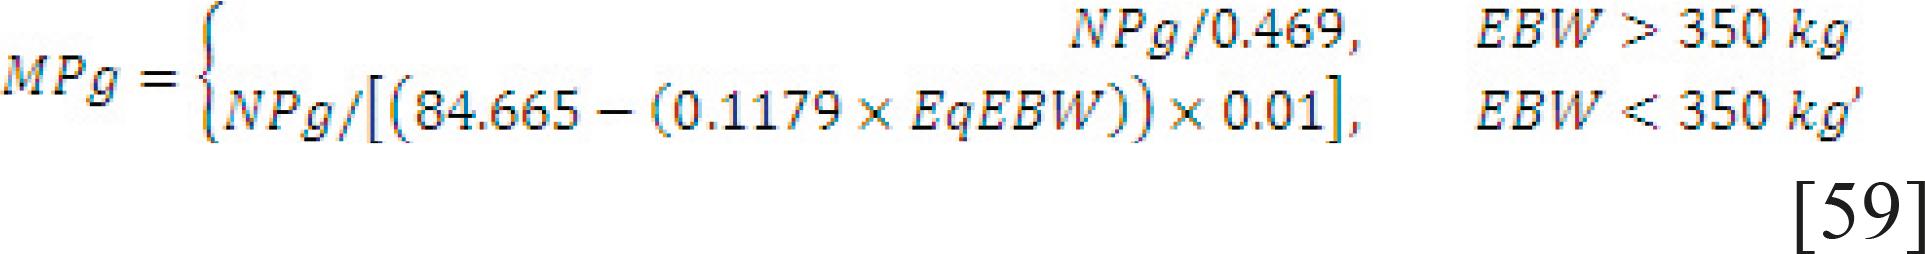
in which EqEBW is obtained by multiplying the EBW by 1.023 or 0.967 for Nellore or crossbred animals, respectively.
The Nordic Feed Evaluation System (NorFor)
This modern system shares the same framework for protein calculations used by other models to calculate the protein contents in feedstuffs and the amount of protein required by the animal even though they may differ in units and factors (i.e., coefficients). The Nordic Feed Evaluation System is called NorFor (Volden, 2011Volden, H. 2011. NorFor - The Nordic Feed Evaluation System. Wageningen Academic Publishers, Wageningen, The Netherlands.). NorFor is a semi-mechanistic system that was developed from 2002 to 2006 to be used by dairy farmers in Denmark, Norway, Iceland, and Sweden. It was the result of an extensive evaluation of feed systems available in Western countries. The protein system in the NorFor was based on the Norwegian model of AA absorbed in the small intestine (AAT) and protein balance in the rumen (PBV) (Volden, 2001Volden, H. 2001. Utvikling av et mekanistisk system for vurdering av fôr til drøvtyggere, AAT-modellen. p.1-41. In: Fôropptak og fôrmiddelvurdering hos drøvtyggere, Quality Hotell Halvorsbøle, Jevnaker.). The AAT-PBV system was the first Nordic model used to formulate rations for dairy cows in practical conditions and, as described by Hvelplund and Madsen (1993)Hvelplund, T. and Madsen, J. 1993. Protein systems for ruminants. Iceland Agriculture Science 7:21-36., the AAT-PBV system differs from other country systems in three aspects. The main differences are (1) it expresses the protein supply by the microorganisms relative to their need for rumen-degradable N, (2) the AA proportion in the undegraded protein is 0.85 for concentrates and 0.65 for forages (nearly all other systems use a factor of 1.0 that could lead to an overestimation of the contribution of amino acid N from undegraded feed protein), and (3) the MCP synthesis in the rumen is related to the amount of totally digested carbohydrates rather than FOM. The NorFor, on the other hand, assumes a variable proportion of AA in the feedstuffs ration and the MCP synthesis depends on the individual nutrient digested for each feedstuff.
The NorFor was also influenced by Karoline (Danfær et al., 2006 Danfær, A.; Huhtanen, P.; Udén, P.; Sveinbjörnsson, J. and Volden, H. 2006. The Nordic Dairy Cow Model, Karoline - Description. p.383-406. In: Nutrient digestion and utilization in farm animals: Modeling approaches. Kebreab, E.; Dijkstra, J.; Bannink, A.; Gerrits, W. J. J. and France, J., eds. CABI Publishing, Cambridge, MA.); thus, NorFor is a combination of the former AAT-PBV system and the Karoline model. The NorFor was developed to be an evaluation system that could take into account the interactions between animal, diet, and feeding level when predicting nutritive values and animal performance so the values in specific production situations can be computed when formulating a diet instead of standard values. The inputs are based on feed characteristics, such as chemical composition and particle size (affecting passage rate), and animal characteristics, such as BW, breed, and stage of lactation. The NorFor has a mechanistic nutrient digestion and metabolism model at the gastrointestinal tract that is the core of the feed ration calculator. The DM content of feedstuff is divided into ash, CP, crude fat, NDF, starch, sugar, fermentation products, and a residual fraction. The CP is divided into soluble, potentially degradable, and indigestible fractions. Ammonia is included in the soluble fraction of the CP, but both CP and residual fraction are corrected for ammonia in the model. The NDF is divided into a total indigestible (iNDF) and a potentially degradable fraction. The starch is divided into soluble, potentially degradable and indigestible fractions. The fermentation products are separated into lactic acid, volatile fatty acids, and alcohols. The kd of the soluble and potentially degradable feed fractions are used to predict RDP and RUP. The outputs include ration energy and protein values, predicted MY, protein production, and nutrient balances in the rumen. The main factors influencing the protein value of the feedstuffs in the rumen are (1) the amount of CP (N×6.25) in the feed, (2) degradation of protein in the rumen, (3) urea that can be recycled into the rumen, (4) the digestibility in the small intestine of non-degraded feed protein and its utilization, (5) microbial protein synthesis and its digestibility, and (6) the utilization of microbial protein. The main factors affecting the animal's requirements are protein content in the milk, endogenous fecal nitrogen, endogenous urinary nitrogen, and tissue mobilization and deposition.
As indicated above, NorFor uses some ruminal fermentation concepts developed in Karoline (Danfær et al., 2006 Danfær, A.; Huhtanen, P.; Udén, P.; Sveinbjörnsson, J. and Volden, H. 2006. The Nordic Dairy Cow Model, Karoline - Description. p.383-406. In: Nutrient digestion and utilization in farm animals: Modeling approaches. Kebreab, E.; Dijkstra, J.; Bannink, A.; Gerrits, W. J. J. and France, J., eds. CABI Publishing, Cambridge, MA.), which is considered a dynamic and mechanistic whole-animal model of a lactating cow that was developed for feed evaluation for teaching and research purposes in the Nordic countries (Danfær et al., 2006 Danfær, A.; Huhtanen, P.; Udén, P.; Sveinbjörnsson, J. and Volden, H. 2006. The Nordic Dairy Cow Model, Karoline - Description. p.383-406. In: Nutrient digestion and utilization in farm animals: Modeling approaches. Kebreab, E.; Dijkstra, J.; Bannink, A.; Gerrits, W. J. J. and France, J., eds. CABI Publishing, Cambridge, MA.). It is composed of two sub-models: digestive (digestive process occurring at forestomach, small intestine and hindgut levels) and metabolic (at different levels such as portal drained viscera, liver, extracellular fluid, mammary gland, muscle and connective tissues, and adipose tissue). For dairy cattle, the main input variables are BW, week of lactation (1 to 44), pregnancy day, and planned or potential daily MY. According to Karoline, the feed value can only be precisely assessed by accounting for animal performance, which relies on feeding level, physiological state, and so forth, so many different results could be expected with any variation in a given ration. For growing animals (bulls, steers and heifers), NorFor uses BW and ADG.
The Rostock Feed Evaluation System
The Rostock feed evaluation system came along with the necessity to establish the basis for a system of feed evaluation and requirements of animals with different productivities raised in Germany. The first edition was published in 1971 (Jentsch et al., 2003 Jentsch, W..; Chudy, A.. and Beyer, M.. 2003. Rostock Feed Evaluation System: Reference numbers of feed value and requirement on the base of net energy. Plexus Verlag, Miltenberg-Frankfurt, Germany.). The use of DP was assumed inadequate to express the total amino acid N supplied to the animal because of the lack of accounting for the N conversions in the alimentary tract. Hence, a German working group on protein evaluation was created to develop a feeding system to account for variable degradation of the dietary protein in the rumen, an influence of energy supply on MCP synthesis, and further partition of rumen microbes and animals requirements.
The core of the Rostock system uses the ARC (1980) recommendations, so the tissue requirements are given by the summation of the endogenous losses, dermal losses, body protein deposition, and milk production. The fecal endogenous losses (g/d) are calculated differently (2.91 × DMI), assuming an average duodenal flow of 14.6 g amino acid N/kg DMI in which 70% of the amino acid N are apparently digested in the small intestine and 90% of it are absorbed. Also the requirements for N accretion in pregnant cows are based on studies conducted in Germany as described by Robelin and Daenicke (1980)Robelin, J. and Daenicke, R. 1980. Variations of net requirements for cattle growth with liveweight, liveweight gain, breed and sex. Annales de Zootechnie 29:99-118.. The accretion of conceptus protein (g/d) is calculated as 1.9385 × e0.0108×t, in which t represents the days of pregnancy. The NP requirements for lactation uses a fixed value (34 g CP/kg of fat-corrected milk - FCM), which represents an average of the main breeds used in Germany.
The rumen undegraded protein requirement (UDP = NAN × 6.25 − MCP − Endogenous CP) is calculated with an average value of 80% efficiency of amino acid N utilization and assumes the same 90% absorption at the small intestine level and 70% of the N arriving at the duodenum is presented as amino acid N. So the total CP requirement at the duodenum is calculated as the multiplication of the total tissue requirement by the factor 1.984, which is the reciprocal for an efficiency of utilization of NAN of 80%, with a true digestibility of 90% and containing 70% of amino acid N. For the degradability of the protein, three groups (65, 75, and 85%) were derived from in vivo trials and they accommodate the main feedstuff used in Germany. For animal-origin byproducts, the protein degradability is assumed smaller than 65%. The MCP synthesis was assumed to be 10 g MCP/MJ ME for most of the diets and up to 20% of the microbe's N requirement can be obtained from recycled N. The endogenous protein is 2.4 g N/kg DMI, which represents 67% the DMI reaching the small intestine.
Evaluation of feeding systems
Lactating Dairy Cows
NorFor and the dairy NRC (2001). Broderick and Åkerlind (2012a) Broderick, G. A.. and Åkerlind, M.. 2012a. A comparison of dietary evaluations by the NRC-2001 and Nordic Feed Evaluation systems. p.128-134. In: Proceedings of the 3rd Nordic Feed Science Conference, Uppsala, Sweden. compared the predictions of milk production and milk protein composition of NorFor and the NRC (2001) using the data from five studies. The authors concluded that NorFor was more accurate in predicting MP protein supply and utilization in lactating dairy cows than the NRC (2001) NRC - National Research Council. 2001. Nutrient requirements of dairy cattle. 7th ed. Nutrient requirements of domestic animals. National Academy Press, Washington, DC.. The authors observed that the NRC (2001) model overestimated the RUP supply in the omasum by 22% and underestimated the MCP flows by 26%. The most important difference is that the NRC (2001) NRC - National Research Council. 2001. Nutrient requirements of dairy cattle. 7th ed. Nutrient requirements of domestic animals. National Academy Press, Washington, DC. assumes a constant efficiency of conversion of MP into milk protein (67%), whereas NorFor considers a variable conversion, dropping from 81% at 13 g MP/MJ of NE for lactation (NEl) to 45% at 25 g MP/MJ NEl (Broderick and Åkerlind, 2012b Broderick, G. A.. and Åkerlind, M.. 2012b Efficient protein feeding - How to use modern feed evalation systems. p.19-20 . In: Proceedings of the D & U Conference, Uppsala, Sweden.). Broderick and Åkerlind (2012a) Broderick, G. A.. and Åkerlind, M.. 2012a. A comparison of dietary evaluations by the NRC-2001 and Nordic Feed Evaluation systems. p.128-134. In: Proceedings of the 3rd Nordic Feed Science Conference, Uppsala, Sweden. also pointed out that although both systems rely on in situ approaches to estimate RUP and MP supplies, the NRC (2001) NRC - National Research Council. 2001. Nutrient requirements of dairy cattle. 7th ed. Nutrient requirements of domestic animals. National Academy Press, Washington, DC. uses different kd values for concentrates and forages, whereas NorFor assumes rapid degradation rate for the soluble fraction of protein and uses several passage rates for different types of feed. In addition, the NRC (2001) NRC - National Research Council. 2001. Nutrient requirements of dairy cattle. 7th ed. Nutrient requirements of domestic animals. National Academy Press, Washington, DC. uses a constant efficiency per unit of digestible energy, whereas NorFor uses variable efficiencies derived from the DMI (kg/kg of BW) and the summation of dietary components' fermentable energies to compute MCP.
CNCPS-based models and the dairy NRC (2001). The models evaluated in this section differ in assumptions, level of aggregation, and internal consistency; for example, two models may predict the same total MP supply, but if one has a higher proportion coming from MCP, the lysine:methionine ratio (lysine:methionine) differs. Therefore, the most important consideration is how well the model selected will predict nutrient balances, required supplemental nutrients, and animal performance under the conditions that it will be applied. The data were selected based on adequacy of the inputs needed for the models. All of the models compared were versions that are being used on actual farms by feeding advisors. Predictions of four models - dairy NRC (2001) NRC - National Research Council. 2001. Nutrient requirements of dairy cattle. 7th ed. Nutrient requirements of domestic animals. National Academy Press, Washington, DC., CNCPS version 5.0 solution levels 1 and 2 (Fox et al., 2004Fox, D. G.; Tedeschi, L. O.; Tylutki, T. P.; Russell, J. B.; Van Amburgh, M. E.; Chase, L. E.; Pell, A. N. and Overton, T. R. 2004. The Cornell Net Carbohydrate and Protein System model for evaluating herd nutrition and nutrient excretion. Animal Feed Science and Technology 112:29-78.), and CNCPS version 6.1 (Tylutki et al., 2008Tylutki, T. P.; Fox, D. G.; Durbal, V. M.; Tedeschi, L. O.; Russell, J. B.; Van Amburgh, M. E.; Overton, T. R.; Chase, L. E. and Pell, A. N. 2008. Cornell Net Carbohydrate and Protein System: A model for precision feeding of dairy cattle. Animal Feed Science and Technology 143:174-202.; Van Amburgh et al., 2010 Van Amburgh, M. E.; Chase, L. E.; Overton, T. R.; Ross, D. A.; Rechtenwald, R. J.; Higgs, R. J. and Tylutki, T. P. 2010. Updates to the Cornell Net Carbohydrate and Protein System v6.1 and implications for ration formulation. p.144-159. In: Proceedings of Cornell Nutrition Conference for Feed Manufacturers, Syracuse, NY. New York State College of Agriculture & Life Sciences, Cornell University.) - were used in this evaluation, as applied in four computer programs being used on dairy farms: dairy NRC (2001), Co-operative Feed Dealers (CFD) Dairy version 5 (https://www.cfd.coop/), LRNS, and the Agricultural Modeling and Training Systems (AMTS) (http://agmodelsystems.com/AMTS/), respectively. Table 2 contains a summary of simulations that compare predictions by these models for ME, MP, methionine and lysine supply and balances with the observed data reported by Chen et al. (2011) for the positive and negative controls and the negative control diet + rumen-protected methionine (positive control - PC, negative control - NC, and NC plus rumen-protected methionine (RPM; 9 g methionine), respectively), as summarized below.
Positive controls. The CFD Dairy (i.e., CNCPS version 5 level 1) predicted dTDN and ME supply were approximately 5% higher than the NRC (2001) because of a lower TDN 1x discount, as predicted by the Tedeschi et al. (2005)Tedeschi, L. O.; Fox, D. G. and Doane, P. H. 2005. Evaluation of the tabular feed energy and protein undegradability values of the National Research Council nutrient requirements of beef cattle. Professional Animal Scientist 21:403-415. discount equations. The LRNS predicted a 7.8% higher ME supply than AMTS. The AMTS (i.e., CNCPS version 6.1) predicted a 6.2% lower ME supply than LRNS as a result of not subtracting neutral detergent insoluble N (NDIN) from NDF in estimating NFC, and using individual fatty acid intestinal digestibilities rather than a fixed 95% digestibility for fat. The CFD Dairy and AMTS most accurately predicted energy balance, as evidenced by the predicted versus observed ADG. The MP from bacteria predicted by CFD Dairy was higher than the NRC (2001) NRC - National Research Council. 2001. Nutrient requirements of dairy cattle. 7th ed. Nutrient requirements of domestic animals. National Academy Press, Washington, DC. because of the higher predicted dTDN. The MP from feed was higher for the CFD Dairy, primarily because of a higher % RUP in the CP of distillers grains. Compared with the LRNS, the AMTS predicted lower MP from bacteria because of a lower NFC and carbohydrate A fraction flowing out of the rumen in the liquid pool. However, this was more than offset by a higher RUP supply due to shifting peptides from the protein A to the protein B1 pool, lowering protein A and B1 rates, and using the liquid kp for the protein B1 pool to compute proportion degraded in the rumen. The net effect is a similar total MP supply predicted with AMTS and LRNS models. All models predicted the supply of both methionine and lysine to be adequate. However, the % of MP for both were lower and the lysine:methionine ratio was higher than those recommended by Schwab and Foster (2009) Schwab, C. G.. and Foster, G. N.. 2009. Maximizing milk components and metabolizable protein utilization through amino acid formulation. p.1-15. In: Proceedings of Cornell Nutrition Conference for Feed Manufacturers, Syracuse, NY. New York State College of Agriculture & Life Sciences, Cornell University., Schwab (2012)Schwab, C. 2012. The principles of balancing diets for amino acids and their impact on N utilization efficiency. p.1-15. In: Proceedings of the 23rd Ruminant Nutrition Symposium. University of Florida, Gainsville, FL., and Whitehouse et al. (2009) Whitehouse, N..; Schwab, C..; Tylutki, T..; Luchini, D.. and Sloan, B.. 2009. Comparison of optimal lysine and methionine concentrations in metabolizable protein estimated by the NRC (2001), CPM-Dairy (v.3.0.10) and AMTS.Cattle (v.2.1.1) models. p.103. In: American Dairy Society Association, Montreal, Canada. ADSA., as shown in Table 3.
Negative controls. There was no significant reduction in the amount of milk or milk TP kg or percentage when the diet CP was reduced from 16.8 to 15.6% (Chen et al., 2011Chen, Z. H.; Broderick, G. A.; Luchini, N. D.; Sloan, B. K. and Devillard, E. 2011. Effect of feeding different sources of rumen-protected methionine on milk production and N-utilization in lactating dairy cows. Journal of Dairy Science 94:1978-1988.). However, all models predicted negative MP balances. Assuming the MP supply was first limiting and therefore the actual MP balance was zero for the NC and improved MP efficiency was due to MP for lactation NP, the apparent MP efficiency for NPl varied from 69.8 to 76.7% for the four models. Three of the four models predicted methionine and lysine to be adequate, but as with the PC, the % of MP values were lower and the lysine:methionine ratios were all higher than those recommended in Table 3.
Negative controls plus 9 g RPM. Actual milk production was not different from PC, but milk TP was 0.10 percentage units higher than the PC. All four models predicted large negative MP balances. However, the methionine (% of MP) and the lysine:methionine ratios were similar to those recommended (Table 3). We conclude the increased TP % in milk was due to the improved methionine (% of MP) and lysine:methionine ratio. Except for the NRC (2001) NRC - National Research Council. 2001. Nutrient requirements of dairy cattle. 7th ed. Nutrient requirements of domestic animals. National Academy Press, Washington, DC., which predicted a deficiency of 6 g lysine, all models predicted methionine and lysine supply (g/d) to exceed requirements. Assuming the MP supply was first limiting and therefore the apparent MP balance was 0 for the NC and improved MP efficiency was due to MP for lactation NP, the apparent MP efficiency for the NC + 9 g RPM for the NRC (2001) NRC - National Research Council. 2001. Nutrient requirements of dairy cattle. 7th ed. Nutrient requirements of domestic animals. National Academy Press, Washington, DC., CFD Dairy, LRNS, and AMTS models were 80.7, 75.0, 74.0, and 73.1%, respectively, instead of the fixed 67% used in the model.
Schwab and Foster (2009) Schwab, C..; Whitehouse, N.; Luchini, D. and Sloan, B. 2009. Reevaluation of the breakpoint estimates for the NRC (2001) required concentrations of lysine and methionine in metabolizable protein for maximal content and yield of milk protein. p.103-104. In: American Dairy Society Association, Montreal, Canada. ADSA. concluded that research with lactating dairy cows has shown that increasing predicted concentrations of lysine and methionine in MP to recommended levels increases efficiency of use of MP for milk protein synthesis. The NRC (2001) utilized published data to develop ratios of methionine and lysine required in the MP for lactating dairy cows to optimize milk production. The NRC (2001) NRC - National Research Council. 2001. Nutrient requirements of dairy cattle. 7th ed. Nutrient requirements of domestic animals. National Academy Press, Washington, DC.committee decided that the current knowledge was too limited to develop and test a complete factorial model to predict requirements for metabolizable AA (NRC, 2001; page 81). Therefore, they utilized the dose response approach to predict the optimum ratios of lysine and methionine in the MP to maximize protein content of milk. They found that 7.2% lysine and 2.5% methionine as percent of the MP yielded optimum use of the MP for maintenance and milk protein yield. Their ratios were very similar to the 7.3 and 2.5% for lysine and methionine, respectively reported by Rulquin et al. (1993)Rulquin, H.; Pisulewski, P. M.; Vérité, R. and Guinard, J. 1993. Milk production and composition as a function of postruminal lysine and methionine supply: a nutrient-response approach. Livestock Production Science 37:69-90.. This result is consistent with the concept that when the EAA are absorbed in the profile as required by the animal, the requirements for total EAA are reduced and their efficiency of use for protein synthesis is maximized (Schwab and Foster, 2009 Schwab, C..; Whitehouse, N.; Luchini, D. and Sloan, B. 2009. Reevaluation of the breakpoint estimates for the NRC (2001) required concentrations of lysine and methionine in metabolizable protein for maximal content and yield of milk protein. p.103-104. In: American Dairy Society Association, Montreal, Canada. ADSA.).
Table 3 summarizes the results of a re-analysis of the NRC (2001) NRC - National Research Council. 2001. Nutrient requirements of dairy cattle. 7th ed. Nutrient requirements of domestic animals. National Academy Press, Washington, DC. data by Schwab and Foster (2009) Schwab, C..; Whitehouse, N.; Luchini, D. and Sloan, B. 2009. Reevaluation of the breakpoint estimates for the NRC (2001) required concentrations of lysine and methionine in metabolizable protein for maximal content and yield of milk protein. p.103-104. In: American Dairy Society Association, Montreal, Canada. ADSA. and Schwab et al. (2009)Schwab, C. 2012. The principles of balancing diets for amino acids and their impact on N utilization efficiency. p.1-15. In: Proceedings of the 23rd Ruminant Nutrition Symposium. University of Florida, Gainsville, FL., which included determining the optimal percent in MP and ratios for lysine and methionine for the NRC (2001) model. Also in Table 3 are values from Whitehouse et al. (2009) Whitehouse, N..; Schwab, C..; Tylutki, T..; Luchini, D.. and Sloan, B.. 2009. Comparison of optimal lysine and methionine concentrations in metabolizable protein estimated by the NRC (2001), CPM-Dairy (v.3.0.10) and AMTS.Cattle (v.2.1.1) models. p.103. In: American Dairy Society Association, Montreal, Canada. ADSA., who used this same database to determine the optimal concentrations of lysine and methionine for the CPM Dairy and AMTS models, which are based on CNCPS versions 5 (Fox et al., 2004Fox, D. G.; Tedeschi, L. O.; Tylutki, T. P.; Russell, J. B.; Van Amburgh, M. E.; Chase, L. E.; Pell, A. N. and Overton, T. R. 2004. The Cornell Net Carbohydrate and Protein System model for evaluating herd nutrition and nutrient excretion. Animal Feed Science and Technology 112:29-78.) and 6.1 (Tylutki et al., 2008Tylutki, T. P.; Fox, D. G.; Durbal, V. M.; Tedeschi, L. O.; Russell, J. B.; Van Amburgh, M. E.; Overton, T. R.; Chase, L. E. and Pell, A. N. 2008. Cornell Net Carbohydrate and Protein System: A model for precision feeding of dairy cattle. Animal Feed Science and Technology 143:174-202.; Van Amburgh et al., 2010 Van Amburgh, M. E.; Chase, L. E.; Overton, T. R.; Ross, D. A.; Rechtenwald, R. J.; Higgs, R. J. and Tylutki, T. P. 2010. Updates to the Cornell Net Carbohydrate and Protein System v6.1 and implications for ration formulation. p.144-159. In: Proceedings of Cornell Nutrition Conference for Feed Manufacturers, Syracuse, NY. New York State College of Agriculture & Life Sciences, Cornell University.), respectively. Schwab (2012)Schwab, C. 2012. The principles of balancing diets for amino acids and their impact on N utilization efficiency. p.1-15. In: Proceedings of the 23rd Ruminant Nutrition Symposium. University of Florida, Gainsville, FL.stated "This was done for both of the CNCPS-based models because of their widespread use in the dairy industry and out of concern that users of these models may be incorrectly using recommendations generated using the NRC model". Schwab (2012)Schwab, C. 2012. The principles of balancing diets for amino acids and their impact on N utilization efficiency. p.1-15. In: Proceedings of the 23rd Ruminant Nutrition Symposium. University of Florida, Gainsville, FL. concluded that the differences between the three models in concentration of lysine and methionine required are due to the differences in approaches to predicting supplies of RDP, RUP, MP, and MP-AA. A major factor is the proportion of MP that is from MTP differs; MTP contains concentrations of 7.9% lysine and 2.6% methionine, which exceed their requirements for milk TP and yield (Schwab, 2012Schwab, C. 2012. The principles of balancing diets for amino acids and their impact on N utilization efficiency. p.1-15. In: Proceedings of the 23rd Ruminant Nutrition Symposium. University of Florida, Gainsville, FL.; Van Amburgh et al., 2012 Van Amburgh,M. E..; Ross,D. A..; Higgs, R. J..; Rechtenwald, R. J.. and Chase, L. E.. 2012. Balancing for rumen degradable protein and post-ruminal requirements for lactating cattle using the CNCPS as a basis for evaluation. p.17-31. In: Proceedings of the 23rd Ruminant Nutrition Symposium. University of Florida, Gainsville, FL.).
Schwab (2012)Schwab, C. 2012. The principles of balancing diets for amino acids and their impact on N utilization efficiency. p.1-15. In: Proceedings of the 23rd Ruminant Nutrition Symposium. University of Florida, Gainsville, FL., Chase et al. (2012) Chase, L. E..; Higgs, R. J.. and Van Amburgh, M. E.. 2012. Feeding low crude protein rations to dairy cows - What have we learned? p.32-42. In: Proceedings of the 23rd Ruminant Nutrition Symposium. University of Florida, Gainsville, FL., Van Amburgh et al. (2009) Van Amburgh, M. E.; Overton,T. R.; Chase, L. E.; Ross, D. A. and Rechtenwald, R. J. 2009. The Cornell Net Carbohydrate and Protein System: Current and future approaches for balancing of amino acids. p.28-37. In: Proceedings of Cornell Nutrition Conference for Feed Manufacturers, Syracuse, NY. New York State College of Agriculture & Life Sciences, Cornell University., and Van Amburgh et al. (2012) Van Amburgh,M. E..; Ross,D. A..; Higgs, R. J..; Rechtenwald, R. J.. and Chase, L. E.. 2012. Balancing for rumen degradable protein and post-ruminal requirements for lactating cattle using the CNCPS as a basis for evaluation. p.17-31. In: Proceedings of the 23rd Ruminant Nutrition Symposium. University of Florida, Gainsville, FL. agreed that balancing rations for MP and AA requires the use of a model. Evaluations of the dairy NRC (2001) and CNCPS (O'Connor et al., 1993O'Connor, J. D.; Sniffen, C. J.; Fox, D. G. and Chalupa, W 1993. A net carbohydrate and protein system for evaluating cattle diets: IV Predicting amino acid adequacy. Journal of Animal Science 71:1298-1311.) AA submodels indicated that AA flows to the small intestine could be predicted reasonably well. Fox et al. (2004)Fox, D. G.; Tedeschi, L. O.; Tylutki, T. P.; Russell, J. B.; Van Amburgh, M. E.; Chase, L. E.; Pell, A. N. and Overton, T. R. 2004. The Cornell Net Carbohydrate and Protein System model for evaluating herd nutrition and nutrient excretion. Animal Feed Science and Technology 112:29-78. and (Van Amburgh et al., 2009 Van Amburgh, M. E.; Overton,T. R.; Chase, L. E.; Ross, D. A. and Rechtenwald, R. J. 2009. The Cornell Net Carbohydrate and Protein System: Current and future approaches for balancing of amino acids. p.28-37. In: Proceedings of Cornell Nutrition Conference for Feed Manufacturers, Syracuse, NY. New York State College of Agriculture & Life Sciences, Cornell University.) concluded the CNCPS predicted metabolizable requirements for methionine and lysine for lactation within an acceptable accuracy, since the AA content of milk TP is well established and we have reasonably good efficiencies for absorbed methionine and lysine use for milk production. However, the greatest ongoing concerns all these authors have regarding AA balancing is how well the current models can account for factors that cause variations in supply of RUP and how to account for improved efficiency of use of the MP with improved ratios of methionine and lysine. Van Amburgh et al. (2009) Van Amburgh, M. E.; Overton,T. R.; Chase, L. E.; Ross, D. A. and Rechtenwald, R. J. 2009. The Cornell Net Carbohydrate and Protein System: Current and future approaches for balancing of amino acids. p.28-37. In: Proceedings of Cornell Nutrition Conference for Feed Manufacturers, Syracuse, NY. New York State College of Agriculture & Life Sciences, Cornell University. stated that the first step in balancing for AA is to ensure that the model is capable of predicting MP-allowable milk with good accuracy and precision. In addition to the challenges of predicting MP and AA flows to the small intestine (NRC, 2001 NRC - National Research Council. 2001. Nutrient requirements of dairy cattle. 7th ed. Nutrient requirements of domestic animals. National Academy Press, Washington, DC.; Van Amburgh et al., 2009 Van Amburgh, M. E.; Overton,T. R.; Chase, L. E.; Ross, D. A. and Rechtenwald, R. J. 2009. The Cornell Net Carbohydrate and Protein System: Current and future approaches for balancing of amino acids. p.28-37. In: Proceedings of Cornell Nutrition Conference for Feed Manufacturers, Syracuse, NY. New York State College of Agriculture & Life Sciences, Cornell University.) and their intestinal digestibility (Boucher et al., 2009Boucher, S. E.; Calsamiglia, S.; Parsons, C. M.; Stern, M. D.; Ruiz Moreno, M.; Vazquez-Anon, M. and Schwab, C. G. 2009. In vitro digestibility of individual amino acids in rumen-undegraded protein: The modified three-step procedure and the immobilized digestive enzyme assay. Journal of Dairy Science 92:3939-3950.), the efficiency of use of the MP for lactation decreased from 77 to 50% as MP supply increased (Metcalf et al., 2008Metcalf, J. A.; Mansbridge, R. J.; Blake, J. S.; Oldham, J. D. and Newbold, J. R. 2008. The efficiency of conversion of metabolisable protein into milk true protein over a range of metabolisable protein intakes. Animal 2:1193-1202.). Ruiz et al. (2002)Ruiz, R.; Tedeschi, L. O.; Marini, J. C.; Fox, D. G.; Pell, A. N.; Jarvis, G. and Russell, J. B. 2002. The effect of a ruminal nitrogen (N) deficiency in dairy cows: evaluation of the Cornell net carbohydrate and protein system ruminal N deficiency adjustment. Journal of Dairy Science 85:2986-2999. reported that with N-deficient diets, using an MP for lactation efficiency of 75% resulted in no bias with CNCPS prediction of milk production. However, the NRC (2001) NRC - National Research Council. 2001. Nutrient requirements of dairy cattle. 7th ed. Nutrient requirements of domestic animals. National Academy Press, Washington, DC. and CNCPS versions use the fixed value of 67% for MP efficiency. Despite that fixed value, Van Amburgh et al. (2012) Van Amburgh, M. E.; Chase, L. E.; Overton, T. R.; Ross, D. A.; Rechtenwald, R. J.; Higgs, R. J. and Tylutki, T. P. 2010. Updates to the Cornell Net Carbohydrate and Protein System v6.1 and implications for ration formulation. p.144-159. In: Proceedings of Cornell Nutrition Conference for Feed Manufacturers, Syracuse, NY. New York State College of Agriculture & Life Sciences, Cornell University. reported that CNCPS v. 6.1 predicted the first limiting of ME or metabolizable protein MY with an R2 of 98% and a mean prediction bias of less than 1%.
Growing Beef Cattle
Seven studies conducted either in Brazil or in the United States (Boin and Moura, 1977Boin, C. and Moura, M. P. 1977. Comparação entre dois níveis de proteína bruta e entre dois níveis de energia para zebuínos em crescimento. Boletim de Indústria Animal 34:155-163.; Fox and Cook, 1977 Fox, D. G.. and Cook, R. J.. 1977. Performance of steer calves fed corn silage treated with three sources of anhydrous ammonia. Research Report. No. 328. Michigan State University, East Lansing. p.89-95.; Danner et al., 1980Danner, M. L.; Fox, D. G. and Black, J. R. 1980. Effect of feeding system on performance and carcass characteristics of yearling steers, steer calves and heifer calves. Journal of Animal Science 50:394-404.; Lomas et al., 1982Lomas, L. W.; Fox, D. G. and Black, J. R. 1982. Ammonia treatment of corn silage I. Feedlot performance of growing and finishing steers. Journal of Animal Science 55:909-923.; Abdalla et al., 1988Abdalla, H. O.; Fox, D. G. and Thonney, M. L. 1988. Compensatory gain by Holstein calves after underfeeding protein. Journal of Animal Science 66:2687-2695.; Ainslie et al., 1993Ainslie, S. J.; Fox, D. G.; Perry, T. C.; Ketchen, D. J. and Barry, M. C. 1993. Predicting amino acid adequacy of diets fed to Holstein steers. Journal of Animal Science 71:1312-1319.; Wilkerson et al., 1993Wilkerson, V. A.; Klopfenstein, T. J.; Britton, R. A.; Stock, R. A. and Miller, P. S. 1993. Metabolizable protein and amino acid requirements of growing cattle. Journal of Animal Science 71:2777-2784.) were used to compare the predictions of animal performance using the beef NRC (National Research Council, 2000 NRC - National Research Council. 2000. Nutrient requirements of beef cattle. updated 7th ed. Nutrient requirements of domestic animals. National Academy Press, Washington, DC.), and the levels 1 and 2 of the CNCPS (Fox et al., 2004Fox, D. G.; Tedeschi, L. O.; Tylutki, T. P.; Russell, J. B.; Van Amburgh, M. E.; Chase, L. E.; Pell, A. N. and Overton, T. R. 2004. The Cornell Net Carbohydrate and Protein System model for evaluating herd nutrition and nutrient excretion. Animal Feed Science and Technology 112:29-78.). These studies were selected because they contained adequate information to characterize the animals, feeds, management, and environment in which they were fed. In this dataset, protein was considered to be the first limiting nutrient in 28 treatment means, and hence, if the model predictions of MP were correct, the model would match the observed performance of the animals (Tedeschi et al., 2005Tedeschi, L. O.; Fox, D. G. and Doane, P. H. 2005. Evaluation of the tabular feed energy and protein undegradability values of the National Research Council nutrient requirements of beef cattle. Professional Animal Scientist 21:403-415.). Figure 1 shows the scatter plot of the observed ADG versus model predictions ADG. As concluded by Tedeschi et al. (2005)Tedeschi, L. O.; Fox, D. G. and Doane, P. H. 2005. Evaluation of the tabular feed energy and protein undegradability values of the National Research Council nutrient requirements of beef cattle. Professional Animal Scientist 21:403-415., the solution level 2 of the CNCPS (Fox et al., 2004Fox, D. G.; Tedeschi, L. O.; Tylutki, T. P.; Russell, J. B.; Van Amburgh, M. E.; Chase, L. E.; Pell, A. N. and Overton, T. R. 2004. The Cornell Net Carbohydrate and Protein System model for evaluating herd nutrition and nutrient excretion. Animal Feed Science and Technology 112:29-78.) accounted for more of the variation (92%) than the other models and the mean bias was lower for levels 1 and 2 than when the tabular values of TDN and RUP were used. Tedeschi et al. (2005)Tedeschi, L. O.; Fox, D. G. and Doane, P. H. 2005. Evaluation of the tabular feed energy and protein undegradability values of the National Research Council nutrient requirements of beef cattle. Professional Animal Scientist 21:403-415. also developed an equation to discount RUP for levels of DMI above maintenance. This adjustment is necessary because RUP decreases as DMI increases and most tabular feed RUP were obtained at maintenance level of DMI.
Relationship between observed average daily gain (ADG, kg/d) and predicted ADG using two models (three methods of calculation) of studies in which metabolizable protein was first limiting.
Sensitivity analyses
We selected four of the most commonly used models around the world (AFRC, CSIRO, CNCPS, and INRA) and the BR-Corte as described above and compared their predictions of MP required for growing beef cattle and lactating dairy cows (except for BR-Corte) using the Monte Carlo technique. This technique comprises repeated random sampling from input variables of known distributions to obtain numerical values and distributions of output variables. The output variables are computed from one or more combinations of the input variables. For both simulations (i.e., growing beef cattle and lactating dairy cows), 5,000 iterations were simulated using a Latin hypercube sampling method and normal distributions for the input variables. A diet with 11.7 MJ/kg (approx. 2.79 Mcal/kg) of ME was assumed with a DM digestibility of 76%. The bar plots were built with standardized regression coefficients of the most influential input variables as described by Helton and Davis (2002)Helton, J. C. and F J, Davis.. 2002. . Illustration of sampling-based methods for uncertainty and sensitivity analysis. Risk Analysis 22:591-622. and the Pearson correlations are provided as scatter plots that were used to compare two model predictions at the same time.
Growing beef cattle. For this sensitivity analysis, we used a young bull with a BW of 350±30 kg and ADG of 1.2±0.12 kg/d. A correlation between BW and ADG of -0.5142 was obtained by simulating BW and ADG using the Gompertz function (Eq. [60] and [61]) in which parameters A, B, and C were obtained through a pseudo-randomized normal distribution (1,000 iterations) assuming average values of 200, 1.501 and 0.0025, and standard deviation values of 10, 1, and 7% of the average, respectively. This correlation was obtained from 239 to 462 kg of BW range. The standard reference weight for CSIRO and INRA models was assumed to be 520 kg. For CNCPS, 520 kg was assumed as the final SBW and 435 kg was used as the standard reference weight at 25% empty body fat. For INRA, a linear regression was fitted to estimate the variable MP efficiency conversion to NP based on the values presented by Geay et al. (1987)Geay, Y.; Micol, D.; Robelin, J.; Berge, P. and Malterre, C. 1987. Recommandations alimentaires pour les bovins en croissance et à l'engais. Bulletin Technique du Centre de Recherches Zootechniques et Veterinaires de Theix 70:173-183. (Eq. [62]).
BW = A × exp(B × (1 − exp(−C × t))), [60]
ADG = A × B × C × exp(A × (−exp(−B × t) + B − C ×t)), [61]
Estimated RPDI = 83.287 ± 7.84 - 0.088 ± 0.02 × BW, R 2 = 0.957. [62]
Lactating dairy cow. For this sensitivity analysis, we assumed a non-pregnant, lactating dairy cow at 90 days in milk, BW of 550±55 kg, MY of 32±3.2 kg/d with milk TP of 3.2±0.04% and milk fat of 3.7±0.1%. A correlation matrix from Sieber et al. (1988) was used to take into account the intrinsic relationships among BW, MY, and milk TP and fat (%), as follows: BW and MY = 0.20; BW and milk TP = -0.20; BW and fat = 0.09; MY and milk TP = -0.17; MY and fat = -0.13; and milk TP and fat = 0.30. The correlations with solid non-fat from Sieber et al. (1988)Sieber, M.; Freeman, A. E. and Kelley, D. H. 1988. Relationships between body measurements, body weight, and productivity in Holstein dairy cows. Journal of Dairy Science 71:3437-3445. were used to represent the milk TP correlations in our analysis. The BR-Corte was not included in this simulation, as it does not handle dairy cows.
The probability density plots for MPm, MPg or MPl, and total MP are shown in Figure 2. For the growing beef cattle simulation (Figure 2A), the CSIRO (2007) had the lowest and INRA (2007) and BR-Corte (Valadares Filho et al., 2010 Valadares Filho, S. C.; Marcondes, M. I.; Chizzotti, M. L. and Paulino, P. V. R. 2010. Exigências nutricionais de zebuínos puros e cruzados - BR-Corte. 2nd ed. Suprema Gráfica Ltda, Viçosa, MG.) had the highest predictions of total MP; BR-Corte (Valadares Filho et al., 2010 Valadares Filho, S. C.; Marcondes, M. I.; Chizzotti, M. L. and Paulino, P. V. R. 2010. Exigências nutricionais de zebuínos puros e cruzados - BR-Corte. 2nd ed. Suprema Gráfica Ltda, Viçosa, MG.) had an average prediction for MPm, but the highest for growth. For the lactating dairy cow simulation (Figure 2B), the models overlapped.
Probability density functions of predicted metabolizable protein required for maintenance and production (growth or milk) of (A) growing beef cattle using five models and (B) lactating dairy cows using four models.
The pairwise comparison of probability density, correlation, and bar plots are shown in Figure 3 for the growing beef cattle and in Figure 4 for the lactating dairy cow simulations. Figure 3 shows two distinct groups of model predictions: AFRC (1993)AFRC - Agricultural, and Food Research Council. 1993. Energy and protein requirements of ruminants. Agricultural and Food Research Council. CAB International, Wallingford, UK. and CSIRO (2007) CSIRO - Commonwealth Scientific and Industrial Research Organization. 2007. Nutrient requirements of domesticated ruminants. Commonwealth Scientific and Industrial Research Organization, Collingwood, VIC. had similar total MP predictions (r = 0.919), whereas BR-Corte (Valadares Filho et al., 2010), CNCPS (Fox et al., 2004Fox, D. G.; Tedeschi, L. O.; Tylutki, T. P.; Russell, J. B.; Van Amburgh, M. E.; Chase, L. E.; Pell, A. N. and Overton, T. R. 2004. The Cornell Net Carbohydrate and Protein System model for evaluating herd nutrition and nutrient excretion. Animal Feed Science and Technology 112:29-78.), and INRA (2007) INRA - Institut National de la Recherche Agronomique. 2007. Alimentation des bovins, ovins et caprins. Besoins des animaux. Valeurs des aliments. Editions Quae, Versailles, France. overlapped to some extent with correlation coefficients greater than 0.94. The BW had greater influence in the BR-Corte (Valadares Filho et al., 2010 Valadares Filho, S. C.; Marcondes, M. I.; Chizzotti, M. L. and Paulino, P. V. R. 2010. Exigências nutricionais de zebuínos puros e cruzados - BR-Corte. 2nd ed. Suprema Gráfica Ltda, Viçosa, MG.), CNCPS (Fox et al., 2004Fox, D. G.; Tedeschi, L. O.; Tylutki, T. P.; Russell, J. B.; Van Amburgh, M. E.; Chase, L. E.; Pell, A. N. and Overton, T. R. 2004. The Cornell Net Carbohydrate and Protein System model for evaluating herd nutrition and nutrient excretion. Animal Feed Science and Technology 112:29-78.), and INRA (2007) INRA - Institut National de la Recherche Agronomique. 2007. Alimentation des bovins, ovins et caprins. Besoins des animaux. Valeurs des aliments. Editions Quae, Versailles, France. than in the AFRC (1993) and CSIRO (2007) CSIRO - Commonwealth Scientific and Industrial Research Organization. 2007. Nutrient requirements of domesticated ruminants. Commonwealth Scientific and Industrial Research Organization, Collingwood, VIC. in estimating total MP as shown by the bar plots in Figure 3. Figure 4 shows that all models predicted total MP required for lactating dairy cows similarly and that MY was clearly the most influential independent variable. The AFRC (1993) and CSIRO (2007), and CNCPS (Fox et al., 2004Fox, D. G.; Tedeschi, L. O.; Tylutki, T. P.; Russell, J. B.; Van Amburgh, M. E.; Chase, L. E.; Pell, A. N. and Overton, T. R. 2004. The Cornell Net Carbohydrate and Protein System model for evaluating herd nutrition and nutrient excretion. Animal Feed Science and Technology 112:29-78.), and INRA (2007) INRA - Institut National de la Recherche Agronomique. 2007. Alimentation des bovins, ovins et caprins. Besoins des animaux. Valeurs des aliments. Editions Quae, Versailles, France. had nearly identical predictions. The similarity between the CNCPS (Fox et al., 2004) and INRA (2007) INRA - Institut National de la Recherche Agronomique. 2007. Alimentation des bovins, ovins et caprins. Besoins des animaux. Valeurs des aliments. Editions Quae, Versailles, France. is a coincidence because of a higher MPm and a lower MPl requirements predicted by the CNCPS (Fox et al., 2004Fox, D. G.; Tedeschi, L. O.; Tylutki, T. P.; Russell, J. B.; Van Amburgh, M. E.; Chase, L. E.; Pell, A. N. and Overton, T. R. 2004. The Cornell Net Carbohydrate and Protein System model for evaluating herd nutrition and nutrient excretion. Animal Feed Science and Technology 112:29-78.) compared with the INRA (2007). Unlike the INRA (2007), the MPm calculation of the CNCPS (Fox et al., 2004Fox, D. G.; Tedeschi, L. O.; Tylutki, T. P.; Russell, J. B.; Van Amburgh, M. E.; Chase, L. E.; Pell, A. N. and Overton, T. R. 2004. The Cornell Net Carbohydrate and Protein System model for evaluating herd nutrition and nutrient excretion. Animal Feed Science and Technology 112:29-78.) depends on the IDM and the predicted DMI is influenced by the milk fat. Based on the correlation matrix used for the Monte Carlo simulations, the milk fat is highly correlated (r = 0.90) with BW; thus, an increase in BW would increase milk fat, and consequently, the MPm would be increased due to higher IDM (indirectly from DMI), which increases metabolic fecal protein. This is confirmed by the higher standardized regression coefficient for milk fat (i.e., EE) for the CNCPS (Fox et al., 2004Fox, D. G.; Tedeschi, L. O.; Tylutki, T. P.; Russell, J. B.; Van Amburgh, M. E.; Chase, L. E.; Pell, A. N. and Overton, T. R. 2004. The Cornell Net Carbohydrate and Protein System model for evaluating herd nutrition and nutrient excretion. Animal Feed Science and Technology 112:29-78.) in the bar plot in Figure 4. On the other hand, the higher efficiency of conversion of MPl to NPl of 0.65 assumed by the CNCPS (Fox et al., 2004Fox, D. G.; Tedeschi, L. O.; Tylutki, T. P.; Russell, J. B.; Van Amburgh, M. E.; Chase, L. E.; Pell, A. N. and Overton, T. R. 2004. The Cornell Net Carbohydrate and Protein System model for evaluating herd nutrition and nutrient excretion. Animal Feed Science and Technology 112:29-78.) compared with the 0.64 used by INRA (2007) INRA - Institut National de la Recherche Agronomique. 2007. Alimentation des bovins, ovins et caprins. Besoins des animaux. Valeurs des aliments. Editions Quae, Versailles, France. would lead to a lower MPl requirement for the CNCPS (Fox et al., 2004Fox, D. G.; Tedeschi, L. O.; Tylutki, T. P.; Russell, J. B.; Van Amburgh, M. E.; Chase, L. E.; Pell, A. N. and Overton, T. R. 2004. The Cornell Net Carbohydrate and Protein System model for evaluating herd nutrition and nutrient excretion. Animal Feed Science and Technology 112:29-78.).
Probability density (below the diagonal), correlation (above the diagonal), and bar (right) plots of the predicted MP (g/d) required for growing beef cattle using five models.
Probability density (below the diagonal), correlation (above the diagonal), and bar (right) plots of the predicted MP (g/d) required for lactation by four models.
The relationship between BW and ADG in predicting total MP required for growing beef cattle and the impact of MY and BW to estimate total MP required for lactating dairy cows is depicted as a 3D plot in Figure 5. The models behaved almost identically for lactating dairy cows, but there were distinct differences for total MP predictions for growing beef cattle, in which INRA (2007) INRA - Institut National de la Recherche Agronomique. 2007. Alimentation des bovins, ovins et caprins. Besoins des animaux. Valeurs des aliments. Editions Quae, Versailles, France. had a greater rate of increase of MP required estimates as BW and ADG increased compared with the other models.
Monte Carlo simulation results in 3D plots of (A) average daily gain and body weight (BW) on metabolizable protein (MP) required by growing cattle using five models and (B) milk yield (MY) and BW on MP required by lactating dairy cows using four models.
Next generations of nutrition models
We have advanced much in our understanding of the biology of protein utilization by ruminant animals and many concepts and ideas have been explored and analyzed during the last century of scientific work. Nutrition models and computer programs have been developed as research information became available after careful interpretation and confirmation (e.g., repeatability), and computers were broadly used to assist with the model development and application. Nonetheless, we still have ways to go to improve our understanding of metabolism of protein, efficiency of use of protein, the importance and implications of AA profile on protein utilization, and characterization of feed proteins.
It is evident that protein fractionation (Pichard and Van Soest, 1977 Pichard, G. and Van Soest, P. J. 1977. Protein solubility of ruminant feeds. p.91-98. In: Proceedings of Cornell Nutrition Conference for Feed Manufacturers, Syracuse, NY. New York State College of Agriculture & Life Sciences, Cornell University .; Crawford et al., 1978Crawford, R. J.; Hoover, W. H.; Sniffen, C. J. and Crooker, B. A. 1978. Degradation of feedstuff nitrogen in the rumen vs nitrogen solubility in three solvents. Journal of Animal Science 46:1768-1775.; Waldo and Goering, 1979Waldo, D. R. and Goering, H. K. 1979. Insolubility of proteins in ruminant feeds by four methods. Journal of Animal Science 49:1560-1568.; Krishnamoorthy et al., 1982Krishnamoorthy, U.; Muscato, T. V.; Sniffen, C. J. and Van Soest, P. J. 1982. Nitrogen fractions in selected feedstuffs. Journal of Dairy Science 65:217-225.) is a robust system for classifying dietary protein regarding its ruminal and post-ruminal availability even though some limitations still exist for routine determination of their ruminal kd and intestinal digestibility (Lanzas et al., 2007bLanzas, C.; Tedeschi, L. O.; Seo, S. and Fox, D. G. 2007b. Evaluation of protein fractionation systems used in formulating rations for dairy cattle. Journal of Dairy Science 90:507-521.). It is not clear if the number of protein fractions should be the same for all types of feeds. The contributions of obligate AA fermenters (i.e., hyper-ammonia producing bacteria) to protein deamination and the impact of feed additives on the protein (i.e., peptide) uptake by the ruminal bacteria need to be addressed (Tedeschi et al., 2011Tedeschi, L. O.; Callaway, T. R.; Muir, J. P. and Anderson, R. C. 2011. Potential environmental benefits of feed additives and other strategies for ruminant production. Revista Brasileira de Zootecnia 40:291-309.). The variable efficiency of use of first limiting AA for different physiological stages (i.e., maintenance, lactation, growth, pregnancy) need to be accounted for. There is a disconnection between the efficiency of use of individual AA and the overall efficiency of use of MP; should the first limiting AA restrict the efficiency of use of MP?
Improvements in the assessment of protein supply and requirements by the next generations of nutrition models are necessary to improve the predictions of N fluxes. These models will need to be more integrated to comply with the regulations of nitrogenous compounds that negatively affect the environment (e.g., volatile ammonia from manure).
References
- Abdalla, H. O.; Fox, D. G. and Thonney, M. L. 1988. Compensatory gain by Holstein calves after underfeeding protein. Journal of Animal Science 66:2687-2695.
- AFRC - Agricultural, and Food Research Council 1987a. AFRC Technical Committee on Responses to Nutrients, Report 1: Characterisation of feedstuffs: energy. Nutrition Abstracts and Reviews (Series B) 57:507-523.
- AFRC - Agricultural, and Food Research Council 1987b. AFRC Technical Committee on Responses to Nutrients, Report 2: Characterisation of feedstuffs: nitrogen. Nutrition Abstracts and Reviews (Series B) 57:713-736.
- AFRC - Agricultural, and Food Research Council 1988. AFRC Technical Committee on Responses to Nutrients, Report 3: characterisation of feedstuffs: other nutrients. Nutrition Abstracts and Reviews (Series B) 58:549-571.
- AFRC - Agricultural, and Food Research Council 1990. AFRC Technical Committee on Responses to Nutrients, Report 5: Nutritive requirements of ruminant animals: energy. Nutrition Abstracts and Reviews (Series B) 60:729-804.
- AFRC - Agricultural, and Food Research Council 1991. AFRC Technical Committee on Responses to Nutrients, Report 6: A reappraisal of the calcium and phosphorus requirements of sheep and cattle. Nutrition Abstracts and Reviews (Series B) 61:573-612.
- AFRC - Agricultural, and Food Research Council 1992. AFRC Technical Committee on Responses to Nutrients, Report 9: Nutritive requirements of ruminant animals: protein. Nutrition Abstracts and Reviews (Series B) 62:787-835.
- AFRC - Agricultural, and Food Research Council. 1993. Energy and protein requirements of ruminants. Agricultural and Food Research Council. CAB International, Wallingford, UK.
- Ainslie, S. J.; Fox, D. G.; Perry, T. C.; Ketchen, D. J. and Barry, M. C. 1993. Predicting amino acid adequacy of diets fed to Holstein steers. Journal of Animal Science 71:1312-1319.
- ARC - Agricultural Research Council. 1965. The nutrient requirements of farm livestock. No. 2, Ruminants. H.M. Stationery Office, London, UK.
- ARC - Agricultural Research Council. 1980. The nutrient requirements of ruminant livestock. Agricultural Research Council. The Gresham Press, London.
- Aufrère, J.; Graviou, D. and Demarquilly, C. 2002. Protein degradation in the rumen of red clover forage at various stages of growth and conserved as silage or wrapped big bales. Reproduction Nutrition Development 42:559-72.
- Beyer, M.; Chudy, A.; Hoffman, H. L.; Jentsch, W.; Laube, W.; Nehring, K. and Schiermann, R. 2003. Rostock Feed Evaluation System; Reference numbers of feed value and requirement of the base of net energy. Gottlob Volkhardtsche Druckerei, Amorbach.
- Boin, C. and Moura, M. P. 1977. Comparação entre dois níveis de proteína bruta e entre dois níveis de energia para zebuínos em crescimento. Boletim de Indústria Animal 34:155-163.
- Boston, R. C..; Fox, D. G..; Sniffen, C. J..; Janczewski, R..; Munsen, R.. and Chalupa, W.. 2000. The conversion of a scientific model describing dairy cow nutrition and production to an industry tool: the CPM Dairy project. p.361-377. In: Modelling nutrient utilization in farm animals. McNamara, J. P.; France, J. and Beever, D., eds. CABI Publishing, Oxford.
- Boucher, S. E.; Calsamiglia, S.; Parsons, C. M.; Stern, M. D.; Ruiz Moreno, M.; Vazquez-Anon, M. and Schwab, C. G. 2009. In vitro digestibility of individual amino acids in rumen-undegraded protein: The modified three-step procedure and the immobilized digestive enzyme assay. Journal of Dairy Science 92:3939-3950.
- Broderick, G. A.. and Åkerlind, M.. 2012a. A comparison of dietary evaluations by the NRC-2001 and Nordic Feed Evaluation systems. p.128-134. In: Proceedings of the 3rd Nordic Feed Science Conference, Uppsala, Sweden.
- Broderick, G. A.. and Åkerlind, M.. 2012b Efficient protein feeding - How to use modern feed evalation systems. p.19-20 . In: Proceedings of the D & U Conference, Uppsala, Sweden.
- Broderick, G. A.; Huhtanen, P.; Ahvenjärvi, S.; Reynal, S. M. and Shingfield, K. J. 2010. Quantifying ruminal nitrogen metabolism using the omasal sampling technique in cattle - A meta-analysis. Journal of Dairy Science 93:3216-3230.
- Chalupa, W. and Boston, R. 2003. Development of the CNCPS and CPM models: The Sniffen affect. p.15-24. In: Proceedings of Cornell Nutrition Conference for Feed Manufacturers, Syracuse, NY. New York State College of Agriculture & Life Sciences, Cornell University.
- Chase, L. E..; Higgs, R. J.. and Van Amburgh, M. E.. 2012. Feeding low crude protein rations to dairy cows - What have we learned? p.32-42. In: Proceedings of the 23rd Ruminant Nutrition Symposium. University of Florida, Gainsville, FL.
- Chen, Z. H.; Broderick, G. A.; Luchini, N. D.; Sloan, B. K. and Devillard, E. 2011. Effect of feeding different sources of rumen-protected methionine on milk production and N-utilization in lactating dairy cows. Journal of Dairy Science 94:1978-1988.
- Crawford, R. J.; Hoover, W. H.; Sniffen, C. J. and Crooker, B. A. 1978. Degradation of feedstuff nitrogen in the rumen vs nitrogen solubility in three solvents. Journal of Animal Science 46:1768-1775.
- CSIRO - Commonwealth Scientific and Industrial Research Organization. 1990. Feeding standards for Australian livestock. Ruminants. Commonwealth Scientific and Industrial Research Organization, Melbourne, Australia.
- CSIRO - Commonwealth Scientific and Industrial Research Organization. 2007. Nutrient requirements of domesticated ruminants. Commonwealth Scientific and Industrial Research Organization, Collingwood, VIC.
- Danfær, A.; Huhtanen, P.; Udén, P.; Sveinbjörnsson, J. and Volden, H. 2006. The Nordic Dairy Cow Model, Karoline - Description. p.383-406. In: Nutrient digestion and utilization in farm animals: Modeling approaches. Kebreab, E.; Dijkstra, J.; Bannink, A.; Gerrits, W. J. J. and France, J., eds. CABI Publishing, Cambridge, MA.
- Danner, M. L.; Fox, D. G. and Black, J. R. 1980. Effect of feeding system on performance and carcass characteristics of yearling steers, steer calves and heifer calves. Journal of Animal Science 50:394-404.
- Detmann, E.; Valadares Filho, S. C.; Pina, D. S.; Henriques, L. T.; Paulino, M. F.; Magalhães, K. A.; Silva, P. A. and Chizzotti, M. L. 2008. Prediction of the energy value of cattle diets based on the chemical composition of the feeds under tropical conditions. Animal Feed Science and Technology 143:127-147.
- Forbes, E. B. 1924. Cooperative Experiments upon the protein requirements for the growth of cattle - II. No. 42. National Academy Press, Washington, DC.
- Fox, D. G.. and Cook, R. J.. 1977. Performance of steer calves fed corn silage treated with three sources of anhydrous ammonia. Research Report. No. 328. Michigan State University, East Lansing. p.89-95.
- Fox, D. G.; Sniffen, C. J.; O'Connor, J. D.; Russell, J. B. and Van Soest, P. J. 1992. A net carbohydrate and protein system for evaluating cattle diets: III. Cattle requirements and diet adequacy. Journal of Animal Science 70:3578-3596.
- Fox, D. G.. and Tedeschi, L. O.. 2003. Predicting dietary amino acid adequacy for ruminants. p.389-410. In: Amino acids in animal nutrition. D'Mello, J. P. F., ed. CABI Publishing, Cambridge, MA.
- Fox, D. G.; Tedeschi, L. O.; Tylutki, T. P.; Russell, J. B.; Van Amburgh, M. E.; Chase, L. E.; Pell, A. N. and Overton, T. R. 2004. The Cornell Net Carbohydrate and Protein System model for evaluating herd nutrition and nutrient excretion. Animal Feed Science and Technology 112:29-78.
- Fox, D. G..; Tylutki, T. P..; Tedeschi, L. O..; Van Amburgh, M. E..; Chase, L. E..; Pell, A. N..; Overton, T. R.. and Russell, J. B.. 2003. The Net Carbohydrate and Protein System for evaluating herd nutrition and nutrient excretion: Model documentation. Mimeo No. 213. Animal Science Department, Cornell University, Ithaca, NY. 292p.
- Geay, Y.; Micol, D.; Robelin, J.; Berge, P. and Malterre, C. 1987. Recommandations alimentaires pour les bovins en croissance et à l'engais. Bulletin Technique du Centre de Recherches Zootechniques et Veterinaires de Theix 70:173-183.
- Gierus, M.; de Jonge, L. and Meijer, G. A. L 2005 . Physico-chemical characteristics and degradation rate of soluble protein obtained from the washout fraction of feeds. Livestock Production Science 97:219-229.
- Helton, J. C. and F J, Davis.. 2002. . Illustration of sampling-based methods for uncertainty and sensitivity analysis. Risk Analysis 22:591-622.
- Hulme, D. J.; Kellaway, R. C.; Booth, P. J. and Bennett, L. 1986. The CAMDAIRY model for formulating and analysing dairy cow rations. Agricultural Systems 22:81-108.
- Hvelplund, T. and Madsen, J. 1993. Protein systems for ruminants. Iceland Agriculture Science 7:21-36.
- INRA - Institut National de la Recherche Agronomique. 1989. Ruminant nutrition. Recommended allowances and feed tables. Institut National de la Recherche Agronomique, John Libbey Eurotext, Montrouge, France.
- INRA - Institut National de la Recherche Agronomique. 2007. Alimentation des bovins, ovins et caprins. Besoins des animaux. Valeurs des aliments. Editions Quae, Versailles, France.
- Jentsch, W..; Chudy, A.. and Beyer, M.. 2003. Rostock Feed Evaluation System: Reference numbers of feed value and requirement on the base of net energy. Plexus Verlag, Miltenberg-Frankfurt, Germany.
- Krishnamoorthy, U.; Muscato, T. V.; Sniffen, C. J. and Van Soest, P. J. 1982. Nitrogen fractions in selected feedstuffs. Journal of Dairy Science 65:217-225.
- Lanzas, C.; Broderick, G. A. and Fox, D. G. 2008. Improved feed protein fractionation schemes for formulating rations with the Cornell Net Carbohydrate and Protein System. Journal of Dairy Science 91:4881-4891.
- Lanzas, C.; Sniffen, C. J.; Seo, S.; Tedeschi, L. O. and Fox, D. G. 2007a. A revised CNCPS feed carbohydrate fractionation scheme for formulating rations for ruminants. Animal Feed Science and Technology 136:167-190.
- Lanzas, C.; Tedeschi, L. O.; Seo, S. and Fox, D. G. 2007b. Evaluation of protein fractionation systems used in formulating rations for dairy cattle. Journal of Dairy Science 90:507-521.
- Lapierre, H.; Berthiaume, R.; Raggio, G.; Thivierge, M. C.; Doepel, L.; Pacheco, D.; Dubreuil, P. and Lobley, G. E. 2005. The route of absorbed nitrogen into milk protein. Animal Science 80:11-22.
- Lofgreen, G. P. and Garrett, W. N. 1968. A system for expressing net energy requirements and feed values for growing and finishing beef cattle. Journal of Animal Science 27:793-806.
- Lomas, L. W.; Fox, D. G. and Black, J. R. 1982. Ammonia treatment of corn silage I. Feedlot performance of growing and finishing steers. Journal of Animal Science 55:909-923.
- Metcalf, J. A.; Mansbridge, R. J.; Blake, J. S.; Oldham, J. D. and Newbold, J. R. 2008. The efficiency of conversion of metabolisable protein into milk true protein over a range of metabolisable protein intakes. Animal 2:1193-1202.
- Mitchell, H. H. 1926. The determination of the protein requirements of animals and of the protein values of farm feeds and rations. No. 55. National Research Council, Washington, DC. 44p.
- Mitchell, H. H. 1929. The minimum protein requirements of cattle. No. 67. National Academy Press, Washington, DC. 84p.
- NRC - National Research Council. 1945. Recommended nutrient allowances for beef cattle. Recommended nutrient allowances for domestic animals. National Academy Press, Washington, DC.
- NRC - National Research Council. 1956. Nutrient requirements of dairy cattle. 2nd ed. Nutrient requirements of domestic animals. National Academy Press, Washington, DC.
- NRC - National Research Council. 1958. Nutrient requirements of beef cattle. 2nd ed. Nutrient requirements of domestic animals. National Academy Press, Washington, DC.
- NRC - National Research Council. 1963. Nutrient requirements of beef cattle. 3rd ed. Nutrient requirements of domestic animals. National Academy Press, Washington, DC.
- NRC - National Research Council. 1966. Nutrient requirements of dairy cattle. 3rd ed. Nutrient requirements of domestic animals. National Academy Press, Washington, DC.
- NRC - National Research Council. 1970. Nutrient requirements of beef cattle. 4th ed. Nutrient requirements of domestic animals. National Academy Press, Washington, DC.
- NRC - National Research Council. 1971. Nutrient requirements of dairy cattle. 4th ed. Nutrient requirements of domestic animals. National Academy Press, Washington, DC.
- NRC - National Research Council. 1976. Nutrient requirements of beef cattle. 5th ed. Nutrient requirements of domestic animals. National Academy Press, Washington, DC.
- NRC - National Research Council. 1978. Nutrient requirements of dairy cattle. 5th ed. Nutrient requirements of domestic animals. National Academy Press, Washington, DC.
- NRC - National Research Council. 1984. Nutrient requirements of beef cattle. 6th ed. Nutrient requirements of domestic animals. National Academy Press, Washington, DC.
- NRC - National Research Council. 1985. Ruminant nitrogen usage. National Academy Press, Washington, DC.
- NRC - National Research Council. 1989. Nutrient requirements of dairy cattle. 6th ed. Nutrient requirements of domestic animals. National Academy Press, Washington, DC.
- NRC - National Research Council. 1996. Nutrient requirements of beef cattle. 7th ed. Nutrient requirements of domestic animals. National Academy Press, Washington, DC.
- NRC - National Research Council. 2000. Nutrient requirements of beef cattle. updated 7th ed. Nutrient requirements of domestic animals. National Academy Press, Washington, DC.
- NRC - National Research Council. 2001. Nutrient requirements of dairy cattle. 7th ed. Nutrient requirements of domestic animals. National Academy Press, Washington, DC.
- O'Connor, J. D.; Sniffen, C. J.; Fox, D. G. and Chalupa, W 1993. A net carbohydrate and protein system for evaluating cattle diets: IV Predicting amino acid adequacy. Journal of Animal Science 71:1298-1311.
- Ørskov, E. R. and McDonald, I. 1979. The estimation of protein degradability in the rumen from incubation measurements weighted according to rate of passage. Journal of Agricultural Science 92:449-503.
- Pichard, G. and Van Soest, P. J. 1977. Protein solubility of ruminant feeds. p.91-98. In: Proceedings of Cornell Nutrition Conference for Feed Manufacturers, Syracuse, NY. New York State College of Agriculture & Life Sciences, Cornell University .
- Robelin, J. and Daenicke, R. 1980. Variations of net requirements for cattle growth with liveweight, liveweight gain, breed and sex. Annales de Zootechnie 29:99-118.
- Ruiz, R.; Tedeschi, L. O.; Marini, J. C.; Fox, D. G.; Pell, A. N.; Jarvis, G. and Russell, J. B. 2002. The effect of a ruminal nitrogen (N) deficiency in dairy cows: evaluation of the Cornell net carbohydrate and protein system ruminal N deficiency adjustment. Journal of Dairy Science 85:2986-2999.
- Rulquin, H.; Pisulewski, P. M.; Vérité, R. and Guinard, J. 1993. Milk production and composition as a function of postruminal lysine and methionine supply: a nutrient-response approach. Livestock Production Science 37:69-90.
- Rulquin, H.. and Vérité, R.. 1993. Amino acid nutrition of dairy cows: productive effects and animal requirements. p.55-77. In: Recent advances in animal nutrition. Garnsworthy, P. C. and Cole, D. J. A., eds. Nottingham University Press, Nottingham, UK.
- Rulquin, H..; Vérité, R..; Guinard, J.. and Pisulewski, P. M.. 1995. Dairy cows' requirements for amino acids. p.143-160. In: Animal science research and development: Moving toward a new century. Ministry and Services Canada, Ottawa, Canada.
- Russell, J. B.; O'Connor, J. D.; Fox, D. G.; Van Soest, P. J. and Sniffen, C. J. 1992. A net carbohydrate and protein system for evaluating cattle diets: I. Ruminal fermentation. Journal of Animal Science 70:3551-3561.
- Schwab, C. 2012. The principles of balancing diets for amino acids and their impact on N utilization efficiency. p.1-15. In: Proceedings of the 23rd Ruminant Nutrition Symposium. University of Florida, Gainsville, FL.
- Schwab, C..; Whitehouse, N.; Luchini, D. and Sloan, B. 2009. Reevaluation of the breakpoint estimates for the NRC (2001) required concentrations of lysine and methionine in metabolizable protein for maximal content and yield of milk protein. p.103-104. In: American Dairy Society Association, Montreal, Canada. ADSA.
- Schwab, C. G.. and Foster, G. N.. 2009. Maximizing milk components and metabolizable protein utilization through amino acid formulation. p.1-15. In: Proceedings of Cornell Nutrition Conference for Feed Manufacturers, Syracuse, NY. New York State College of Agriculture & Life Sciences, Cornell University.
- Seo, S.; Tedeschi, L. O.; Schwab, C. G. and Fox, D. G. 2006. Development and evaluation of empirical equations to predict feed passage rate in cattle. Animal Feed Science and Technology 128:67-83.
- Sieber, M.; Freeman, A. E. and Kelley, D. H. 1988. Relationships between body measurements, body weight, and productivity in Holstein dairy cows. Journal of Dairy Science 71:3437-3445.
- Sniffen, C. J.; O'Connor, J. D.; Van Soest, P. J.; Fox, D. G. and Russell, J. B. 1992. A net carbohydrate and protein system for evaluating cattle diets: II. Carbohydrate and protein availability. Journal of Animal Science 70:3562-3577.
- Swanson, E. W. 1977. Factors for computing requirements of protein for maintenance of cattle. Journal of Dairy Science 60:1583-1593.
- Tamminga, S.; Van Straalen, W. M.; Subnel, A. P. J.; Meijer, R. G. M.; Steg, A.; Wever, C. J. G. and Blok, M. C. 1994. The Dutch protein evaluation system: the DVE/OEB-system. Livestock Production Sicience 40:139-155.
- Tedeschi, L. O.; Boin, C.; Fox, D. G.; Leme, P. R.; Alleoni, G. F. and Lanna, D. P. D 2002a . Energy requirement for maintenance and growth of Nellore bulls and steers fed high-forage diets. Journal of Animal Science 80:1671-1682.
- Tedeschi, L. O.; Callaway, T. R.; Muir, J. P. and Anderson, R. C. 2011. Potential environmental benefits of feed additives and other strategies for ruminant production. Revista Brasileira de Zootecnia 40:291-309.
- Tedeschi, L. O.; Chalupa, W.; Janczewski, E.; Fox, D. G.; Sniffen, C. J.; Munson, R.; Kononoff, P. J. and Boston, R. C. 2008. Evaluation and application of the CPM Dairy nutrition model. Journal of Agriculture Science 146:171-182.
- Tedeschi, L. O.; Fox, D. G.; Chase, L. E. and Wang, S. J. 2000a. Whole-herd optimization with the Cornell net carbohydrate and protein system I. Predicting feed biological values for diet optimization with linear programming. Journal of Dairy Science 83:2139-2148.
- Tedeschi, L. O.; Fox, D. G. and Doane, P. H. 2005. Evaluation of the tabular feed energy and protein undegradability values of the National Research Council nutrient requirements of beef cattle. Professional Animal Scientist 21:403-415.
- Tedeschi, L. O.; Fox, D. G.; Pell, A. N.; Lanna, D. P. D. and Boin, C. 2002b. Development and evaluation of a tropical feed library for the Cornell Net Carbohydrate and Protein System model. Scientia Agricola 59:1-18.
- Tedeschi, L. O.; Fox, D. G. and Russell,J. B. 2000b. Accounting for ruminal deficiencies of nitrogen and branched-chain amino acids in the structure of the Cornell net carbohydrate and protein system. p.224-238. In: Proceedings of Cornell Nutrition Conference for Feed Manufacturers, Rochester, NY. New York State College of Agriculture & Life Sciences, Cornell University.
- Tedeschi, L. O.; Fox, D. G. and Russell, J. B. 2000c. Accounting for the effects of a ruminal nitrogen deficiency within the structure of the Cornell net carbohydrate and protein system. Journal of Animal Science 78:1648-1658.
- Tedeschi, L. O.; Pell, A. N.; Fox, D. G. and Llames, C. R. 2001. The amino acid profiles of the whole plant and of four residues from temperate and tropical forages. Journal of Animal Science 79:525-532.
- Thomas, C. 2004. Feed into milk: A new applied feeding system for dairy cows: An advisory manual. Nottingham University Press, Nottingham, UK.
- Tylutki, T. P.; Fox, D. G. and Anrique, R. G. 1994. Predicting net energy and protein requirements for growth of implanted and nonimplanted heifers and steers and nonimplanted bulls varying in body size. Journal of Animal Science 72:1806-1813.
- Tylutki, T. P.; Fox, D. G.; Durbal, V. M.; Tedeschi, L. O.; Russell, J. B.; Van Amburgh, M. E.; Overton, T. R.; Chase, L. E. and Pell, A. N. 2008. Cornell Net Carbohydrate and Protein System: A model for precision feeding of dairy cattle. Animal Feed Science and Technology 143:174-202.
- Valadares Filho, S. C.; Marcondes, M. I.; Chizzotti, M. L. and Paulino, P. V. R. 2010. Exigências nutricionais de zebuínos puros e cruzados - BR-Corte. 2nd ed. Suprema Gráfica Ltda, Viçosa, MG.
- Valadares Filho, S. C.; Paulino, P. V. R. and Magalhães, K. A. 2006a. Exigências nutricionais de zebuínos e tabelas de composição de alimentos - BR-Corte. 1st ed. Suprema Gráfica Ltda, Viçosa, MG.
- Valadares Filho, S. C.; Paulino, P. V. R.; Magalhães, K. A.; Paulino, M. F.; Detmann, E.; Pina, D. S. and Azevedo, J. A. G. 2006b. Tabelas de composição de alimentos e exigências nutricionais de zebuínos: Dados brasileiros. p.47-80. In: Proceedings of the 5th International Symposium of Beef Production (SIMCORTE) . Suprema Gráfica e Editora Ltda., Viçosa, MG, Brazil .
- Van Amburgh, M. E.; Chase, L. E.; Overton, T. R.; Ross, D. A.; Rechtenwald, R. J.; Higgs, R. J. and Tylutki, T. P. 2010. Updates to the Cornell Net Carbohydrate and Protein System v6.1 and implications for ration formulation. p.144-159. In: Proceedings of Cornell Nutrition Conference for Feed Manufacturers, Syracuse, NY. New York State College of Agriculture & Life Sciences, Cornell University.
- Van Amburgh, M. E.; Overton,T. R.; Chase, L. E.; Ross, D. A. and Rechtenwald, R. J. 2009. The Cornell Net Carbohydrate and Protein System: Current and future approaches for balancing of amino acids. p.28-37. In: Proceedings of Cornell Nutrition Conference for Feed Manufacturers, Syracuse, NY. New York State College of Agriculture & Life Sciences, Cornell University.
- Van Amburgh,M. E..; Ross,D. A..; Higgs, R. J..; Rechtenwald, R. J.. and Chase, L. E.. 2012. Balancing for rumen degradable protein and post-ruminal requirements for lactating cattle using the CNCPS as a basis for evaluation. p.17-31. In: Proceedings of the 23rd Ruminant Nutrition Symposium. University of Florida, Gainsville, FL.
- Van Straalen, W. M.; Salaun, C.; Veen, W. A. G.; Rijpkema, Y. S.; Hof, G. and Boxem, T. 1994. Validation of protein evaluation systems by means of milk production experiments with dairy cows. Netherlands Journal of Agricultural Science 42:89-104.
- Volden, H. 2001. Utvikling av et mekanistisk system for vurdering av fôr til drøvtyggere, AAT-modellen. p.1-41. In: Fôropptak og fôrmiddelvurdering hos drøvtyggere, Quality Hotell Halvorsbøle, Jevnaker.
- Volden, H. 2011. NorFor - The Nordic Feed Evaluation System. Wageningen Academic Publishers, Wageningen, The Netherlands.
- Waldo, D. R. and Goering, H. K. 1979. Insolubility of proteins in ruminant feeds by four methods. Journal of Animal Science 49:1560-1568.
- Weiss, W. P.; Conrad, H. R. and St Pierre, N. R. 1992. A theoretically-based model for predicting total digestible nutrient values of forages and concentrates. Animal Feed Science Technology 39:95-110.
- Whitehouse, N..; Schwab, C..; Tylutki, T..; Luchini, D.. and Sloan, B.. 2009. Comparison of optimal lysine and methionine concentrations in metabolizable protein estimated by the NRC (2001), CPM-Dairy (v.3.0.10) and AMTS.Cattle (v.2.1.1) models. p.103. In: American Dairy Society Association, Montreal, Canada. ADSA.
- Wilkerson, V. A.; Klopfenstein, T. J.; Britton, R. A.; Stock, R. A. and Miller, P. S. 1993. Metabolizable protein and amino acid requirements of growing cattle. Journal of Animal Science 71:2777-2784.
Publication Dates
-
Publication in this collection
Mar 2015
History
-
Received
10 July 2014 -
Accepted
09 Jan 2015