ABSTRACT
The objective of this study was to estimate genetic parameters for body weight of beef cattle in performance tests. Different random regression models with quadratic B-splines and heterogeneous residual variance were fitted to estimate covariance functions for body weights of Nellore and crossbred Charolais × Nellore bulls. The criteria −2 residual log-likelihood (−2RLL), Akaike Information Criterion (AIC), and consistent AIC (CAIC) were used to choose the most appropriate model. For Nellore bulls, residual variance was modeled with six classes of age, and direct additive genetic and permanent environment effects were modeled with quadratic B-splines with two and one intervals, respectively. For crossbred bulls, quadratic B-splines with one interval fitted direct additive genetic and permanent environment effects and nine classes of age were needed to fit residual variance. Pooling classes of age with up to 40% in difference of residual variances does not compromise the fit of the model. Heritability for body weight in performance tests are moderate (>0.25, for crossbred bulls) to high (>0.5, for Nellore bulls) and genetic correlation between weights over the test are also high (>0.65). Then, selection of young bulls in performance test is an efficient tool to increase body weight in beef cattle.
Key Words
animal breeding; Bos indicus; genetic correlation; heritability
Introduction
Using genetically superior young bulls is important for the increase in efficiency of beef cattle production. Genetic differences among young bulls can be measured in performance tests. In such tests, candidates for selection are maintained in controlled environments and are later ranked according to specific criteria. Typically, body weight is an important selection criterion for beef cattle breeding programs (Campos et al., 2014Campos, G. S.; Braccini Neto, J.; Oaigen, R. P.; Cardoso, F. F.; Cobuci, J. A.; Kern, E. L.; Campos, L. T.; Bertoli, C. D. and McManus, C. M. 2014. Bioeconomic model and selection indices in Aberdeen Angus cattle. Journal of Animal Breeding and Genetics 131:305-312.), which is measured several times over the life of the animal. Random regression models are often more appropriate for genetic evaluation of body weight because they describe phenotypic and genetic changes over time.
The growth of Bos indicus (Riley et al., 2007Riley, D. G.; Coleman, S. W.; Chase Jr, C. C.; Olson, T. A. and Hammond, A. C. 2007. Genetic parameters for body weight, hip height, and the ration of weight to hip height from random regression analyses of Brahman feedlot cattle. Journal of Animal Science 85:42-52.; Boligon et al., 2012Boligon, A. A.; Mercadante, M. E. Z.; Lôbo, R. B.; Baldi, F. and Albuquerque, L. G. 2012. Random regression analysis using B-splines functions to model growth of Nellore cattle. Animal 6:212-220.; Lopes et al., 2012Lopes, F. B.; Magnabosco, C. U.; Paulini, F.; Silva, M. C.; Miyagi, E. S. and Lôbo, R. B. 2012. Analysis of longitudinal data of Nellore cattle from performance test at pasture using random regression model. SpringerPlus 1:49.; Scalez et al., 2014Scalez, D. C. B.; Fragomeni, B. O.; Passafaro, T. L.; Pereira, I. G. and Toral, F. L. B. 2014. Polynomials to model the growth of young bulls in performance tests. Animal 8:370-378.; Bertipaglia et al., 2015Bertipaglia, T. S.; Carreño, L. O. D.; Aspilcueta-Borquis, R. R.; Boligon, A. A.; Farah, M. M.; Gomes, F. J.; Machado, C. H. C.; Rey, F. S. B. and da Fonseca, R. 2015. Estimates of genetic parameters for growth traits in Brahman cattle using random regression and multitrait models. Journal of Animal Science 93:3814-3819.), Bos taurus (Meyer, 2005aMeyer, K. 2005a. Estimates of genetic covariance functions for growth of Angus cattle. Journal of Animal Breeding and Genetics 122:73-85., bMeyer, K. 2005b. Random regression analyses using B-spline to model growth of Australian Angus cattle. Genetics Selection Evolution 37:473-500.; Mota et al., 2013bMota, R. R.; Marques, L. F. A.; Lopes, P. S.; Silva, L. P.; Neto, F. R. A.; Resende, M. D. V. and Torres, R. A. 2013b. Genetic evaluation using multi-trait and random regression models in Simmental beef cattle. Genetics and Molecular Research 12:2465-2480.), and crossbred beef cattle (Sánchez et al., 2008Sánchez, J. P.; Misztal, I.; Aguilar, I. and Bertrand, J. K. 2008. Genetic evaluation of growth in a multibreed beef cattle population using random regression-linear spline models. Journal of Animal Science 86:267-277.; Baldi et al., 2010Baldi, F.; Alencar, M. M. and Albuquerque, L. G. 2010. Random regression analyses using B-splines functions to model growth from birth to adult age in Canchim cattle. Journal of Animal Breeding and Genetics 127:433-441.; Mota et al., 2013aMota, R. R.; Marques, L. F. A.; Lopes, P. S.; Silva, L. P.; Hidalgo, A. M.; Leite, C. D. S. and Torres, R. A. 2013a. Random regression models in the evaluation of the growth curve of Simbrasil beef cattle. Genetics and Molecular Research 12:528-536.; Scalez et al., 2014Scalez, D. C. B.; Fragomeni, B. O.; Passafaro, T. L.; Pereira, I. G. and Toral, F. L. B. 2014. Polynomials to model the growth of young bulls in performance tests. Animal 8:370-378.) has been modeled by random regression models. Legendre polynomials are the typical choice for most researchers for fitting mean growth trajectories and also additive and permanent environmental effects. Despite the advantages observed in random regression analyses, its use with Legendre polynomials can lead to problems when the variances increase at extremes of age intervals (Meyer, 2005bMeyer, K. 2005b. Random regression analyses using B-spline to model growth of Australian Angus cattle. Genetics Selection Evolution 37:473-500.). Overcoming these issues involves increasing the order of Legendre functions or using more robust (e.g., spline) functions that allow low-degree polynomials to fit over short segments of the growth trajectory.
The identification of the best-fit models is essential because inadequate modeling of genetic and non-genetic effects affects selection response. Since the use of B-spline polynomials in random regression models for beef cattle genetic evaluations is recent, it remains important to study this type of function. Therefore, the current study estimated genetic parameters for body weight of beef cattle in performance tests using random regression models with quadratic B-spline functions.
Material and Methods
The weight and age data of two genetic groups of young bulls (Nellore and MA) were recorded during performance tests. The genetic group MA (21/32 Charolais + 11/32 Nellore, approximately) came from a rotational crossbreeding of Canchim (5/8 Charolais + 3/8 Zebu) and Charolais bulls with Nellore cows. The Nellore breed database consisted of 16,291 observations from 3,356 animals across 37 performance tests conducted by Grupo Provados a Pasto. The weaned animals were kept in a single management group on pasture with mineral supplementation throughout the evaluation period. The young bulls were weighed after an adaptation period of 70 days and at regular intervals of 56 days up to 224 days after the end of the adaptation period. Approximately 15 and 85% of the animals had four and five records each, respectively. For Nellore, age ranged from 262 to 642 days.
The data for MA group were from the evaluation program of young bulls of Agropecuária Ipameri. The growth of bulls was evaluated in 10 performance tests between weaning (225 days of age, on average) and approximately 18 months of age. The animals were kept on pasture and received protein-energetic supplementation during the dry season and mineral supplementation in the whole evaluation period. The database consisted of 3,997 observations of 884 MA bulls. Approximately 3, 63, 13, and 21% of the animals had three, four, five, and six records each, respectively. For MA group, age ranged from 166 to 707 days. Information on the average weight and the number of observations for each age was reported in Scalez et al. (2014)Scalez, D. C. B.; Fragomeni, B. O.; Passafaro, T. L.; Pereira, I. G. and Toral, F. L. B. 2014. Polynomials to model the growth of young bulls in performance tests. Animal 8:370-378..
Random regression models were fitted to each genetic group separately. Each model included the fixed effects of the contemporary group and the average growth trajectory (quadratic B-spline polynomial with four intervals) nested in the performance test. The contemporary groups of Nellore bulls were composed of animals born in the same year and month and evaluated in the same performance test. The contemporary groups of MA bulls included animals born in the same year and season (i.e., January to March, April to June, July to September, and October to December), and weighed and evaluated in the same performance test. Quadratic B-splines polynomials were used to model the random additive genetic and permanent environmental effects.
The coefficients of the quadratic B-spline functions were generated for the k interval defined by the points Tk and Tk+1, with Tk ≤ Tk+1, according to De Boor (2001)De Boor, C. 2001. A practical guide to splines. 2nd ed. Springer Series in Applied Mathematics. Springer Verlag, New York. and Meyer (2005b)Meyer, K. 2005b. Random regression analyses using B-spline to model growth of Australian Angus cattle. Genetics Selection Evolution 37:473-500.. The polynomial functions considered in the present study were those with up to four intervals of the same size. The division into m intervals requires the specification of m−1 internal knots and two external knots (T0 and Tm). This approach generates m+1 knots and m+p non-null functions ϕk,p, in which p is the degree of the basis function (Meyer, 2005bMeyer, K. 2005b. Random regression analyses using B-spline to model growth of Australian Angus cattle. Genetics Selection Evolution 37:473-500.). The general random regression model with quadratic B-splines was described as follows:
in which CGi represents the effect of the i-th contemporary group; ϕk,2(agej) is the k-th quadratic B-spline covariate at age j, which was nested in i*-th performance test to fit the average growth trajectory; βk(i*) is k-th coefficient of the fixed regression nested in fixed effect i*; αkm and ρkm are the k-th random regression coefficients for the additive genetic and permanent environmental effects of animal m, respectively; and Ma and Mp represent the number of intervals used to model the random additive genetic and permanent environmental effects, respectively.
In matrix notation, the quadratic B-spline general random regression models were as follows:
in which represents the vector of observations, X is the incidence matrix of fixed effects (i.e., contemporary groups and average growth trajectories), is the vector of fixed-effect solutions, Z1 is the incidence matrix of random additive genetic effects, is the vector of random additive genetic effect solutions, Z2 is the incidence matrix of random permanent environmental effects, is the vector of random permanent environmental effect solutions, and is the vector of random errors.
The covariance of random effects was defined as follows:
in which Ka represents the covariance matrix of random regression coefficients for additive genetic effects, A is the additive genetic relationship matrix, Kp is the covariance matrix of random regression coefficients for permanent environmental effects, I is the identity matrix, and R is the covariance matrix of random error. The relationship matrices were composed of 4,283 and 1,491 animals for Nellore and MA groups, respectively.
The covariance components and genetic parameters were estimated by the Restricted Maximum Likelihood method using the Wombat software (Meyer, 2007Meyer, K. 2007. WOMBAT – A tool for mixed model analyses in quantitative genetics by restricted maximum likelihood (REML). Journal of Zhejiang University Science B 8:815-821.). Models with one, two, four, eight, and sixteen classes of residual variance were evaluated. After analyzing the model with 16 classes, the adjacent residual variance classes with differences less than 10, 20, 30, 40, and 50% (relative to the smallest value of variance) were pooled, yielding new models with fifteen, ten, nine, six, and four age classes for Nellore and fourteen, thirteen, thirteen, ten, and nine age classes for MA group, respectively. In these analyses, the additive genetic effect and the direct permanent environmental effects were modeled using a quadratic B-spline polynomial with four intervals to compare models with different numbers of classes of residual variance. The criteria −2 restricted likelihood function (−2RLL), Akaike Information Criterion (AIC), and consistent Akaike Information Criterion (CAIC) were used to choose the most appropriate number of classes of age for residual variance (Bozdogan, 1987Bozdogan, H. 1987. Model selection and Akaike's information criterion (AIC): the general theory and its analytical extensions. Psychometrika 52:345-370.; Wolfinger, 1993Wolfinger, R. D. 1993. Covariance structure selection in general mixed models. Communications in Statistics – Simulation and Computation 22:1079-1106.).
After defining the most suitable residual variance structure, the models with differences in the number of intervals for the covariance functions of random effects were compared. Models with one, two, three, and four intervals were evaluated (sixteen models). The knots were equidistant and the criteria used to assess the best model were the same as those defined in the previous stage. The quadratic B-spline models were named according to the number of non-null functions. Thus, the quadratic B-splines with one, two, three, and four regular intervals for additive genetic and permanent environment effects were named QBS33, QBS44, QBS55, and QBS66, respectively.
After estimating the covariance functions, the breeding values of selection candidates were predicted from the solutions of the random regression coefficients based on Mrode (2005)Mrode, R. A. 2005. Linear models for the prediction of animal breeding values. 2nd ed. CABI Publishing, Wallingford.. The predicted breeding values were calculated for weight at 300, 365, 450, and 550 days for Nellore group and at 225, 365, 450, and 550 days for MA group. These predictions were used to rank the top 10% young bulls within each performance test. The percentage of commonly selected animals was obtained using different models indicated by −2RLL, AIC, and CAIC. In addition, Pearson and Spearman correlations were computed between the breeding values obtained using the models indicated by the above criteria and the breeding values obtained using the homogeneous residual variance model.
Results
The values of −2RLL, AIC, and CAIC were higher in the model with homogeneous residual variance for both genetic groups (Table 1). Thus, these models had the worst fit. The AIC showed the lowest values for models with nine age classes for Nellore, and ten and thirteen age classes of residual variances for MA group (Table 1). The CAIC values were lower for models with six and nine age classes of residual variance (Table 1). Therefore, these results indicate that such models fitted better the records of Nellore and MA groups, respectively. In general, models with low information criteria values were derived by pooling adjacent age classes of residual variances. The estimates of residual variance increased from the beginning to 550-600 days of age (Figure 1). The models that considered homogeneous residual variance showed the lowest percentage of individuals selected in common compared with models with heterogeneous residual variance (Table 2). Pearson and Spearman correlations involving the breeding values predicted by the models with heterogeneous residual variance within each test were above 0.97. Considering the models with heterogeneous residual variance, the average percentage of individuals selected in common were above 98 and 96% for Nellore and MA groups, respectively, with minimum values equal or greater than 80% (Table 2).
Estimates of residual variance for body weight of purebred Nellore (left) and crossbred Charolais × Nellore (right) young bulls in performance tests, according to the number of classes of age for residual variance.
Number of parameters (NP) and values of −2RLL, AIC, and CAIC for quadratic B-spline random regression models for body weight of purebred Nellore and crossbred Charolais × Nellore young bulls in performance tests, according to the number of classes of age (NCA) for residual variance
Mean and minimum (Min) values for the percentages of purebred Nellore and crossbred Charolais × Nellore young bulls among the top 10% for expected breeding value for body weight in standard ages within each performance test, according to the models with different number of classes of age (NCA) for residual variance
After assessing different quadratic B-splines functions to adjust the additive and permanent environmental effects for growth of Nellore bulls, the QBS65 model displayed the best fit according to −2RLL and AIC. The variance estimates obtained by the models QBS43 and QBS65 were similar for Nellore breed, especially at initial ages and after 550 days of age (Figure 2). These estimates were also similar to those obtained using the most complete model, QBS66. On the other hand, the simplest model (QBS33) showed high values for the genetic additive variance and low estimates for the permanent environmental variance (Figure 2). The estimates of permanent environmental variance were constant in most of the age intervals for the Nellore breed (Figure 2).
Estimates of variances for body weight of purebred Nellore (left) and crossbred Charolais × Nellore (right) young bulls in performance tests using quadratic B-spline1 models (QBS33, QBS43, QBS63, QBS65, and QBS66).
In the case of MA genetic group, the models QBS66, QBS63, and QBS33 exhibited the best fit based on −2RLL, AIC, and CAIC criteria, respectively (Table 3). The trends of the direct additive genetic and the direct permanent environmental variances were similar for the QBS33 and QBS66 models (Figure 2). However, the permanent environmental variance was underestimated in the QBS63 model, most likely due to the overestimation of the direct additive genetic variance. The estimates of permanent environmental variances increased from the beginning to approximately 500 days and were constant after this point for the MA group (Figure 2).
Number of parameters (NP) and values of −2RLL, AIC, and CAIC for quadratic B-spline random regression models for body weight of purebred Nellore and crossbred Charolais × Nellore young bulls in performance tests, according to the number of intervals to model additive genetic and permanent environmental effects
The −2RLL, AIC, and CAIC indicated different models. To assess any disparities in the selection of young bulls, the percentage of common selected bulls were compared among models (Table 4).
Mean and minimum (Min) values for the percentages of purebred Nellore and crossbred Charolais × Nellore young bulls among the top 10% for expected breeding value for body weight in standard ages within each performance test, according to the number of intervals to model additive genetic and permanent environmental effects
The lowest value for the average percentage of young Nellore bulls commonly selected among the top 10% within each performance test using the QBS43 (lowest CAIC value) or QBS65 (lowest −2RLL and AIC values) models was 85%. Despite this high average, the minimum value was only 50% for one of the performance tests.
The lowest value for the average percentage of MA young bulls selected in common in the top 10% rank using QBS63, QBS33, and QBS66 models was 67.3%, with a minimum value below 50% for some performance tests (Table 4). Furthermore, the estimates of genetic and permanent environmental variances obtained with the QBS63 model were higher and lower, respectively, than the estimates of the other models involved in this comparison (Figure 2).
The estimates of heritability obtained by QBS65, QBS43, and the most complete model (QBS66) were similar for the Nellore breed (Figure 3). However, in the simplest model (i.e., QBS33), the estimates of heritability were lower than those of the other models included in the comparison (Figure 3). The estimates of heritability for body weight of MA bulls showed similar results with QBS33 and QBS66 models. On the other hand, heritability estimates with QBS63 model were higher for nearly all ages, most likely due to the overestimation of the direct additive genetic variance (Figure 3).
Estimates of heritability for body weight of purebred Nellore (left) and crossbred Charolais × Nellore (right) young bulls in performance tests using quadratic B-spline1 models (QBS33, QBS43, QBS63, QBS65, and QBS66).
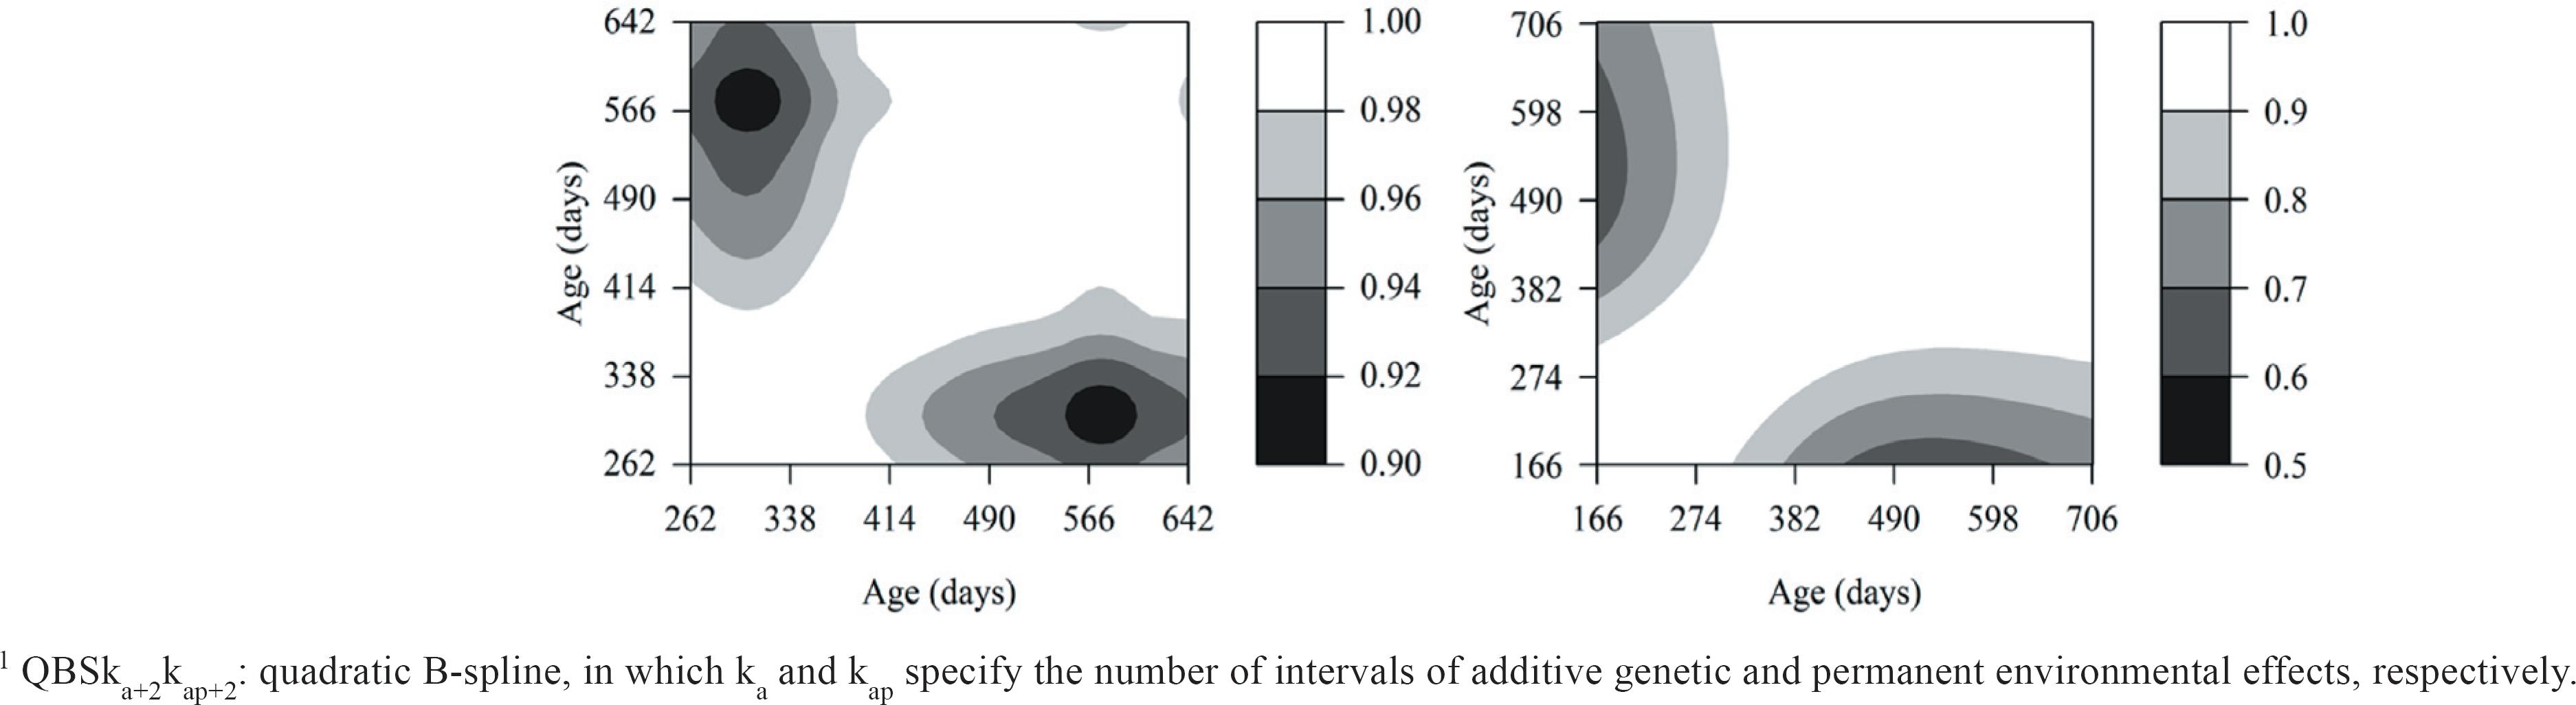
The genetic correlation between weights at different ages was high, with values above 0.92 and 0.65 for Nellore and MA groups, respectively (Figure 4).
Estimates of genetic correlations between body weights in different ages of purebred Nellore (left; model QBS65) and crossbred Charolais × Nellore (right; model QBS33) young bulls in performance tests using quadratic B-spline1 models.
Discussion
Heterogeneous residual variance is more appropriate for modeling body weight data at different ages because the temporary environment does not affect equally the entire animal growth trajectory (Bohmanova et al., 2005Bohmanova, J.; Misztal, I. and Bertrand, J. K. 2005. Studies on multiple trait and random regression models for genetic evaluation of beef cattle for growth. Journal of Animal Science 83:62-67.; Dias et al., 2006Dias, L. T.; Albuquerque, L. G.; Tonhati, H. and Teixeira, R. A. 2006. Estimação de parâmetros genéticos para peso do nascimento aos 550 dias de idade para animais da raça Tabapuã utilizando-se modelos de regressão aleatória. Revista Brasileira de Zootecnia 35:1915-1925.; Toral et al., 2009Toral, F. L. B.; Alencar, M. M. and Freitas, A. R. 2009. Estruturas de variância residual para estimação de funções de covariância para o peso de bovinos da raça Canchim. Revista Brasileira de Zootecnia 38:2152-2160.). However, the use of age classes in the adjust of residual variance increases the number of parameters in the models (El Faro and Albuquerque, 2003El Faro, L. and Albuquerque, L. G. 2003. Estimação de parâmetros genéticos para produção de leite no dia do controle e produção acumulada até 305 dias, para as primeiras lactações de vacas da raça Caracu. Revista Brasileira de Zootecnia 32:284-294.). Alternatively, some classes can be clustered to reduce the number of parameters in the model without compromising its fit (Toral et al., 2009Toral, F. L. B.; Alencar, M. M. and Freitas, A. R. 2009. Estruturas de variância residual para estimação de funções de covariância para o peso de bovinos da raça Canchim. Revista Brasileira de Zootecnia 38:2152-2160.). This study supports this hypothesis because models that generally showed lower information criteria values were derived from the pooling of adjacent age classes. Thus, this approach reduces the number of classes and highlights the possibility of working with different size of age classes (Table 1 and Figure 1).
The estimates of residual variances for the first and last classes of age were lower (Figure 1), especially for MA group. This result is partially justified by the small number of records at the extremes of the average growth curve and also due to a better fit of the mean trajectories at these regions. In the MA group, classes with more ages showed the worst estimates of residual variance. Moreover, this finding can be due to the combination of small number of observations within each class that inadequately fits the average growth curve. For instance, this situation was observed in the class that represents the interval from 642 to 675 days of age in the MA group for all heterogeneous residual variance models.
The CAIC indicated models with six and nine classes of residual variance for Nellore and MA group, respectively. These models co-selected several young bulls that were chosen based on the use of more parametrized residual variance structure as suggested by −2RLL and AIC. Therefore, this finding indicates that both models were as efficient as the models with more residual variance classes for the two genetic groups. This result confirms the possibility of pooling age classes with up to 40% differences in variance as a viable approach to reduce the number of model parameters without compromising its fit or the overall evaluation quality.
The QBS65 and QBS43 were indicated by the goodness-of-fit criteria, after testing different quadratic B-spline functions for genetic additive and permanent environmental effects. The estimates of variance and heritability were similar for both models within Nellore breed, especially at the beginning and end of the age interval. Regarding the MA group, the trends of additive genetic and permanent environmental variances were similar for the simplest (QBS33) and the most complete model (QBS66) (Figure 2). However, the permanent environmental variance was underestimated in the intermediate model (QBS63), most likely because of the overestimation of the direct additive genetic variation (Figure 2). According to Meyer (2005bMeyer, K. 2005b. Random regression analyses using B-spline to model growth of Australian Angus cattle. Genetics Selection Evolution 37:473-500.), few and dispersed records at the upper end of the curve caused problems when estimating the variance components. Particularly, the direct permanent environmental effect showed remarkable dependency between the variance estimates and the order of the polynomials.
The phenotypic variance trends were similar for all models (Figure 2), which suggest that differences between models are related to the partition of the variances.
The differences between estimates of heritability for body weight of MA bulls in performance tests (Figure 3) reflected differences in the estimates of additive genetic variances of the models QBS33, QBS63, and QBS66. The use of different models can result in disparities between variance components (Albuquerque and Meyer, 2001Albuquerque, L. G. and Meyer, K. 2001. Estimates of covariance functions for growth from birth to 630 days of age in Nelore cattle. Journal of Animal Science 79:2776-2789.; Toral et al., 2009Toral, F. L. B.; Alencar, M. M. and Freitas, A. R. 2009. Estruturas de variância residual para estimação de funções de covariância para o peso de bovinos da raça Canchim. Revista Brasileira de Zootecnia 38:2152-2160.). Changes in the estimates of heritability can have serious implications for the design of animal breeding programs because this parameter is essential for defining selection criteria and methods of selection.
Regarding random regression models, studying statistical fits is crucial to choose suitable models that are applicable to real datasets. In the present study, the different models indicated by the goodness-of-fit criteria did not necessarily result in different variance component. This finding supports the need for more detailed studies on the choice of statistical models for the genetic evaluation of beef cattle for body weight and, possibly, for evaluation of other traits in different species.
In general, the estimates of direct additive genetic and phenotypic variances increased with age for the two genetic groups. These results are in agreement with those obtained by Albuquerque and Meyer (2001)Albuquerque, L. G. and Meyer, K. 2001. Estimates of covariance functions for growth from birth to 630 days of age in Nelore cattle. Journal of Animal Science 79:2776-2789., Baldi et al. (2010)Baldi, F.; Alencar, M. M. and Albuquerque, L. G. 2010. Random regression analyses using B-splines functions to model growth from birth to adult age in Canchim cattle. Journal of Animal Breeding and Genetics 127:433-441., and Lopes et al. (2012)Lopes, F. B.; Magnabosco, C. U.; Paulini, F.; Silva, M. C.; Miyagi, E. S. and Lôbo, R. B. 2012. Analysis of longitudinal data of Nellore cattle from performance test at pasture using random regression model. SpringerPlus 1:49. with Nellore and Canchim (5/8 Charolais + 3/8 Zebu), and reflects changes in genetic and phenotypic variances over time.
The present study showed oscillations in the estimates of permanent environmental variance, including the models with three and four intervals. However, these variations were lower for shorter periods than those reported by Dias et al. (2006)Dias, L. T.; Albuquerque, L. G.; Tonhati, H. and Teixeira, R. A. 2006. Estimação de parâmetros genéticos para peso do nascimento aos 550 dias de idade para animais da raça Tabapuã utilizando-se modelos de regressão aleatória. Revista Brasileira de Zootecnia 35:1915-1925., who used Legendre polynomials to model random effects for growth from birth to 550 days of age of Tabapuã animals. According to these authors, this increase reflects the difficulties in modeling this effect. Meyer (1999)Meyer, K. 1999. Estimates of genetic and phenotypic covariance functions for post weaning growth and mature weight of beef cows. Journal of Animal Breeding and Genetics 116:181-205. also pointed the issues of using Legendre polynomials for cattle growth, primarily because of the large emphasis that is placed on the observations at the extremes of growth curve. Meyer (2005bMeyer, K. 2005b. Random regression analyses using B-spline to model growth of Australian Angus cattle. Genetics Selection Evolution 37:473-500.) suggested using B-spline functions to correct this problem because these functions might improve the fit at the extreme of the age intervals given that the fit of each part of the trajectory is based on the number of intervals. These oscillations for short periods might be the result of the split of the age interval using B-splines, given that sharp variations in the estimates were not observed in the model with only one interval (MA group, QBS33 model) (Figure 2). Another factor which might have contributed to obtaining nearly constant estimates of permanent environmental variance is the high average number of observations per animal, which was above 4.5 for the two datasets.
In general, the estimates of residual, genetic, and phenotypic variances increased because of the increase in the mean of the trait. This finding occurred in this study to some extent, with the residual variances increasing until 550-600 days. However, modelling the average growth trajectory with different intervals and classes of residual variances might result in a better fit of this curve decreasing the values of residues.
The estimates of heritability (Figure 3) suggest that it is possible to obtain genetic gain for body weight in Nellore and MA groups through the selection. Moreover, performance tests are conducted in homogeneous environments, which provides a better partitioning of the environmental and genetic effect, and these effects can be estimated with more accuracy.
The best model for the Nellore breed (QBS65) displayed heritability estimates that increased over the age interval. The QBS33 and QBS66 models showed a decreasing trend from beginning up to 365 days of age for MA group. The same trend was observed in Nellore breed evaluated after weaning (Lopes et al., 2012Lopes, F. B.; Magnabosco, C. U.; Paulini, F.; Silva, M. C.; Miyagi, E. S. and Lôbo, R. B. 2012. Analysis of longitudinal data of Nellore cattle from performance test at pasture using random regression model. SpringerPlus 1:49.). This trend might have happened because of the confounding of genetic effects (maternal and direct), given that the MA young bulls were included in tests shortly after weaning. Dias et al. (2006)Dias, L. T.; Albuquerque, L. G.; Tonhati, H. and Teixeira, R. A. 2006. Estimação de parâmetros genéticos para peso do nascimento aos 550 dias de idade para animais da raça Tabapuã utilizando-se modelos de regressão aleatória. Revista Brasileira de Zootecnia 35:1915-1925. estimated that the maternal effect has the greatest magnitude until approximately 240 days of age. Therefore, heritability might have been overestimated for the first ages evaluated in the MA group because maternal effects were omitted. In the case of the Nellore animals, the heritability continuously increased, perhaps by not confusing the direct and maternal effects in the initial ages and because the animals underwent an adaptation period between weaning and the beginning of the test.
The percentage of animals commonly selected by different models indicates the disparities among them regarding animal ranking, which is possible and allows to choose models properly when the database is real. When the percentage of commonly selected individuals is low, the best model can be chosen based on comparisons involving the most complete model because such model is the one that best approximates the true model if the convergence of the analysis is guaranteed.
The comparison involving the two concurrent models for evaluation of body weight of Nellore bulls showed that the model with lower values of −2RLL and AIC (QBS65) provided the best fit (aside from the more complex model). Therefore, B-splines with at least four and three intervals, respectively, are recommended to fit additive and permanent environmental effects in genetic evaluation of Nellore bulls in performance tests.
The model that better fits the records of MA genetic group (CAIC, QBS33) resulted in parsimonious estimates of genetic parameters. Therefore, the choice of models for genetic evaluation should also consider the simplicity of the model and the ease of convergence.
In general, the correlations of body weight after 490 days of age were higher in both genetic groups (Figure 4), which, along with the estimates of heritability (Figure 3), suggests the possibility of direct responses and favorable correlations when the animals are selected based on their weight at the end of the performance tests.
Conclusions
B-spline functions with different residual variance structures can be applied to estimate the variance components for body weight of young bulls in performance tests. Pooling classes of age with similar residual variances reduces the number of estimated parameters and does not compromise the fit of the model. Selection of young bulls evaluated in performance test is an efficient tool to increase body weight in beef cattle.
Acknowledgments
This work was supported by the Conselho Nacional de Desenvolvimento Científico e Tecnológico (CNPq), the Coordenação de Aperfeiçoamento de Pessoal de Nível Superior (CAPES), the Fundação de Amparo à Pesquisa do Estado de Minas Gerais (FAPEMIG; PPM-00456-11, APQ-01609-16), and the Pró-Reitoria de Pesquisa da Universidade Federal de Minas Gerais. The authors thank Humberto de Freitas Tavares (Sucuri Ranch – Provados a Pasto) and João Paulo Porto (Santa Helena Ranch – Agropecuária Ipameri) for allowing the use of databases for this study.
References
- Albuquerque, L. G. and Meyer, K. 2001. Estimates of covariance functions for growth from birth to 630 days of age in Nelore cattle. Journal of Animal Science 79:2776-2789.
- Baldi, F.; Alencar, M. M. and Albuquerque, L. G. 2010. Random regression analyses using B-splines functions to model growth from birth to adult age in Canchim cattle. Journal of Animal Breeding and Genetics 127:433-441.
- Bertipaglia, T. S.; Carreño, L. O. D.; Aspilcueta-Borquis, R. R.; Boligon, A. A.; Farah, M. M.; Gomes, F. J.; Machado, C. H. C.; Rey, F. S. B. and da Fonseca, R. 2015. Estimates of genetic parameters for growth traits in Brahman cattle using random regression and multitrait models. Journal of Animal Science 93:3814-3819.
- Bohmanova, J.; Misztal, I. and Bertrand, J. K. 2005. Studies on multiple trait and random regression models for genetic evaluation of beef cattle for growth. Journal of Animal Science 83:62-67.
- Boligon, A. A.; Mercadante, M. E. Z.; Lôbo, R. B.; Baldi, F. and Albuquerque, L. G. 2012. Random regression analysis using B-splines functions to model growth of Nellore cattle. Animal 6:212-220.
- Bozdogan, H. 1987. Model selection and Akaike's information criterion (AIC): the general theory and its analytical extensions. Psychometrika 52:345-370.
- Campos, G. S.; Braccini Neto, J.; Oaigen, R. P.; Cardoso, F. F.; Cobuci, J. A.; Kern, E. L.; Campos, L. T.; Bertoli, C. D. and McManus, C. M. 2014. Bioeconomic model and selection indices in Aberdeen Angus cattle. Journal of Animal Breeding and Genetics 131:305-312.
- De Boor, C. 2001. A practical guide to splines. 2nd ed. Springer Series in Applied Mathematics. Springer Verlag, New York.
- Dias, L. T.; Albuquerque, L. G.; Tonhati, H. and Teixeira, R. A. 2006. Estimação de parâmetros genéticos para peso do nascimento aos 550 dias de idade para animais da raça Tabapuã utilizando-se modelos de regressão aleatória. Revista Brasileira de Zootecnia 35:1915-1925.
- El Faro, L. and Albuquerque, L. G. 2003. Estimação de parâmetros genéticos para produção de leite no dia do controle e produção acumulada até 305 dias, para as primeiras lactações de vacas da raça Caracu. Revista Brasileira de Zootecnia 32:284-294.
- Lopes, F. B.; Magnabosco, C. U.; Paulini, F.; Silva, M. C.; Miyagi, E. S. and Lôbo, R. B. 2012. Analysis of longitudinal data of Nellore cattle from performance test at pasture using random regression model. SpringerPlus 1:49.
- Meyer, K. 1999. Estimates of genetic and phenotypic covariance functions for post weaning growth and mature weight of beef cows. Journal of Animal Breeding and Genetics 116:181-205.
- Meyer, K. 2005a. Estimates of genetic covariance functions for growth of Angus cattle. Journal of Animal Breeding and Genetics 122:73-85.
- Meyer, K. 2005b. Random regression analyses using B-spline to model growth of Australian Angus cattle. Genetics Selection Evolution 37:473-500.
- Meyer, K. 2007. WOMBAT – A tool for mixed model analyses in quantitative genetics by restricted maximum likelihood (REML). Journal of Zhejiang University Science B 8:815-821.
- Mota, R. R.; Marques, L. F. A.; Lopes, P. S.; Silva, L. P.; Hidalgo, A. M.; Leite, C. D. S. and Torres, R. A. 2013a. Random regression models in the evaluation of the growth curve of Simbrasil beef cattle. Genetics and Molecular Research 12:528-536.
- Mota, R. R.; Marques, L. F. A.; Lopes, P. S.; Silva, L. P.; Neto, F. R. A.; Resende, M. D. V. and Torres, R. A. 2013b. Genetic evaluation using multi-trait and random regression models in Simmental beef cattle. Genetics and Molecular Research 12:2465-2480.
- Mrode, R. A. 2005. Linear models for the prediction of animal breeding values. 2nd ed. CABI Publishing, Wallingford.
- Riley, D. G.; Coleman, S. W.; Chase Jr, C. C.; Olson, T. A. and Hammond, A. C. 2007. Genetic parameters for body weight, hip height, and the ration of weight to hip height from random regression analyses of Brahman feedlot cattle. Journal of Animal Science 85:42-52.
- Sánchez, J. P.; Misztal, I.; Aguilar, I. and Bertrand, J. K. 2008. Genetic evaluation of growth in a multibreed beef cattle population using random regression-linear spline models. Journal of Animal Science 86:267-277.
- Scalez, D. C. B.; Fragomeni, B. O.; Passafaro, T. L.; Pereira, I. G. and Toral, F. L. B. 2014. Polynomials to model the growth of young bulls in performance tests. Animal 8:370-378.
- Toral, F. L. B.; Alencar, M. M. and Freitas, A. R. 2009. Estruturas de variância residual para estimação de funções de covariância para o peso de bovinos da raça Canchim. Revista Brasileira de Zootecnia 38:2152-2160.
- Wolfinger, R. D. 1993. Covariance structure selection in general mixed models. Communications in Statistics – Simulation and Computation 22:1079-1106.
Publication Dates
-
Publication in this collection
30 July 2018 -
Date of issue
2018
History
-
Received
14 Dec 2015 -
Accepted
13 Nov 2017