Abstract
Objective:
To compare results of positron emission tomography (PET) with carbon-11-labeled Pittsburgh compound B (11C-PIB) obtained with cerebellar or global brain uptake for voxel intensity normalization, describe the cortical sites with highest tracer uptake in subjects with mild Alzheimer’s disease (AD), and explore possible group differences in 11C-PIB binding to white matter.
Methods:
11C-PIB PET scans were acquired from subjects with AD (n=17) and healthy elderly controls (n=19). Voxel-based analysis was performed with statistical parametric mapping (SPM).
Results:
Cerebellar normalization showed higher 11C-PIB uptake in the AD group relative to controls throughout the cerebral cortex, involving the lateral temporal, orbitofrontal, and superior parietal cortices. With global uptake normalization, greatest cortical binding was detected in the orbitofrontal cortex; decreased 11C-PIB uptake in white matter was found in the posterior hippocampal region, corpus callosum, pons, and internal capsule.
Conclusion:
The present case-control voxelwise 11C-PIB PET comparison highlighted the regional distribution of amyloid deposition in the cerebral cortex of mildly demented AD patients. Tracer uptake was highest in the orbitofrontal cortex. Decreased 11C-PIB uptake in white-matter regions in this patient population may be a marker of white-matter damage in AD.
Amyloid PET imaging; Alzheimer’s disease; statistical parametric mapping
Introduction
Molecular brain imaging methods are clinically established tools to assist in the diagnosis of Alzheimer’s disease (AD) and other neurodegenerative diseases, as well as help predict the risk of conversion from mild cognitive impairment (MCI) to AD dementia.11. Toussaint PJ, Perlbarg V, Bellec P, Desarnaud S, Lacomblez L, Doyon J, et al. Resting state FDG-PET functional connectivity as an early biomarker of Alzheimer's disease using conjoint univariate and independent component analyses. Neuroimage. 2012;63:936-46.,22. Mosconi L, Tsui WH, Herholz K, Puri A, Drzezga A, Lucignani G, et al. Multicenter standardized 18F-FDG PET diagnosis of mild cognitive impairment, Alzheimer’s disease, and other dementias. J Nucl Med. 2008;49:390-8. The most typical positron emission tomography (PET) findings supporting the diagnosis of AD include decreased regional brain glucose metabolism, affecting mainly the temporoparietal and posterior cingulate cortices, as assessed by fluorodeoxyglucose-PET (18F-FDG-PET),33. Klunk WE, Engler H, Nordberg A, Wang Y, Blomqvist G, Holt DP, et al. Imaging brain amyloid in Alzheimer’s disease with Pittsburgh compound‐B. Ann Neurol. 2004;55:306-19. and increased overall cortical uptake of radiotracers that bind to β-amyloid (Aβ) plaques, a molecular hallmark of AD, such as Pittsburgh compound B labeled with carbon-11 (11C-PIB).33. Klunk WE, Engler H, Nordberg A, Wang Y, Blomqvist G, Holt DP, et al. Imaging brain amyloid in Alzheimer’s disease with Pittsburgh compound‐B. Ann Neurol. 2004;55:306-19.,44. Price JC, Klunk WE, Lopresti BJ, Lu X, Hoge JA, Ziolko SK, et al. Kinetic modeling of amyloid binding in humans using PET imaging and Pittsburgh compound-B. J Cereb Blood Flow Metab. 2005;25:1528-47.
Different methods for quantification of PET data have been employed in case-control studies assessing patterns of significantly increased brain uptake of amyloid imaging tracers in patients with AD. Most often, regions of interest (ROIs) placed on selected cortical portions or voxel-based methods that inspect the entire brain, such as statistical parametric mapping (SPM), have been used. By allowing unbiased, voxelwise investigations of the whole cerebral cortex, the SPM-based approach has the advantage of identifying the specific peak cortical sites where, on average, there is a greater degree of abnormal amyloid deposition in the brain of patients with AD compared to controls, as well as mapping the topography of brain regions spared by this pathological process.
A standard step in group-based brain PET studies consists in normalizing the intensity of a voxel (or the mean tracer uptake within an ROI) to a reference brain measure unaffected by the disease under investigation, thus accounting for inter-individual tracer uptake variations caused by factors such as the dose of radiolabeled tracer injected intravenously (which is similar, but not exactly equal, across individuals). After intensity normalization, imaging data based on the concentration of radioactivity in a voxel or ROI inside the brain can be safely compared between groups. Case-control 18F-FDG-PET studies of AD, for instance, have employed as reference measures either the mean tracer uptake in the whole brain or its uptake in a specific region unaffected by the neuropathological process, such as the cerebellum, pons, or sensorimotor cortex.55. Drzezga A, Grimmer T, Henriksen G, Stangier I, Perneczky R, Diehl-Schmid J, et al. Imaging of amyloid plaques and cerebral glucose metabolism in semantic dementia and Alzheimer’s disease. Neuroimage. 2008;39:619-33.
6. Dukart J, Mueller K, Horstmann A, Vogt B, Frisch S, Barthel H, et al. Differential effects of global and cerebellar normalization on detection and differentiation of dementia in FDG-PET studies. Neuroimage. 2010;49:1490-5.-77. Küntzelmann A, Guenther T, Haberkorn U, Essig M, Giesel F, Henze R, et al. Impaired cerebral glucose metabolism in prodromal Alzheimer's disease differs by regional intensity normalization. Neurosci Lett. 2013;534:12-7.
Previous SPM-based analyses of 18F-FDG-PET data showed high discrimination of patients with AD from healthy controls when using either global normalization (a procedure known as proportional scaling)55. Drzezga A, Grimmer T, Henriksen G, Stangier I, Perneczky R, Diehl-Schmid J, et al. Imaging of amyloid plaques and cerebral glucose metabolism in semantic dementia and Alzheimer’s disease. Neuroimage. 2008;39:619-33. or the reference-region approach.66. Dukart J, Mueller K, Horstmann A, Vogt B, Frisch S, Barthel H, et al. Differential effects of global and cerebellar normalization on detection and differentiation of dementia in FDG-PET studies. Neuroimage. 2010;49:1490-5.,77. Küntzelmann A, Guenther T, Haberkorn U, Essig M, Giesel F, Henze R, et al. Impaired cerebral glucose metabolism in prodromal Alzheimer's disease differs by regional intensity normalization. Neurosci Lett. 2013;534:12-7. While the reference-region approach is usually more sensitive to uncover AD-related brain hypofunctional patterns compared to healthy controls in 18F-FDG-PET studies,66. Dukart J, Mueller K, Horstmann A, Vogt B, Frisch S, Barthel H, et al. Differential effects of global and cerebellar normalization on detection and differentiation of dementia in FDG-PET studies. Neuroimage. 2010;49:1490-5.,77. Küntzelmann A, Guenther T, Haberkorn U, Essig M, Giesel F, Henze R, et al. Impaired cerebral glucose metabolism in prodromal Alzheimer's disease differs by regional intensity normalization. Neurosci Lett. 2013;534:12-7. whole-brain normalization may afford greater group discrimination specifically in AD-typical regions77. Küntzelmann A, Guenther T, Haberkorn U, Essig M, Giesel F, Henze R, et al. Impaired cerebral glucose metabolism in prodromal Alzheimer's disease differs by regional intensity normalization. Neurosci Lett. 2013;534:12-7. and better differentiation between AD and other forms of dementia. The latter finding may be explained by the fact that the global normalization procedure highlights localized foci where decreased glucose uptake is present above the overall mean level of brain hypofunction, thus demonstrating the brain areas most impacted in each different dementia subtype.66. Dukart J, Mueller K, Horstmann A, Vogt B, Frisch S, Barthel H, et al. Differential effects of global and cerebellar normalization on detection and differentiation of dementia in FDG-PET studies. Neuroimage. 2010;49:1490-5.
Since extensive cortical amyloid deposition is expected in AD cases, the reference-region approach is the method most often chosen for PET studies of AD using amyloid imaging tracers for voxelwise group comparisons.55. Drzezga A, Grimmer T, Henriksen G, Stangier I, Perneczky R, Diehl-Schmid J, et al. Imaging of amyloid plaques and cerebral glucose metabolism in semantic dementia and Alzheimer’s disease. Neuroimage. 2008;39:619-33.,88. Aalto S, Scheinin NM, Kemppainen NM, Någren K, Kailajärvi M, Leinonen M, et al. Reproducibility of automated simplified voxel-based analysis of PET amyloid ligand [11C]PIB uptake using 30-min scanning data. Eur J Nucl Med Mol Imaging. 2009;36:1651-60. Since post-mortem studies show low Congo-red and thioflavin-S staining in the cerebellum (suggesting a lack of amyloidosis), normalization of the cortical 11C-PIB binding to cerebellar tracer uptake has become a standard procedure.99. Lopresti BJ, Klunk WE, Mathis CA, Hoge JA, Ziolko SK, Lu X, et al. Simplified quantification of Pittsburgh compound B amyloid imaging PET studies: a comparative analysis. J Nucl Med. 2005;46:1959-72.,1010. Yamane T, Ishii K, Sakata M, Ikari Y, Nishio T, Ishii K, et al. Inter-rater variability of visual interpretation and comparison with quantitative evaluation of 11C-PiB PET amyloid images of the Japanese Alzheimer's disease neuroimaging initiative (J-ADNI) multicenter study. Eur J Nucl Med Mol Imaging. 2017;44:850-7. Nevertheless, one potential benefit of using proportional scaling for normalization of amyloid PET imaging data is the possibility to point out which brain regions have the highest abnormal level of cortical amyloid deposition (as in the 18F-FDG studies reviewed above). This could help identify the brain areas most impacted by amyloid deposition in different dementia subtypes and correlate such findings with those seen in other PET imaging methods.1111. Shin J, Lee SY, Kim SJ, Kim SH, Cho SJ, Kim YB. Voxel-based analysis of Alzheimer’s disease PET imaging using a triplet of radiotracers: PIB, FDDNP, and FDG. Neuroimage. 2010;52:488-96. However, amyloid PET imaging studies of AD systematically comparing results obtained with the two different approaches for tracer uptake normalization have been scarce to date.
One other issue rarely explored in PET studies using amyloid imaging tracers regards the concurrent assessment of between-group differences in white- and gray-matter tracer uptake. The presence of pathological white-matter changes early in the course of AD is being progressively recognized,1212. Radanovic M, Pereira FR, Stella F, Aprahamian I, Ferreira LK, Forlenza OV, et al. White matter abnormalities associated with Alzheimer's disease and mild cognitive impairment: a critical review of MRI studies. Expert Rev Neurother. 2013;13:483-93. and it has been demonstrated that 11C-PIB has a high affinity for white matter.44. Price JC, Klunk WE, Lopresti BJ, Lu X, Hoge JA, Ziolko SK, et al. Kinetic modeling of amyloid binding in humans using PET imaging and Pittsburgh compound-B. J Cereb Blood Flow Metab. 2005;25:1528-47.,1313. Stankoff B, Freeman L, Aigrot MS, Chardain A, Dollé F, Williams A, et al. Imaging central nervous system myelin by positron emission tomography in multiple sclerosis using [methyl-11C]-2-(4'-methylaminophenyl)- 6-hydroxybenzothiazole. Ann Neurol. 2011;69:673-80. Therefore, the use of PET with 11C-PIB may potentially uncover white-matter foci of differential tracer uptake between patients with AD and healthy controls or subjects with other types of dementia.
In the present study, we used SPM to conduct a comparative analysis of 11C-PIB-PET data obtained from a group of elderly patients with AD against age- and gender-matched healthy controls. Our aims were: to describe the topographical distribution of the cortical sites with highest tracer uptake in subjects with very mild or mild Alzheimer’s dementia, based on the Clinical Dementia Rating (CDR)1414. Maia ALG, Godinho C, Ferreira ED, Almeida V, Schuh A, Kaye J, et al. Aplicação da versão brasileira da escala de avaliação clínica da demência (Clinical Dementia Rating – CDR) em amostras de pacientes com demência. Arq Neuropsiquiatr. 2006;64:485-9.; to compare results obtained with two different normalization approaches, respectively cerebellar grey matter uptake (as reference region) and global tracer uptake (proportional scaling); and to explore possible differences in 11C-PIB binding to white matter between subjects with AD and healthy individuals.
Methods
Study population
Seventeen patients with AD and 19 healthy elderly volunteers were enrolled in the study. Approval was obtained from the ethics committee of Hospital das Clínicas, Faculdade de Medicina, Universidade de São Paulo (USP), Brazil (CAPPesq 368.037), and informed consent was obtained from all participants (or, in the AD group, their caregivers).
Patients with AD were recruited from outpatient memory clinics of the departments of Neurology (n=12) and Psychiatry (n=5) of Faculdade de Medicina, USP. All patients fulfilled the National Institute on Aging and Alzheimer's Association (NIA-AA) criteria for probable AD dementia.1515. McKhann GM, Knopman DS, Chertkow H, Hyman BT, Jack CR Jr, Kawas CH, et al. The diagnosis of dementia due to Alzheimer's disease: recommendations from the national institute on aging-Alzheimer's association workgroups on diagnostic guidelines for Alzheimer's disease. Alzheimers Dement. 2011;7:263-9. All patients and at least one close family member underwent structured interviewing using the Structured Clinical Interview for DSM-IV (SCID-IV), translated and adapted to Portuguese,1616. Del-Ben CM, Vilela JAA, Crippa JAS, Hallak JEC, Labate CM, Zuardi AW. Confiabilidade da "Entrevista Clínica Estruturada para o DSM-IV – Versão Clínica" traduzida para o português. Rev Bras Psiquiatr. 2001;23:159-9. to confirm the presence of dementia and investigate present or lifetime history of psychiatric disorders. The presence of consistent cognitive deficits compatible with the diagnosis of AD was documented by an extensive neuropsychological assessment, including tests evaluating episodic and semantic memory, attention, processing speed, language, and executive functioning. The clinical severity of dementia was assessed using the CDR scale,1414. Maia ALG, Godinho C, Ferreira ED, Almeida V, Schuh A, Kaye J, et al. Aplicação da versão brasileira da escala de avaliação clínica da demência (Clinical Dementia Rating – CDR) em amostras de pacientes com demência. Arq Neuropsiquiatr. 2006;64:485-9. the Blessed scale,1717. Blessed G, Tomlinson BE, Roth M. The association between quantitative measures of dementia and senile change in the cerebral grey matter of elderly subjects. Br J Psychiatry. 1968;114:797-811. and the Mini-Mental State Examination (MMSE).1818. Brucki SM, Nitrini R, Caramelli P, Bertolucci PH, Okamoto IH. [Suggestions for utilization of the mini-mental state examination in Brazil]. Arq Neuropsiquiatr. 2003;61:777-81. Finally, although we did not collect comprehensive biomarker data (Aβ deposition, pathologic tau, and neurodegeneration) to biologically characterize the AD continuum in accordance with the recent NIA-AA research framework, we classified our AD subjects using the numeric clinical staging scheme proposed in the framework.1919. Jack CR Jr, Bennett DA, Blennow K, Carrillo MC, Dunn B, Haeberlein SB, et al. NIA-AA research framework: toward a biological definition of Alzheimer's disease. Alzheimers Dement. 2018;14:535-62.
Healthy controls were recruited from activity centers and groups for elderly individuals in the community. They also underwent structured interviewing using the SCID-IV1616. Del-Ben CM, Vilela JAA, Crippa JAS, Hallak JEC, Labate CM, Zuardi AW. Confiabilidade da "Entrevista Clínica Estruturada para o DSM-IV – Versão Clínica" traduzida para o português. Rev Bras Psiquiatr. 2001;23:159-9. and the extensive neuropsychological assessment described above; all controls displayed normal performance for their age range.
Subjects in the AD group had no history of neurologic or psychiatric disorders prior to the onset of dementia. Those with recent, non-stabilized depressive or anxiety disorders were also excluded. Subjects with past or current history of major psychiatric disorders and neurological conditions were also excluded from the control sample. Additional exclusion criteria for both the AD and healthy control groups were: presence of severe medical conditions or any systemic disorders associated with cognitive impairment; family history of dementia with a dominant pattern of inheritance; auditory deficits or uncorrected visual impairments that could interfere with the cognitive evaluation; and brain lesions detected incidentally on magnetic resonance imaging (MRI). In both groups, family history of AD, as well as information about current and previous medical, neurological, and psychiatric illness, was obtained during the interview with the participants as well as from at least one close family member in the case of AD subjects.
Demographic data, clinical details, and main neuropsychological characteristics for the two groups were managed using the Research Electronic Data Capture (REDCap) method2020. Harris PA, Taylor R, Thielke R, Payne J, Gonzalez N, Conde JG. Research electronic data capture (REDCap) – a metadata-driven methodology and workflow process for providing translational research informatics support. J Biomed Inform. 2009;42:377-81. and are provided in Table 1.
11C-PIB PET radiochemistry and image acquisition
Carbon-11 dioxide (11CO2) was prepared by proton bombardment of nitrogen gas (N2) with a trace amount of oxygen gas (O2) 2% via the 14N(p,α)11C nuclear reaction using the PETtrace 880 cyclotron (GE Healthcare, Uppsala, Sweden). 11CO2 produced in the cyclotron was sent to a synthesis module (Modular-Lab, Eckert & Ziegler, Berlin, Germany), where it was hydrogenated to form methane (11CH4). Methane was reacted with bromine to produce methyl bromide (11CH3Br), which, in contact with a silver triflate column, formed methyl triflate ([11C]MeOTf), which was used as the methylation agent.
[11C]MeOTf was transferred to a reaction vial containing 1 mg of 2-(4′-aminophenyl)-6-hydroxybenzothiazole (ABX, Radeberg, Germany) and 0.7 mL of 2-butanone (Sigma-Aldrich, Darmstadt, Germany). The reaction mixture was heated at 80 °C for 90 seconds. After purification by high-performance liquid chromatography (HPLC), the product was formulated in ethanol 10% in saline and quality control performed. The product was released for human injection after quality control approval (radiochemical purity > 95%; specific activity > 20 GBq/µmol).
For image acquisition, patients were placed in a PET/computerized tomography (CT) scanner (Discovery 710, GE Healthcare, Milwaukee, WI, USA). Before PET, a scout CT image was acquired at 120 kVp and 70 mA (140 mA and 0.5 s per rotation), reconstructed with the GE “PETAC” (highly smoothed) and GE “standard” (medium) filters, and used for attenuation correction. After CT, the patient’s brain was positioned in the center of the field of view (FOV) of the PET scanner. 11C-PIB, 296-740 MBq (8-20 mCi), was injected intravenously and PET imaging was begun immediately after the start of injection. 11C-PIB PET images were acquired dynamically for 70 minutes. The images were corrected for attenuation, scatter, dead time, and decay, and reconstructed using the OSEM algorithm (VPHD, GE Healthcare, Milwaukee, WI, USA), using four iterations, 16 subsets, a cutoff filter of 3 mm, and point spread function modeling (SHARP IR, GE Healthcare, Milwaukee, WI, USA). For the present study, only images obtained from 40 to 70 minutes were used for analysis.2121. Benzinger TL, Blazey T, Jack CR Jr, Koeppe RA, Su Y, Xiong C, et al. Regional variability of imaging biomarkers in autosomal dominant Alzheimer's disease. Proc Natl Acad Sci U S A. 2013;110:E4502-9. This was condensed in time to create a 30-minute static image. Illustrative time-activity curves (TACs) were made using PMOD™ version 3.4 (PMOD Technologies Ltd., Zurich, Switzerland).
No adverse effects or signs of allergic reactions were noted by the researchers conducting the image acquisition or reported by the participants or caregivers after the scans.
Structural magnetic resonance imaging (MRI) data acquisition
Anatomical MRI datasets were acquired using a Philips Achieva 3T scanner at Instituto de Radiologia, Hospital das Clínicas, Faculdade de Medicina da USP. A 3D T1-weighted scan was acquired using the following parameters: repetition time (TR) 7 ms, echo time (TE) 3.2 ms, flip angle 8°, Sense 1.5, FOV 240 × 240, matrix 240 × 240, 180 slices of 1 mm each with no gap, yielding a voxel size of 1 × 1 × 1 mm.
Protocol for statistical parametric mapping (SPM) processing of 11C-PIB PET images and PIB positivity criteria
Initially, 11C-PIB-PET and T1-MRI datasets were converted from DICOM format to NIfTI format using DCM2NII software (http://www.cabiatl.com/mricro/mricron/dcm2nii.html). 11C-PIB-PET images were co-registered to the T1-MRI datasets of the same individual using PMOD™ version 3.4. All images were oriented manually to place the anterior commissure at the origin of the three-dimensional Montreal Neurological Institute (MNI) coordinate system. Regarding 11C-PIB-PET data, all images were corrected for partial volume effects (PVEs) to avoid confounding effects secondary to the degree of regional brain atrophy2222. Thomas BA, Erlandsson K, Modat M, Thurfjell L, Vandenberghe R, Ourselin S, et al. The importance of appropriate partial volume correction for PET quantification in Alzheimer's disease. Eur J Nucl Med Mol Imaging. 2011;38:1104-19. and high white-matter uptake.2323. Matsubara K, Ibaraki M, Shimada H, Ikoma Y, Suhara T, Kinoshita T, et al. Impact of spillover from white matter by partial volume effect on quantification of amyloid deposition with [11C]PiB PET. Neuroimage. 2016;143:316-24. Thus, the co-registered 11C-PIB-PET images were corrected for PVE through the Meltzer method,2424. Meltzer CC, Cantwell MN, Greer PJ, Ben-Eliezer D, Smith G, Frank G, et al. Does cerebral blood flow decline in healthy aging? A PET study with partial-volume correction. J Nucl Med. 2000;41:1842-8. an optimized voxel-based algorithm that is fully implemented in PVElab software (http://pveout.ibb.cnr.it/PVEOut_Software.htm).2525. Quarantelli M, Berkouk K, Prinster A, Landau B, Svarer C, Balkay L, et al. Integrated software for the analysis of brain PET/SPECT studies with partial-volume-effect correction. J Nucl Med. 2004;45:192-201. Using SPM version 8 (Wellcome Trust Centre of Neuroimaging, London, United Kingdom) running in MATLAB R2012a (MathWorks, Natick, MA, USA), the T1-MRI datasets of each individual were then spatially normalized to the standard MNI space using diffeomorphic anatomical registration through exponentiated Lie algebra.2626. Ashburner J. A fast diffeomorphic image registration algorithm. Neuroimage. 2007;38:95-113. Subsequently, the steps used in the spatial normalization of T1-MRI datasets of each individual were applied to the PVE-corrected 11C-PIB-PET images in order to achieve spatial normalization to MNI space.2727. Ashburner J, Friston KJ. Unified segmentation. Neuroimage. 2005;26:839-51. Finally, the spatially normalized, PVE-corrected 11C-PIB-PET images were smoothed using an 8-mm full-width-at-half-maximum (FWHM) Gaussian filter.
All subjects in the two groups were also classified individually as PIB-positive or negative using visual analysis by two experienced nuclear medicine physicians2828. Hosokawa C, Ishii K, Hyodo T, Sakaguchi K, Usami K, Shimamoto K, et al. Investigation of 11C-PiB equivocal PET findings. Ann Nucl Med. 2015;29:164-9. assisted by automated methods (CortexID Suite® software, GE Healthcare), with a standardized uptake value ratio (SUVr) > 1.42 as the positivity criterion.2929. Jack CR Jr, Wiste HJ, Weigand SD, Therneau TM, Lowe VJ, Knopman DS, et al. Defining imaging biomarker cut points for brain aging and Alzheimer's disease. Alzheimers Dement. 2017;13:205-16.
Statistical analysis
For intensity normalization of PVE-corrected 11C-PIB-PET images using tracer uptake in the cerebellum, we divided the value of each voxel by the average of the voxels belonging to a cerebellar ROI available in the Anatomical Automatic Labeling SPM toolbox (http://www.gin.cnrs.fr/AAL). Voxelwise comparisons of PIB uptake between groups were then conducted using t tests. The resulting statistics were initially considered with a threshold of p < 0.001; the cluster was reported as significant when surpassing the p ≤ 0.05 level, familywise error (FWE)-corrected for multiple comparisons over the whole brain and with a minimum cluster size of 10 voxels.
For between-group comparisons of PVE-corrected 11C-PIB-PET data using intensity normalization to total tracer uptake in the brain, we used the proportional scale function available within SPM8. The same statistical inference approach described was employed.
Results
Clinical and social demographic data
The AD group (n=17, 10 females) had a mean age of 74.9±7.9 years and a mean educational level of 8.5±5.7 years of schooling. All but one of the 17 AD patients were right-handed. Ratings on the CDR scale were 0.5 in four cases and 1.0 in 13 cases. Patients in the AD group were classified as stage 4 (mild dementia) according to the current NIA-AA research framework.1919. Jack CR Jr, Bennett DA, Blennow K, Carrillo MC, Dunn B, Haeberlein SB, et al. NIA-AA research framework: toward a biological definition of Alzheimer's disease. Alzheimers Dement. 2018;14:535-62. Additional clinical and cognitive performance indices for the two groups are provided in Table 1. MMSE score data were missing for two AD patients; the mean score for the remaining individuals was 21.8±4.8. At the time of neuroimaging, 10 (58.8%) AD patients were on acetylcholinesterase inhibitors and seven (41.2%) were on antidepressants.
The healthy control group (14 females) had a mean age of 73.5±5.8 years and an average 14.0±4.4 years of formal education. They had no memory complaints, and their physical and neurological examination was normal. The mean MMSE score was 28.6±1.3. All controls were right-handed.
The two groups were matched for age and gender, but AD patients displayed a significantly lower educational attainment compared to controls (p = 0.0027, Table 1).
Between-group comparisons of 11C-PIB data: increased uptake in AD subjects relative to controls
When AD patients were compared to healthy controls using data normalized to uptake in the cerebellar gray matter, increased 11C-PIB uptake (at the initial p < 0.001 threshold) was detected throughout the cerebral cortex, involving mainly the lateral temporal cortex, basal portions of the frontal cortex, and superior portions of the parietal cortex. Superior portions of the prefrontal cortex and the occipital cortex were less affected, and subcortical gray-matter structures were spared. This topographical profile is shown in Figure 1. Clusters of significant difference between groups (filtered at pFWE < 0.05, corrected for multiple comparisons) are displayed in Table 2. Highest statistical significance was attained for a cluster located in the right superior parietal lobule; additional large clusters (> 200 voxels) with peak voxels located respectively in the left orbitofrontal cortex, left superior temporal gyrus, and right inferior temporal gyrus retained statistical significance, as well as nine other less-extensive clusters (< 100 voxels) in temporal, parietal, and basal frontal locations (Table 2).
Findings of increased carbon-11 labeled Pittsburgh compound B (11C-PIB) uptake in patients with Alzheimer’s disease (n=17) in comparison with healthy elderly controls (n=19) after cerebellum gray-matter normalization, highlighted in yellow (at the z >3.09 cutoff, corresponding to p < 0.001 uncorrected for multiple comparisons, and using an extent threshold of 10 voxels). Findings are overlaid on axial brain slices spatially normalized into an approximation to the Talairach and Tournoux stereotactic atlas,3030. Talairach J, Tornoux P. A Co-planar stereotaxic atlas of human brain. Stuttgart: Thieme; 1988. and the numbers associated with each frame represent standard coordinates in the z -axis. Clusters of increased 11C-PIB uptake are shown throughout the cerebral cortex. R = right side.
Comparison of 11C-PIB-PET data normalized to the total brain uptake between the two groups (at the initial p < 0.001 threshold) again showed several, though less extensive, cortical foci of increased tracer uptake in AD patients relative to controls, highlighting most prominently basal portions of the frontal cortex (Figure 2). Voxels of peak statistical difference between groups (pFWE < 0.05, corrected for multiple comparisons) are displayed in Table 3, and show statistical significance of the same magnitude as seen in the analyses with data normalized to tracer uptake in the cerebellum (Table 2). The highest statistical significance was attained for a large cluster (> 300 voxels) located in the left orbitofrontal cortex; five additional, less extensive clusters (>50 voxels) retained statistical significance, located respectively in the right inferior, left superior, and left inferior temporal gyri; right superior parietal lobule; and right orbitofrontal cortex (Table 3).
Findings of increased carbon-11 labeled Pittsburgh compound B (11C-PIB) uptake in patients with Alzheimer’s disease (n=17) in comparison with healthy elderly controls (n=19) after global brain normalization, highlighted in yellow (at the z > 3.09 cutoff, corresponding to p < 0.001 uncorrected for multiple comparisons, and using an extent threshold of 10 voxels). Findings are overlaid on axial brain slices spatially normalized into an approximation to the Talairach and Tournoux stereotactic atlas,3030. Talairach J, Tornoux P. A Co-planar stereotaxic atlas of human brain. Stuttgart: Thieme; 1988. and the numbers associated with each frame represent standard coordinates in the z-axis. Clusters are shown in several portions of the cerebral cortex, with the greatest size and statistical significance in the orbitofrontal cortex (Table 3). R = right side.
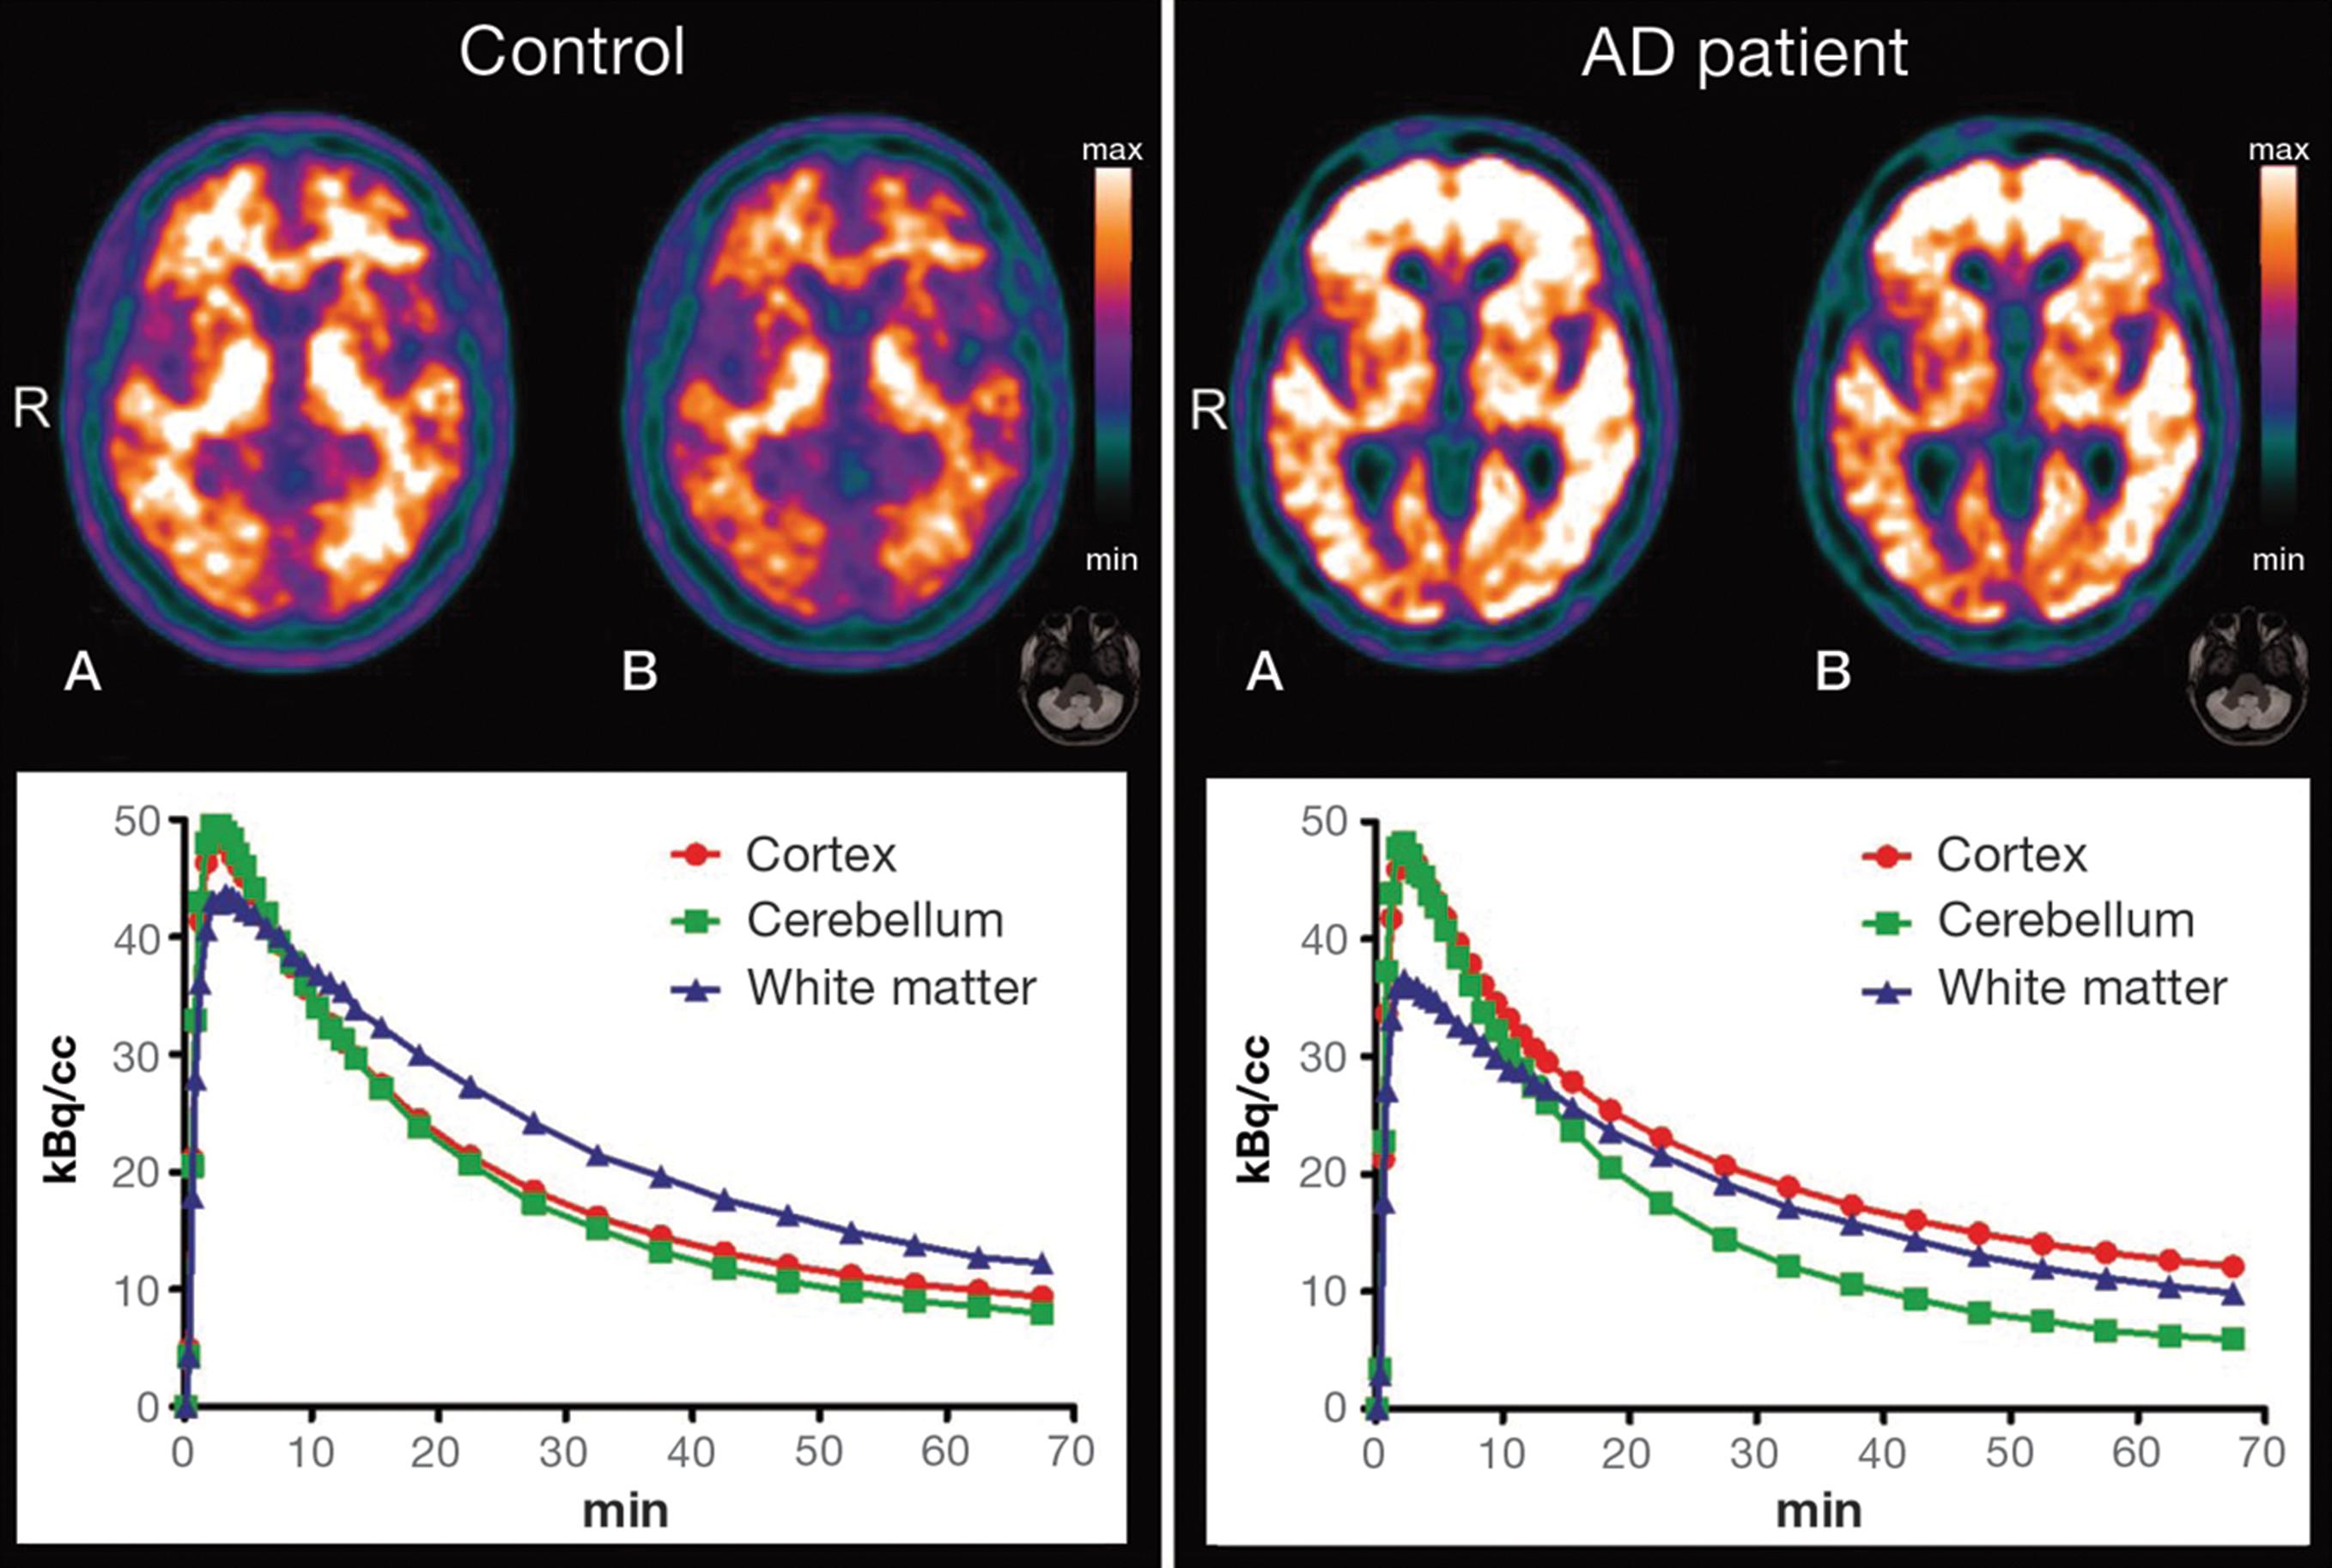
Typical patterns of 11C-PIB uptake in AD and control subjects are shown in Figure 3, with two illustrative PET images showing different normalization methods and their respective time-activity curves (TACs). TACs illustrate the increase of cortical uptake in patients with AD when compared to controls.
Illustrative positron emission tomography (PET) with carbon-11 labeled Pittsburgh compound B (11C-PIB) images (top) are shown for a healthy control subject (left-side) and an AD patient (right-side) with regional tracer uptake data normalized either to total PIB uptake in the brain (A) or to cerebellar grey-matter uptake (B). The respective time-activity curves are shown at the bottom. AD = Alzheimer’s disease; R = right side.
Between-group comparisons of 11C-PIB data: decreased uptake in patients with AD relative to controls
With 11C-PIB PET data normalized to cerebellar grey-matter uptake, a number of white-matter regions displayed reduced tracer uptake in patients with AD relative to controls at the uncorrected p < 0.001 statistical level of significance (all clusters with an associated z score greater than 3.30). However, none of those clusters retained statistical significance after FWE correction for multiple comparisons.
With 11C-PIB PET data normalized to global brain uptake, the search for brain regions showing relatively decreased tracer uptake in AD patients compared to controls revealed several foci of statistical significance located in the white-matter compartment (Figure 4). Voxels of peak statistical difference between groups (significant at the pFWE < 0.05 level, corrected for multiple comparisons), displayed in Table 3, were located bilaterally in the posterior hippocampal region, bilaterally in the splenium and in the genu of the corpus callosum, cingulum, right posterior limb of the internal capsule, and bilaterally in the pons.
Findings of decreased carbon-11 labeled Pittsburgh compound B (11C-PIB) uptake in patients with Alzheimer’s disease (n=17) compared with healthy elderly controls (n=19) after global brain uptake normalization, highlighted in yellow (at the z > 3.09 cutoff, uncorrected for multiple comparisons and using an extent threshold of 10 voxels). Findings are overlaid on axial brain slices spatially normalized into an approximation to the Talairach and Tournoux stereotactic atlas,3030. Talairach J, Tornoux P. A Co-planar stereotaxic atlas of human brain. Stuttgart: Thieme; 1988. and the numbers associated with each frame represent standard coordinates in the z-axis. Clusters are shown throughout the cerebral white matter. R = right side.
Individual classification of subjects according to PIB positivity criteria
In the AD group, 14 patients (83%) were rated as positive for the presence of cortical amyloid deposition based on visual analyses assisted by automated methods. In the control group, six individuals (31%) were rated as PIB-positive.
Discussion
When intensity normalization was performed using cerebellar tracer uptake, the voxel-based analysis performed in this study showed broadly increased cortical 11C-PIB uptake in the AD group as compared to healthy elderly controls, affecting orbitofrontal, parietal, and temporal areas most prominently. When intensity normalization was performed using proportional scaling to highlight the brain areas of greatest cortical binding of the tracer, the highest relative 11C-PIB uptake was detected in the orbitofrontal cortex. Also when data were normalized to global brain uptake, the voxel-based approach allowed us to identify areas of significantly lower tracer uptake in specific white-matter tracts in AD patients relative to controls, a finding not reported in previous 11C-PIB PET studies.
The findings of increased 11C-PIB uptake across several portions of the cerebral cortex in patients with AD are consistent with the results of previous voxel-based analyses of 11C-PIB PET data regarding both the topography of findings and the intensity of amyloid deposition, with small variations. This was shown in several previous reports using SPM and normalization to cerebellar uptake,55. Drzezga A, Grimmer T, Henriksen G, Stangier I, Perneczky R, Diehl-Schmid J, et al. Imaging of amyloid plaques and cerebral glucose metabolism in semantic dementia and Alzheimer’s disease. Neuroimage. 2008;39:619-33. as well as in a few studies using proportional scaling/global mean normalization.1111. Shin J, Lee SY, Kim SJ, Kim SH, Cho SJ, Kim YB. Voxel-based analysis of Alzheimer’s disease PET imaging using a triplet of radiotracers: PIB, FDDNP, and FDG. Neuroimage. 2010;52:488-96. The present results, obtained in an AD sample with CDR values of 0.5 to 1, highlights the fact that prominent and diffuse amyloid deposition occurs very early over the course of AD. A pattern of high 11C-PIB uptake in frontal areas, as well as in the temporal and parietal cortices, has been repeatedly reported since the first in vivo PET studies in humans33. Klunk WE, Engler H, Nordberg A, Wang Y, Blomqvist G, Holt DP, et al. Imaging brain amyloid in Alzheimer’s disease with Pittsburgh compound‐B. Ann Neurol. 2004;55:306-19. and has been validated for clinical use in several other 11C-PIB PET studies using ROI-based analysis methods.3131. Edison P, Carter SF, Rinne JO, Gelosa G, Herholz K, Nordberg A, et al. Comparison of MRI based and PET template based approaches in the quantitative analysis of amyloid imaging with PIB-PET. Neuroimage. 2013;70:423-33.
The regional distribution of increased 11C-PIB uptake within the frontal lobe in AD samples has been little addressed in previous PET investigations. Our findings indicate that, in the initial stages of AD, involvement of the frontal cortex is selective in orbital portions of this lobe. Buckner et al.3232. Buckner RL. The serendipitous discovery of the brain's default network. Neuroimage. 2012;62:1137-45. explored the relationship among amyloid deposition, atrophy, metabolism, and resting-state brain network activity. These authors suggested a possible link between neuronal activity in the default mode network (DMN) and the topography of amyloid deposition in AD.3131. Edison P, Carter SF, Rinne JO, Gelosa G, Herholz K, Nordberg A, et al. Comparison of MRI based and PET template based approaches in the quantitative analysis of amyloid imaging with PIB-PET. Neuroimage. 2013;70:423-33. Parts of the frontal cortex are highly active in the DMN, and this could explain higher amyloid deposition in frontal areas. However, Buckner et al.3232. Buckner RL. The serendipitous discovery of the brain's default network. Neuroimage. 2012;62:1137-45. focused on the overall pattern of amyloid distribution rather than on specific brain regions with peak tracer uptake. The reason why specific areas (i.e., the orbitofrontal cortex seen in the present work) would have higher deposition of amyloid is still unexplained. Sepulcre et al.3333. Sepulcre J, Sabuncu MR, Becker A, Sperling R, Johnson KA. In vivo characterization of the early states of the amyloid-beta network. Brain. 2013;136:2239-52. proposed a network-based spreading from limbic regions to the orbitofrontal cortex as being responsible for the initial topography of amyloid deposition load, which would then spread to other highly active areas of the brain, such as the DMN regions. Fjell et al.3434. Fjell AM, McEvoy L, Holland D, Dale AM, Walhovd KB; Alzheimer's Disease Neuroimaging Initiative. What is normal in normal aging? Effects of aging, amyloid and Alzheimer's disease on the cerebral cortex and the hippocampus. Prog Neurobiol. 2014;117:20-40. recently reviewed the role of amyloid deposition in brain aging and AD, arguing in favor of the view that amyloid deposition may be more prominent in brain regions of higher local neuronal activity. However, it is relevant to note that there are no significant associations between deposition of amyloid in frontal areas and AD-related signs of neurodegeneration, such as cortical atrophy in the frontal cortex.3434. Fjell AM, McEvoy L, Holland D, Dale AM, Walhovd KB; Alzheimer's Disease Neuroimaging Initiative. What is normal in normal aging? Effects of aging, amyloid and Alzheimer's disease on the cerebral cortex and the hippocampus. Prog Neurobiol. 2014;117:20-40. More prominent associations with signs of neurodegeneration are seen in lateral temporal and medial parietal areas.3434. Fjell AM, McEvoy L, Holland D, Dale AM, Walhovd KB; Alzheimer's Disease Neuroimaging Initiative. What is normal in normal aging? Effects of aging, amyloid and Alzheimer's disease on the cerebral cortex and the hippocampus. Prog Neurobiol. 2014;117:20-40. Therefore, the prominence of amyloid deposition in the orbitofrontal cortex, as detected in the present study, highlights the view that extracellular amyloid plaques, particularly in frontal areas, may not be the sole (or more critical) trigger for typical AD-related neurodegenerative processes.3434. Fjell AM, McEvoy L, Holland D, Dale AM, Walhovd KB; Alzheimer's Disease Neuroimaging Initiative. What is normal in normal aging? Effects of aging, amyloid and Alzheimer's disease on the cerebral cortex and the hippocampus. Prog Neurobiol. 2014;117:20-40. Such AD-related neurodegenerative changes in brain regions other than the frontal cortex may be more directly linked to other intracellular pathological processes, such as the accumulation of prefibrillar soluble amyloid oligomers or tau neurofibrillary tangles.3535. Sakono M, Zako T. Amyloid oligomers: formation and toxicity of Abeta oligomers. FEBS J. 2010;277:1348-58.
We aimed to explore the potential benefit of the global mean normalization approach in 11C-PIB-PET analyses to detect voxels with changes above the average uptake, depicting areas with the highest intensity of tracer uptake and, consequently, a more specific pattern in a given disease. It is known, for example, that variant forms of AD such as posterior cortical atrophy may feature a variable higher amyloid deposition in the occipital cortex.3636. Formaggio M, Costes N, Seguin J, Tholance Y, Le Bars D, Roullet-Solignac I, et al. In vivo demonstration of amyloid burden in posterior cortical atrophy: a case series with PET and CSF findings. J Neurol. 2011;258:1841-51. Also, Parkinson’s disease or dementia with Lewy bodies may feature spatial patterns of amyloid distribution distinct from those of the sporadic form of AD.3737. Gomperts SN, Rentz DM, Moran E, Becker JA, Locascio JJ, Klunk WE, et al. Imaging amyloid deposition in Lewy body diseases. Neurology. 2008;71:903-10. A method for intensity normalization with higher specificity, such as the global normalization approach, may be of special interest in those cases and may help differentiate these dementing conditions based on the topography of amyloid deposition. The findings presented herein suggest that the orbitofrontal cortex may be a key brain region for such differentiation. This possibility, however, needs to be confirmed in subsequent 11C-PIB PET investigations.
The use of whole brain-based methods for local intensity normalization of brain PET data has raised methodological doubts in previous studies.3838. Borghammer P, Aanerud J, Gjedde A. Data-driven intensity normalization of PET group comparison studies is superior to global mean normalization. Neuroimage. 2009;46:981-8. For instance, when a group of patients exhibits globally decreased brain activity (as in AD, Parkinson’s disease, and other neurodegenerative disorders), between-group comparisons against healthy individuals using globally normalized FDG-PET or regional cerebral blood flow data may display brain regions that artifactually appear hyperfunctional in patients relative to controls.3838. Borghammer P, Aanerud J, Gjedde A. Data-driven intensity normalization of PET group comparison studies is superior to global mean normalization. Neuroimage. 2009;46:981-8.,3939. Duran FL, Zampieri FG, Bottino CC, Buchpiguel CA, Busatto GF. Voxel-based investigations of regional cerebral blood flow abnormalities in Alzheimer's disease using a single-detector SPECT system. Clinics (Sao Paulo). 2007;62:377-84. Therefore, we cannot definitely exclude the possibility that our findings of lower PIB uptake in AD patients relative to controls, saliently uncovered when we used the whole-brain normalization approach, may have been at least partially artifactual.
As in many previous imaging investigations of dementia, we categorized subjects as patients with AD or healthy controls on the basis of clinical data. Recently, the NIA-AA has launched a framework which aims to redefine AD for research purposes as a biological construct, using currently available biomarker data for Aβ deposition, pathologic tau, and neurodegeneration.1919. Jack CR Jr, Bennett DA, Blennow K, Carrillo MC, Dunn B, Haeberlein SB, et al. NIA-AA research framework: toward a biological definition of Alzheimer's disease. Alzheimers Dement. 2018;14:535-62. However, based on visual analyses of our individual datasets by two experienced nuclear medicine physicians assisted by automated methods,2929. Jack CR Jr, Wiste HJ, Weigand SD, Therneau TM, Lowe VJ, Knopman DS, et al. Defining imaging biomarker cut points for brain aging and Alzheimer's disease. Alzheimers Dement. 2017;13:205-16. we found that three out of 17 AD patients (17%) were rated as negative for the presence of cortical amyloid deposition (PIB-negative). Based on the current NIA-AA research framework, the term AD would not be applicable to such individuals.1919. Jack CR Jr, Bennett DA, Blennow K, Carrillo MC, Dunn B, Haeberlein SB, et al. NIA-AA research framework: toward a biological definition of Alzheimer's disease. Alzheimers Dement. 2018;14:535-62. Also, six out of 19 controls (31%) in our investigation were rated as presenting cortical amyloid deposition (PIB-positive). Therefore, as usually reported in the 11C-PIB PET literature, not all AD patients are definitely PIB-positive and not all control individuals are definitely PIB-negative.2828. Hosokawa C, Ishii K, Hyodo T, Sakaguchi K, Usami K, Shimamoto K, et al. Investigation of 11C-PiB equivocal PET findings. Ann Nucl Med. 2015;29:164-9.,4040. Pike KE, Savage G, Villemagne VL, Ng S, Moss SA, Maruff P, et al. Beta-amyloid imaging and memory in non-demented individuals: evidence for preclinical Alzheimer's disease. Brain. 2007;130:2837-44. There are also various attempts to standardize the threshold for clinical “positivity” of PIB-PET,4141. Klunk WE, Koeppec RA, Priced JC, Benzingere TL, Devous MD Sr, Jagust WJ, et al. The Centiloid project: standardizing quantitative amyloid plaque estimation by PET. Alzheimers Dement. 2015;11:1-15.e1-4. and this issue is still an ongoing discussion. This is consistent with the current notion that Aβ pathology and cognitive abnormalities are not necessarily linearly associated with each other in the different phases of the disease. This association also changes according to the presence or absence of signs of neuronal damage.4040. Pike KE, Savage G, Villemagne VL, Ng S, Moss SA, Maruff P, et al. Beta-amyloid imaging and memory in non-demented individuals: evidence for preclinical Alzheimer's disease. Brain. 2007;130:2837-44.,4242. Mormino EC, Betensky RA, Hedden T, Schultz AP, Amariglio RE, Rentz DM, et al. Synergistic effect of β-amyloid and neurodegeneration on cognitive decline in clinically normal individuals. JAMA Neurol. 2014;71:1379-85.
Our results also showed several foci of lower tracer uptake in white matter in patients with AD relative to controls, encompassing the corpus callosum, parahippocampus, cingulum, internal capsule, and pons. Although uptake of 11C-PIB is known to occur in white-matter regions, its exact binding sites have not been defined yet. Initial publications suggested that white-matter uptake of 11C-PIB should be seen as nonspecific binding.33. Klunk WE, Engler H, Nordberg A, Wang Y, Blomqvist G, Holt DP, et al. Imaging brain amyloid in Alzheimer’s disease with Pittsburgh compound‐B. Ann Neurol. 2004;55:306-19.,44. Price JC, Klunk WE, Lopresti BJ, Lu X, Hoge JA, Ziolko SK, et al. Kinetic modeling of amyloid binding in humans using PET imaging and Pittsburgh compound-B. J Cereb Blood Flow Metab. 2005;25:1528-47. However, since 2011, some studies have shown that 11C-PIB uptake in the white matter could be related to myelin binding,1313. Stankoff B, Freeman L, Aigrot MS, Chardain A, Dollé F, Williams A, et al. Imaging central nervous system myelin by positron emission tomography in multiple sclerosis using [methyl-11C]-2-(4'-methylaminophenyl)- 6-hydroxybenzothiazole. Ann Neurol. 2011;69:673-80. potentially opening a whole new field of application for this tracer. The decreased level of uptake of 11C-PIB in the white matter detected in the AD group in our study is unlikely to be related to tracer distribution (i.e., kinetics of the tracer in the brain) due to its higher affinity for gray matter. This view is supported by the fact that uptake, retention, and clearance of 11C-PIB in white matter are similar in AD patients and healthy controls.33. Klunk WE, Engler H, Nordberg A, Wang Y, Blomqvist G, Holt DP, et al. Imaging brain amyloid in Alzheimer’s disease with Pittsburgh compound‐B. Ann Neurol. 2004;55:306-19. While the pattern of decreased white matter 11C-PIB PET uptake emerged most consistently with data normalized to global brain uptake, the same white-matter clusters also emerged in the between-group comparison with data normalized to cerebellar uptake (although they did not survive correction for multiple comparisons).
However, the fact that foci of decreased white-matter 11C-PIB PET uptake in AD patients were detected by both intensity normalization methods suggests that such white-matter findings are not an artifact induced by AD-related variations in the reference measures used for normalization. Moreover, the presence and topographical distribution of our findings of relatively reduced 11C-PIB uptake in the white-matter compartment are consistent with results of studies using diffusion tensor imaging (DTI) and morphometric MRI investigations comparing AD samples to healthy controls.1212. Radanovic M, Pereira FR, Stella F, Aprahamian I, Ferreira LK, Forlenza OV, et al. White matter abnormalities associated with Alzheimer's disease and mild cognitive impairment: a critical review of MRI studies. Expert Rev Neurother. 2013;13:483-93. Corpus callosum atrophy has been detected in several MRI studies of AD, in direct proportion to the degree of cognitive decline.4343. Griebe M, Förster A, Wessa M, Rossmanith C, Bäzner H, Sauer T, et al. Loss of callosal fiber integrity in healthy elderly with age-related white matter changes. J Neurol. 2011;258:1451-9. Decreased fractional anisotropy in the parahippocampal white matter has been previously associated with cognitive impairment in DTI studies4444. Wang PN, Chou KH, Liang JF, Lin KN, Chen WT, Lin CP. Multiple diffusivities define white matter degeneration in amnestic mild cognitive impairment and Alzheimer's disease. J Alzheimers Dis. 2012;30:423-37.,4545. Zhang Y, Schuff N, Jahng GH, Bayne W, Mori S, Schad L, et al. Diffusion tensor imaging of cingulum fibers in mild cognitive impairment and Alzheimer disease. Neurology. 2007;68:13-9. and might reflect a demyelination process in AD.4444. Wang PN, Chou KH, Liang JF, Lin KN, Chen WT, Lin CP. Multiple diffusivities define white matter degeneration in amnestic mild cognitive impairment and Alzheimer's disease. J Alzheimers Dis. 2012;30:423-37. This potential AD-related neuropathological process could be directly associated to our findings of decreased 11C-PIB uptake in the parahippocampal white matter. Studies using DTI methods have also reported changes in the parahippocampal white matter of clinically normal individuals with increased risk for AD4646. Rieckmann A, Van Dijk KR, Sperling RA, Johnson KA, Bucker RL, Hedden T. Accelerated decline in white matter integrity in clinically normal individuals at risk for Alzheimer’s disease. Neurobiol Aging. 2016;42:177-88. and in the cingulum in individuals with MCI.4545. Zhang Y, Schuff N, Jahng GH, Bayne W, Mori S, Schad L, et al. Diffusion tensor imaging of cingulum fibers in mild cognitive impairment and Alzheimer disease. Neurology. 2007;68:13-9.
The two groups investigated herein had significant differences in educational attainment, with fewer years of formal education in the AD group. We refrained from repeating our between-group PET comparisons using an ANCOVA model with years of education as a covariate, given that we cannot affirm that the significant difference in years of formal education between AD patients and controls arose by chance.4747. Miller GA, Chapman JP. Misunderstanding analysis of covariance. J Abnorm Psychol. 2001;110:40-8. However, despite this limitation, it is highly unlikely that the widespread between-group differences in PIB uptake reported herein would have emerged simply as a reflection of group differences in educational level. Alternatively, one might at most suggest that our findings might have been somehow amplified by the lower level of education of the AD group. This proposition would be consistent with the known moderating effect of education on the emergence and severity of clinical features of dementia in the presence of AD-related neurodegenerative changes,4848. Tom SE, Hubbard RA, Crane PK, Haneuse SJ, Bowen J, McCormick WC, et al. Characterization of dementia and Alzheimer's disease in an older population: updated incidence and life expectancy with and without dementia. Am J Public Health. 2015;105:408-13. as well as with the recently reported direct relationship between high education and low Aβ deposition as assessed with 11C-PIB PET.4949. Yasuno F, Kazui H, Morita N, Kajimoto K, Ihara M, Taguchi A, et al. Low amyloid-β deposition correlates with high education in cognitively normal older adults: a pilot study. Int J Geriatr Psychiatry. 2015;30:919-26.
There has been huge variation in the methods used for data acquisition and quantification in Aβ PET imaging studies to date. For instance, a number of PET studies have used 11C-PIB uptake data collected between 50 and 70 minutes after tracer injection,4141. Klunk WE, Koeppec RA, Priced JC, Benzingere TL, Devous MD Sr, Jagust WJ, et al. The Centiloid project: standardizing quantitative amyloid plaque estimation by PET. Alzheimers Dement. 2015;11:1-15.e1-4. while others have used data acquired between 40 and 60 minutes2929. Jack CR Jr, Wiste HJ, Weigand SD, Therneau TM, Lowe VJ, Knopman DS, et al. Defining imaging biomarker cut points for brain aging and Alzheimer's disease. Alzheimers Dement. 2017;13:205-16. or 40 to 70 minutes,2121. Benzinger TL, Blazey T, Jack CR Jr, Koeppe RA, Su Y, Xiong C, et al. Regional variability of imaging biomarkers in autosomal dominant Alzheimer's disease. Proc Natl Acad Sci U S A. 2013;110:E4502-9.,5050. Grimmer T, Riemenschneider M, Förstl H, Henriksen G, Klunk WE, Mathis CA, et al. Beta amyloid in Alzheimer's disease: increased deposition in brain is reflected in reduced concentration in cerebrospinal fluid. Biol Psychiatry. 2009;65:927-34. as in the present study. Also, some recent studies have normalized 11C-PIB PET data to uptake specifically in the cerebellar crus2929. Jack CR Jr, Wiste HJ, Weigand SD, Therneau TM, Lowe VJ, Knopman DS, et al. Defining imaging biomarker cut points for brain aging and Alzheimer's disease. Alzheimers Dement. 2017;13:205-16. rather than the cerebellar gray matter, as in our study. Major international efforts are underway to standardize the results of quantitative measurements of Aβ tracers using PET, such as the Centiloid Project.4141. Klunk WE, Koeppec RA, Priced JC, Benzingere TL, Devous MD Sr, Jagust WJ, et al. The Centiloid project: standardizing quantitative amyloid plaque estimation by PET. Alzheimers Dement. 2015;11:1-15.e1-4. However, it is important to stress that the present study did not aim to contribute to such standardization efforts by carrying out comparisons of different methods; instead, we wished to take advantage of the characteristics of two different methods of intensity normalization to better document the topographical distribution of the cortical sites with highest tracer uptake in AD subjects with very mild or mild dementia.
One methodological strength of the present study regards the use of methods for partial volume correction of 11C-PIB PET data, an approach recently demonstrated to improve accuracy for detection of abnormal cortical amyloid deposition.2323. Matsubara K, Ibaraki M, Shimada H, Ikoma Y, Suhara T, Kinoshita T, et al. Impact of spillover from white matter by partial volume effect on quantification of amyloid deposition with [11C]PiB PET. Neuroimage. 2016;143:316-24. On the other hand, one methodological limitation that must be acknowledged is our small sample size, which increases the risk of type II statistical errors. Nevertheless, highly significant foci of between-group differences in cortical 11C-PIB uptake were detected, thus highlighting the sensitivity of 11C-PIB-PET imaging to uncover widespread patterns of amyloid deposition in subjects with AD.
In conclusion, the present case-control voxelwise comparison of 11C-PIB uptake in the brain highlighted the regional distribution of amyloid deposition in the cerebral cortex of AD patients, emphasizing the highest uptake detected in orbital portions of the frontal cortex. In addition, we report preliminary evidence of decreased 11C-PIB uptake in white-matter regions in AD patients, suggesting that PET imaging with 11C-PIB might be useful to identify white-matter damage in AD. The latter possibility should be further explored in future multimodal imaging studies examining the same AD patients and healthy controls, using both 11C-PIB PET and DTI protocols with MRI.
Acknowledgements
This work was supported by Fundação de Amparo à Pesquisa do Estado de São Paulo (FAPESP; grant 2012/50239-6). The authors thank the Departments of Neurology and Psychiatry, Faculdade de Medicina da USP, for patient selection and referral, as well as the staff at Centro de Medicina Nuclear for technical support.
References
-
1Toussaint PJ, Perlbarg V, Bellec P, Desarnaud S, Lacomblez L, Doyon J, et al. Resting state FDG-PET functional connectivity as an early biomarker of Alzheimer's disease using conjoint univariate and independent component analyses. Neuroimage. 2012;63:936-46.
-
2Mosconi L, Tsui WH, Herholz K, Puri A, Drzezga A, Lucignani G, et al. Multicenter standardized 18F-FDG PET diagnosis of mild cognitive impairment, Alzheimer’s disease, and other dementias. J Nucl Med. 2008;49:390-8.
-
3Klunk WE, Engler H, Nordberg A, Wang Y, Blomqvist G, Holt DP, et al. Imaging brain amyloid in Alzheimer’s disease with Pittsburgh compound‐B. Ann Neurol. 2004;55:306-19.
-
4Price JC, Klunk WE, Lopresti BJ, Lu X, Hoge JA, Ziolko SK, et al. Kinetic modeling of amyloid binding in humans using PET imaging and Pittsburgh compound-B. J Cereb Blood Flow Metab. 2005;25:1528-47.
-
5Drzezga A, Grimmer T, Henriksen G, Stangier I, Perneczky R, Diehl-Schmid J, et al. Imaging of amyloid plaques and cerebral glucose metabolism in semantic dementia and Alzheimer’s disease. Neuroimage. 2008;39:619-33.
-
6Dukart J, Mueller K, Horstmann A, Vogt B, Frisch S, Barthel H, et al. Differential effects of global and cerebellar normalization on detection and differentiation of dementia in FDG-PET studies. Neuroimage. 2010;49:1490-5.
-
7Küntzelmann A, Guenther T, Haberkorn U, Essig M, Giesel F, Henze R, et al. Impaired cerebral glucose metabolism in prodromal Alzheimer's disease differs by regional intensity normalization. Neurosci Lett. 2013;534:12-7.
-
8Aalto S, Scheinin NM, Kemppainen NM, Någren K, Kailajärvi M, Leinonen M, et al. Reproducibility of automated simplified voxel-based analysis of PET amyloid ligand [11C]PIB uptake using 30-min scanning data. Eur J Nucl Med Mol Imaging. 2009;36:1651-60.
-
9Lopresti BJ, Klunk WE, Mathis CA, Hoge JA, Ziolko SK, Lu X, et al. Simplified quantification of Pittsburgh compound B amyloid imaging PET studies: a comparative analysis. J Nucl Med. 2005;46:1959-72.
-
10Yamane T, Ishii K, Sakata M, Ikari Y, Nishio T, Ishii K, et al. Inter-rater variability of visual interpretation and comparison with quantitative evaluation of 11C-PiB PET amyloid images of the Japanese Alzheimer's disease neuroimaging initiative (J-ADNI) multicenter study. Eur J Nucl Med Mol Imaging. 2017;44:850-7.
-
11Shin J, Lee SY, Kim SJ, Kim SH, Cho SJ, Kim YB. Voxel-based analysis of Alzheimer’s disease PET imaging using a triplet of radiotracers: PIB, FDDNP, and FDG. Neuroimage. 2010;52:488-96.
-
12Radanovic M, Pereira FR, Stella F, Aprahamian I, Ferreira LK, Forlenza OV, et al. White matter abnormalities associated with Alzheimer's disease and mild cognitive impairment: a critical review of MRI studies. Expert Rev Neurother. 2013;13:483-93.
-
13Stankoff B, Freeman L, Aigrot MS, Chardain A, Dollé F, Williams A, et al. Imaging central nervous system myelin by positron emission tomography in multiple sclerosis using [methyl-11C]-2-(4'-methylaminophenyl)- 6-hydroxybenzothiazole. Ann Neurol. 2011;69:673-80.
-
14Maia ALG, Godinho C, Ferreira ED, Almeida V, Schuh A, Kaye J, et al. Aplicação da versão brasileira da escala de avaliação clínica da demência (Clinical Dementia Rating – CDR) em amostras de pacientes com demência. Arq Neuropsiquiatr. 2006;64:485-9.
-
15McKhann GM, Knopman DS, Chertkow H, Hyman BT, Jack CR Jr, Kawas CH, et al. The diagnosis of dementia due to Alzheimer's disease: recommendations from the national institute on aging-Alzheimer's association workgroups on diagnostic guidelines for Alzheimer's disease. Alzheimers Dement. 2011;7:263-9.
-
16Del-Ben CM, Vilela JAA, Crippa JAS, Hallak JEC, Labate CM, Zuardi AW. Confiabilidade da "Entrevista Clínica Estruturada para o DSM-IV – Versão Clínica" traduzida para o português. Rev Bras Psiquiatr. 2001;23:159-9.
-
17Blessed G, Tomlinson BE, Roth M. The association between quantitative measures of dementia and senile change in the cerebral grey matter of elderly subjects. Br J Psychiatry. 1968;114:797-811.
-
18Brucki SM, Nitrini R, Caramelli P, Bertolucci PH, Okamoto IH. [Suggestions for utilization of the mini-mental state examination in Brazil]. Arq Neuropsiquiatr. 2003;61:777-81.
-
19Jack CR Jr, Bennett DA, Blennow K, Carrillo MC, Dunn B, Haeberlein SB, et al. NIA-AA research framework: toward a biological definition of Alzheimer's disease. Alzheimers Dement. 2018;14:535-62.
-
20Harris PA, Taylor R, Thielke R, Payne J, Gonzalez N, Conde JG. Research electronic data capture (REDCap) – a metadata-driven methodology and workflow process for providing translational research informatics support. J Biomed Inform. 2009;42:377-81.
-
21Benzinger TL, Blazey T, Jack CR Jr, Koeppe RA, Su Y, Xiong C, et al. Regional variability of imaging biomarkers in autosomal dominant Alzheimer's disease. Proc Natl Acad Sci U S A. 2013;110:E4502-9.
-
22Thomas BA, Erlandsson K, Modat M, Thurfjell L, Vandenberghe R, Ourselin S, et al. The importance of appropriate partial volume correction for PET quantification in Alzheimer's disease. Eur J Nucl Med Mol Imaging. 2011;38:1104-19.
-
23Matsubara K, Ibaraki M, Shimada H, Ikoma Y, Suhara T, Kinoshita T, et al. Impact of spillover from white matter by partial volume effect on quantification of amyloid deposition with [11C]PiB PET. Neuroimage. 2016;143:316-24.
-
24Meltzer CC, Cantwell MN, Greer PJ, Ben-Eliezer D, Smith G, Frank G, et al. Does cerebral blood flow decline in healthy aging? A PET study with partial-volume correction. J Nucl Med. 2000;41:1842-8.
-
25Quarantelli M, Berkouk K, Prinster A, Landau B, Svarer C, Balkay L, et al. Integrated software for the analysis of brain PET/SPECT studies with partial-volume-effect correction. J Nucl Med. 2004;45:192-201.
-
26Ashburner J. A fast diffeomorphic image registration algorithm. Neuroimage. 2007;38:95-113.
-
27Ashburner J, Friston KJ. Unified segmentation. Neuroimage. 2005;26:839-51.
-
28Hosokawa C, Ishii K, Hyodo T, Sakaguchi K, Usami K, Shimamoto K, et al. Investigation of 11C-PiB equivocal PET findings. Ann Nucl Med. 2015;29:164-9.
-
29Jack CR Jr, Wiste HJ, Weigand SD, Therneau TM, Lowe VJ, Knopman DS, et al. Defining imaging biomarker cut points for brain aging and Alzheimer's disease. Alzheimers Dement. 2017;13:205-16.
-
30Talairach J, Tornoux P. A Co-planar stereotaxic atlas of human brain. Stuttgart: Thieme; 1988.
-
31Edison P, Carter SF, Rinne JO, Gelosa G, Herholz K, Nordberg A, et al. Comparison of MRI based and PET template based approaches in the quantitative analysis of amyloid imaging with PIB-PET. Neuroimage. 2013;70:423-33.
-
32Buckner RL. The serendipitous discovery of the brain's default network. Neuroimage. 2012;62:1137-45.
-
33Sepulcre J, Sabuncu MR, Becker A, Sperling R, Johnson KA. In vivo characterization of the early states of the amyloid-beta network. Brain. 2013;136:2239-52.
-
34Fjell AM, McEvoy L, Holland D, Dale AM, Walhovd KB; Alzheimer's Disease Neuroimaging Initiative. What is normal in normal aging? Effects of aging, amyloid and Alzheimer's disease on the cerebral cortex and the hippocampus. Prog Neurobiol. 2014;117:20-40.
-
35Sakono M, Zako T. Amyloid oligomers: formation and toxicity of Abeta oligomers. FEBS J. 2010;277:1348-58.
-
36Formaggio M, Costes N, Seguin J, Tholance Y, Le Bars D, Roullet-Solignac I, et al. In vivo demonstration of amyloid burden in posterior cortical atrophy: a case series with PET and CSF findings. J Neurol. 2011;258:1841-51.
-
37Gomperts SN, Rentz DM, Moran E, Becker JA, Locascio JJ, Klunk WE, et al. Imaging amyloid deposition in Lewy body diseases. Neurology. 2008;71:903-10.
-
38Borghammer P, Aanerud J, Gjedde A. Data-driven intensity normalization of PET group comparison studies is superior to global mean normalization. Neuroimage. 2009;46:981-8.
-
39Duran FL, Zampieri FG, Bottino CC, Buchpiguel CA, Busatto GF. Voxel-based investigations of regional cerebral blood flow abnormalities in Alzheimer's disease using a single-detector SPECT system. Clinics (Sao Paulo). 2007;62:377-84.
-
40Pike KE, Savage G, Villemagne VL, Ng S, Moss SA, Maruff P, et al. Beta-amyloid imaging and memory in non-demented individuals: evidence for preclinical Alzheimer's disease. Brain. 2007;130:2837-44.
-
41Klunk WE, Koeppec RA, Priced JC, Benzingere TL, Devous MD Sr, Jagust WJ, et al. The Centiloid project: standardizing quantitative amyloid plaque estimation by PET. Alzheimers Dement. 2015;11:1-15.e1-4.
-
42Mormino EC, Betensky RA, Hedden T, Schultz AP, Amariglio RE, Rentz DM, et al. Synergistic effect of β-amyloid and neurodegeneration on cognitive decline in clinically normal individuals. JAMA Neurol. 2014;71:1379-85.
-
43Griebe M, Förster A, Wessa M, Rossmanith C, Bäzner H, Sauer T, et al. Loss of callosal fiber integrity in healthy elderly with age-related white matter changes. J Neurol. 2011;258:1451-9.
-
44Wang PN, Chou KH, Liang JF, Lin KN, Chen WT, Lin CP. Multiple diffusivities define white matter degeneration in amnestic mild cognitive impairment and Alzheimer's disease. J Alzheimers Dis. 2012;30:423-37.
-
45Zhang Y, Schuff N, Jahng GH, Bayne W, Mori S, Schad L, et al. Diffusion tensor imaging of cingulum fibers in mild cognitive impairment and Alzheimer disease. Neurology. 2007;68:13-9.
-
46Rieckmann A, Van Dijk KR, Sperling RA, Johnson KA, Bucker RL, Hedden T. Accelerated decline in white matter integrity in clinically normal individuals at risk for Alzheimer’s disease. Neurobiol Aging. 2016;42:177-88.
-
47Miller GA, Chapman JP. Misunderstanding analysis of covariance. J Abnorm Psychol. 2001;110:40-8.
-
48Tom SE, Hubbard RA, Crane PK, Haneuse SJ, Bowen J, McCormick WC, et al. Characterization of dementia and Alzheimer's disease in an older population: updated incidence and life expectancy with and without dementia. Am J Public Health. 2015;105:408-13.
-
49Yasuno F, Kazui H, Morita N, Kajimoto K, Ihara M, Taguchi A, et al. Low amyloid-β deposition correlates with high education in cognitively normal older adults: a pilot study. Int J Geriatr Psychiatry. 2015;30:919-26.
-
50Grimmer T, Riemenschneider M, Förstl H, Henriksen G, Klunk WE, Mathis CA, et al. Beta amyloid in Alzheimer's disease: increased deposition in brain is reflected in reduced concentration in cerebrospinal fluid. Biol Psychiatry. 2009;65:927-34.
Publication Dates
-
Publication in this collection
06 Dec 2018 -
Date of issue
Mar-Apr 2019
History
-
Received
13 Dec 2017 -
Accepted
6 July 2018