ABSTRACT
This paper examined the properties of goose eggshells to determine possible areas of improvement in egg transport and storage. First, we measured goose egg sizes and performed statistical tests, and found that the major axis, minor axis, and egg-shape index presented normal distribution. Eggshell thickness first increased and then decreased from the blunt end to the sharp end. Second, the shape of individual goose eggshell was measured using a 3D scanner. Volume equation, surface equation, and contour function of goose eggshell shape were obtained, exhibiting a highly symmetrical structure. Finally, goose eggs were compressed along their major and minor axes between two plates. Breaking strength was highly dependent on the shape index. A crack was found on the force point along the major axis of each goose egg.
Keywords:
Goose egg; shape index; contour function; breaking strength; failure mode
INTRODUCTION
Goose eggs are rich in the nutrients that the human body requires. The eggshells have favorable compression features and a dome structure; they protect the embryos from being destroyed in nature. Despite their strength, goose eggshells may still break during the transportation between the farm and retail stores. Studies on the geometrical and mechanical characteristics of goose eggshells may lead to improvements in the design and use of equipment in goose egg transportation, processing, packaging, and storage.
Numerous studies have provided detailed descriptions of goose egg shape (Nedomová et al., 2014Nedomová Š, Buchar J. Goose eggshell geometry. Research in Agricultural Engineering 2014;60(3):100-106.). A new approach, eggshell geometry determination, analyzes digital imagery and uses cutting-edge detection techniques (Nedomová, 2005). The accuracy of egg volume and surface area calculations can be improved on the basis of measurements of egg length and width (Narushin, 2001Narushin VG. Ap-animal production technology: shape geometry of the avian egg. Journal of Agricultural Engineering Research 2001;79(79):441-448.). The equation for the profile of an avian egg was defined in a previous study by egg length and maximum width, and the mechanical characteristics of the egg were shown to play a crucial role in the processes of embryo development and successful hatching (Narushin et al., 2001; Narushin et al., 2002).
Eggshell strength has been described using variables such as eggshell thickness, eggshell hardness, and breaking strength, and infrared spectroscopy is considered the most accurate tool for predicting eggshell thickness (Ketelaere et al., 2002Ketelaere BD, Govaerts T, Coucke P, Dewil E, Visscher J. Measuring the eggshell strength of 6 different genetic strains of laying hens: techniques and comparisons. British Poultry Science 2002;43(2):238-244.; Narushin et al., 2004Narushin VG, Kempen TAV, Wineland MJ, Christensen VL. Comparing infrared spectroscopy and egg size measurements for predicting eggshell quality. Biosystems Engineering 2004;87(3):367-373.). The method of compressing eggs between two plates is used for studying their mechanical behavior (Trnka et al., 2012). Eggshell breaking strength increases with loading rate and is highly dependent on egg shape index and compression speed (Nedomová et al., 2014Nedomová Š, Buchar J. Goose eggshell geometry. Research in Agricultural Engineering 2014;60(3):100-106.; Altuntas et al., 2008Altuntas E, Sekeroglu A. Effect of egg shape index on mechanical properties of chicken eggs. Journal of Food Engineering 2008;85(4):606-612.). Breaking strength and other qualities related to eggshell damage depend on the orientation of the loading force during egg compression (Nedomova et al., 2009Nedomova S, Severa L, Buchar J. Influence of hen egg shape on eggshell compressive strength. International Agrophysics 2009;23(3):249-256.). Greater breaking strength, deformation, absorbed energy, and hardness were observed in Japanese quail eggs in response to compression along the X-front axis than along other axes (Polat et al., 2007Polat R, Tarhan S, Çetin M, Atay U. Mechanical behaviour under compression loading and some physical parameters of japanese quail (coturnix coturnix japonica) eggs. Czech Journal of Animal Science 2007;52(2):50-56.). Structural failure corresponds to crack propagation but not to crack initiation (Niall et al., 2006). Dominant resonance frequency was observed to be lower in eggs that were left intact (Wang et al., 2005Wang J, Jiang R. Eggshell crack detection by dynamic frequency analysis. European Food Research & Technology 2005;221(1):214-220.).
However, the shell index (SI), thickness distribution, and symmetry of goose eggs have not yet been studied, and little has been written on the effects of SI on resistance to pressure of goose eggs. Additionally, no studies have reported the types of damage that can be inflicted by compression in goose eggs. Therefore, this paper analyzes the SI distribution, roundness, meridian similarity, and eggshell thickness distribution of goose eggs. The present study established the surface area, volume equation, and shape function of goose eggs, and studied their influence on the mechanical properties of the major and minor axes.
-
Nomenclature
- L Length of the major axis (mm)
- B Length of the minor axis (mm)
- SI Shape index
- Dg Geometric mean diameter (mm)
- S Surface area (mm2)
- V Volume (mm3)
- d Correction factor
- P Roundness
- U Percentage between roundness and average radius
- Rmon Mean radius (mm)
- e Eccentric distance (mm)
- Ea Energy of rupture
- F g Force of failure moment (N)
- D g Displacement of failure moment (mm)
MATERIALS AND METHODS
A sample of 333 fresh eggs was collected from a total of about 100 2-year-old geese. The geese were raised under free-range management on a commercial breeding farm in Jiangshan, Zhejiang province, China. The farm is located at approximately 28.67 degrees north and 117.54 degrees east.
The goose eggs were numbered from1 to 333. Firstly, the lengths of the major and minor axes of all goose eggs were individually measured. Secondly, the three-dimensional (3D) shapes of the goose eggs numbered 1-50 were scanned. Thirdly, the shell thicknesses of the goose eggs numbered 51-100 were measured. Fourthly, the goose eggs numbered 101-200 were compressed along their minor axes. Fifthly, the goose eggs numbered 201-300 were compressed along their major axes. It should be noted that all eggs measured were randomly selected and numbered.
The geometrical L and B parameters were measured to the nearest 0.01mm using a digital caliper. Each parameter was measured four times, and their averages were used for analyses. In order to obtain more accurate geometric shapes, goose eggs 1-50 were scanned with an Aurum 3D scanner (TingChu Techology Co., Ltd. China) to the nearest 0.004 mm.A 3D model that included contour shape characteristics was obtained.
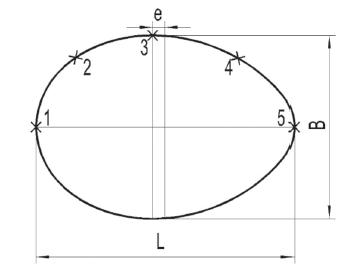
Goose eggs 51-100 were then halved along their major axes, and five points were marked along the generatrix of the eggshell (Fig.1). Point 1 was located at the top of the blunt end, Point 3 was marked at the equatorial position of the eggshell, and Point 2 was located between Points 1 and 3. Point 5 was located at the top of the sharp end, and Point 4 was located between Points 5 and 3. The thickness of every point was measured using a screw micrometer to the nearest 0.01mm. Each point was measured four times and the averages were analyzed in this study.
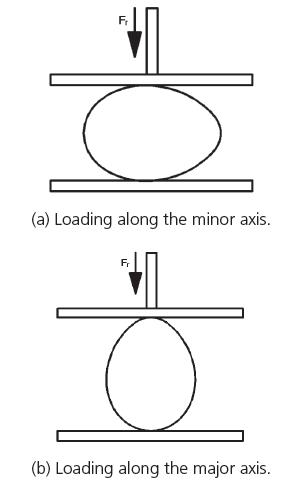
The F g property was measured using a universal testing machine (MZ-5001D1, Jiangsu Mingzhu Testing Machinery Co., Ltd. China). The accuracy of this machine is ±0.5%, and its load range is 0-250N.The goose eggs were placed on the tray of the machine, and data were recorded when the top board of machine moved down at a rate of 6mm/min (Figs. 2 and 3). Goose eggs 101-200 were compressed along their minor axes, and goose eggs 201-300 were compressed along their major axes.
RESULTS AND DISCUSSION
This study involved the measurement and analysis of the geometric and mechanical properties of goose eggs, namely their SI, S, V, symmetry, and thickness as well as resistance to pressure along the major and minor axes, the influence of the F g factor, and the types of failure modes.
Geometric size of goose eggs
This measurement includes the values of L, B, and SI, which are given in Table 1. L and B are the most intuitive descriptors of shape parameters. The data for Lranged from 60.79 to 91.02mm, with an average of 78.26mm. The data for B ranged from 44.87 to 63.05mm, with an average of 53.62mm.
The parameter SI (Eq. 1) is crucial for describing goose egg shape. Eggs were characterized as sharp, normal, or round when SI values of <72, 72-76, or >76, respectively, were obtained (Sarica et al., 2004Sarica M, Erensayin C. Poultry products. Ankara: Bey-Ofset; 2004.). As shown in Table 1, the SI value ranged between 61 and 80%, with an average of 69%. This finding is similar to previous studies. For example, Nedomová (2014Nedomová Š, Buchar J. Goose eggshell geometry. Research in Agricultural Engineering 2014;60(3):100-106.) examined 226 goose eggs and found that their SI was distributed between 55.75% and 108.63%, with an average of 65.03% (Nedomová et al., 2014). This small diffe- rence indicates that the geometrical size of goose eggs is significantly influenced by the natural environment.
The skewness and kurtosis of data for L were -0.187 and 0.333, -0.151 and -0.499 for B, and 0.407 and 0.653 for SI, respectively. The data points of all measurements approximated a straight line in the P-P diagram, a test for normal distribution. Surprisingly, the L, B, and SI of goose eggs were found to present normal distribution. To date, this finding was not reported in literature.
The distribution functions of L, B, and SI were as follows:
Analysis of surface area and volume
The 3D models of the goose eggs were constructed using the UG NX software (Wang et al., 2007Wang X, Sen LI. 3d modeling and assembly design based on ug nx. Manufacturing Technology & Machine Tool 2007;29(3):78-81.). The S and V results were obtained by measuring the 3D models directly with the software, and the theoretical calculation results were determined using the equations detailed by Mohsenin (Eqs. 5-7).
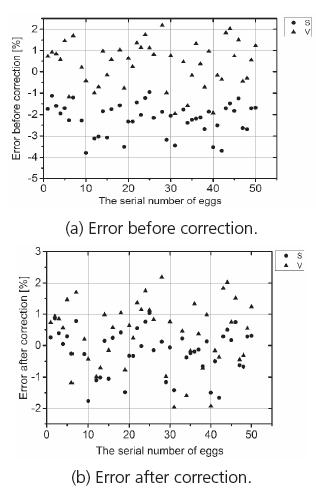
The data obtained from the test and the theoretical calculations were in good quantitative agreement (Table 2). The largest relative errors of S and V were -3.79% and 2.18%, respectively; their averages were -2.19% and 0.38%, respectively. However, the error of S was greater than that of V. Therefore, a correction coefficient, d = 1.02 was introduced to correct the predicting results (Eq. 8). This correction led to an average error of less than 0.5% in S calculation (Fig. 5). The average error for S was -0.19% after the correction coefficient was used. Therefore, the S and V of goose eggs could be accurately predicted using Eqs. 7-8.
Analysis of the symmetry
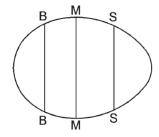
The 3D scanning model of goose eggs was created using UG NX software. A coordinate system was built in the barycenter of the 3D models. Three cross sections (M, B, and S) were constructed perpendicular to the major axes (Fig. 6). The M cross section passed through the bary center, the B cross section passed through the middle of the blunt end and barycenter, and the S cross section passed through the middle of the sharp end and barycenter. Three concentric circles of weft were positioned approximately on the cross sections.
In total, 80 equally-spaced points were marked on each weft by using CAXA 2013 software to calculate the coordinates of these points (Wang, 2002Wang Y. Techniques of caxa-eb application development. Journal of Computer Aided Design & Computer Graphics 2002;2:189-192.). The following formula was used to calculate the radius (Eq. 9) of each point. The P (Eq. 10) of each weft and U (Eq. 11) were then calculated as well.
The data for P and U are presented in Table 3. The average of P was between 0.19 and 0.22 mm, and the maximum was 0.53mm. The average of U was between 0.80% and 0.88%, with the maximum being 2.30%. The test results were far lower than 5%, indicating that the weft of a goose egg is circular. Three meridians were labeled (M1, M2, and M3) for each goose eggshell, intersecting at 120º angles (Fig. 7). The Pearson similarity between the meridians was then analyzed.
The Pearson similarity test results are shown in Table 4, which shows that the similarity between the meridians was 0.99. The goose egg had a good degree of axisymmetry along the major axis, according to the analysis results for roundness and meridians. Therefore, a meridian could be used to represent the profile curve when building a geometric model of a goose egg. A 3D geometric model could then be derived by rotating the profile curve around the major axis.
Function of goose egg shape
The contour lines of the goose eggs were extracted from the scanning results to express the egg shape in mathematical formulas. Subsequently, 300 points were marked in every contour line and the coordinates of each point were obtained and fitted to the curve by using Origin software and the existing function of egg shape (Seifert, 2014Seifert E. Originpro 9.1: scientific data analysis and graphing software-software review. Journal of Chemical Information & Modeling 2014;54(5):1552.). The degree of coincidence between the two curves was determined using the simple Pearson correlation coefficient of these point sets.
The most common functions currently used to describe the contour lines of goose eggs are the Cassini oval (Eq. 12), N-R (Eq. 13), U (Eq. 14), and K equations (Eq. 15).
The degrees of similarity are shown in Table 5. As illustrated, the curves of the Cassini oval, N-R, U, and K functions are highly similar to the contour lines of goose eggs; the average similarities are 94.76%, 99.36%, 95.25%, and 99.70%, respectively. Each similarity of the N-R and K functions is higher than 99%, indicating that these two functions may accurately predict the geometry of goose eggs. However, the standard deviation is 0.43 for the N-R function, and 0.82 for the K function, indicating that the data of the N-R function are more concentrated than that of the K function. The N-R function is therefore the most satisfactory equation to describe the contour lines of goose eggs.
Thickness of goose eggshells
The thickness of each measurement point is shown in Table 6. According to the table, the smallest average thickness was 0.479 mm at Point 1,and the greatest was 0.516 mm at Point 4. These results showed that the goose eggshells were thinnest at the blunt end and thickest in the middle. Eggshells become thicker and then thinner along the path from the blunt end to the sharp end (Fig. 8). This may be due to the fact that an air chamber is located in the blunt end of a goose egg, and the thin section in the blunt end enables convenient gas exchange with the outside environment.
Analysis of mechanical properties
The value of F g has a positive association with compression displacement when a goose egg is compressed along the major or minor axis, but before it is cracked. For example, the relationship between F g and displacement in goose egg 101is shown in Fig. 9; the highest point of the curve, indicating the largest F g value, is the time at which the goose egg ruptured. The value of F g is shown to decrease sharply when the goose egg begins to rupture. This finding was similar for other tested eggs.
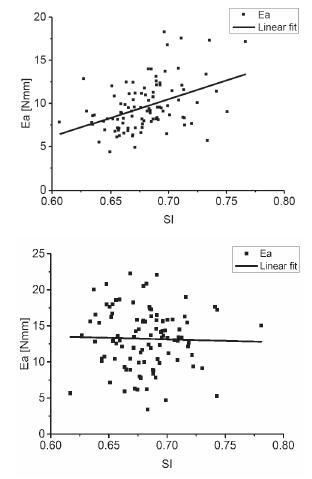
This study analyzed the largest values of F g, D g and Ea . The average value of F g was 74.169N and 105.319N when the goose eggs were compressed along the major and minor axes, respectively. The average value of F g on the major axis was considerably larger than that on the minor axis. Ea (Eq. 16) is the energy required to break a goose egg. The average Ea was 9.589N mm and 13.205N mm when the goose eggs were compressed along the major and minor axes, respectively (Table 7). This indicates that an upright position along the major axis of the goose egg is more effective than a horizontal position for reducing damage caused by squeezing during transport.
Breaking strength F g and corresponding displacement D g, and energy of rupture E a of goose eggs (No. 101-300).
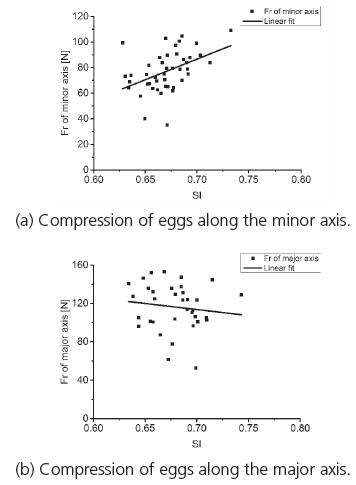
These findings extended those of Altuntas (2008Altuntas E, Sekeroglu A. Effect of egg shape index on mechanical properties of chicken eggs. Journal of Food Engineering 2008;85(4):606-612.), confirming that the breaking strength of chicken eggs along the major and minor axes was highly dependent on SI values (Altuntas et al., 2008). In order to more accurately determine the relationship between the largest values of F g, and Ea in goose eggs by using SI, these values were scatter-plotted in Fig. 10 and 11, respectively. As can be observed, both of F g and Ea increased with increasing value of SI along the minor axis, and decreased with increasing value of SI along the major axis.
The failure modes of cracked goose eggs 101-160 were also analyzed. Three types of failure modes were recorded when the goose eggs were compressed along the minor axis (Fig. 12). Type 1, observed in 44 eggs, was the extension of a crack along the major axis, beginning at the compression point. Type 2, observed in nine eggs, consisted of a crack at the blunt end. Type 3, observed in seven eggs, involved crushing at the compression point.
Three types of failure modes observed when goose eggs were compressed along the minor axis.
The failure mode of ruptured goose eggs 201-250 was also analyzed. Four types of failure modes were recorded when the eggs were compressed along the major axis (Fig. 13). Type 1, observed in 35 eggs, involved a crack extending along the major axis, beginning at the compression point. Type 2, observed in three eggs, involved a crack extending along the major axis from the sharp end. Type 3, observed in six eggs, was a pit on the blunt end. Type 4, also observed in six eggs, was a pit on the sharp end. In conclusion, when the eggs were compressed along the major axis, most of them cracked on the blunt end because this was the thinnest area of the shell.
Four types of failure modes observed when goose eggs were compressed along the major axis.
Most goose eggs cracked along the major axis when they were compressed along either the major or minor axis. The relationship between the highest F g values and the SI under these two categories of failure modes were thus further analyzed (Fig. 14). The increase in the highest F g values was more pronounced with the increase in SI when the goose eggs were compressed along the minor axis. The average highest F g value was 77.03N. The decrease in the highest values of F g was more pronounced with the increase in SI when the goose eggs were compressed along the major axis. The average highest F g value was 116.27N.
CONCLUSIONS
The geometric sizes of goose eggs, including L, B, and SI values, presented normal distribution, with averages of 78.26mm, 53.62mm, and 69%, respectively. Their thickness first increased and then decreased from the blunt end to the sharp end.
There is a considerable deviation between theoretical and experimental values when eggshell surface area is determined using the functions currently applied. As a result, the correction coefficient was introduced as d = 1.02 to improve the calculating accuracy.
Goose eggs have a symmetrical structure with circular wefts. The N-R equation is the most satisfactory method of describing the contour lines and can be used to build the profile curve of a goose egg.
The average F g value obtained along the major axis even higher than that of the minor axis. In order to reduce damage during transport, goose eggs should be stored upright, with the blunt end pointing upwards.
ACKNOWLEDGEMENTS
This research was funded by the Natural Science Foundation of Jiangsu province, China (BK20150469).
REFERENCES
- Altuntas E, Sekeroglu A. Effect of egg shape index on mechanical properties of chicken eggs. Journal of Food Engineering 2008;85(4):606-612.
- Ketelaere BD, Govaerts T, Coucke P, Dewil E, Visscher J. Measuring the eggshell strength of 6 different genetic strains of laying hens: techniques and comparisons. British Poultry Science 2002;43(2):238-244.
- Macleod N, Bain MM, Hancock JW. The mechanics and mechanisms of failure hens' eggs. International Journal of Fracture 2006;142:129-41.
- Narushin VG, Kempen TAV, Wineland MJ, Christensen VL. Comparing infrared spectroscopy and egg size measurements for predicting eggshell quality. Biosystems Engineering 2004;87(3):367-373.
- Narushin VG. Ap-animal production technology: shape geometry of the avian egg. Journal of Agricultural Engineering Research 2001;79(79):441-448.
- Narushin VG. Egg geometry calculation using the measurements of length and breadth. Poultry Science 2005;84(3):482-484.
- Narushin VG, Romanov MN. Egg physical characteristics and hatchability. Worlds Poultry Science Journal 2002;58(3):297-303.
- Nedomová Š, Buchar J, Strnková J. Goose's eggshell strength at compressive loading. Potravinarstvo Scientific Journal for Food Industry 2014;8(1):54-61.
- Nedomová Š, Buchar J. Goose eggshell geometry. Research in Agricultural Engineering 2014;60(3):100-106.
- Nedomova S, Severa L, Buchar J. Influence of hen egg shape on eggshell compressive strength. International Agrophysics 2009;23(3):249-256.
- Polat R, Tarhan S, Çetin M, Atay U. Mechanical behaviour under compression loading and some physical parameters of japanese quail (coturnix coturnix japonica) eggs. Czech Journal of Animal Science 2007;52(2):50-56.
- Sarica M, Erensayin C. Poultry products. Ankara: Bey-Ofset; 2004.
- Seifert E. Originpro 9.1: scientific data analysis and graphing software-software review. Journal of Chemical Information & Modeling 2014;54(5):1552.
- Trnka J, Buchar J, Severa L, Nedomová Š, Soklasová P. Effect of loading rate on hen's eggshell mechanics. Journal of Food Research 2002;1(4):96.
- Wang J, Jiang R. Eggshell crack detection by dynamic frequency analysis. European Food Research & Technology 2005;221(1):214-220.
- Wang X, Sen LI. 3d modeling and assembly design based on ug nx. Manufacturing Technology & Machine Tool 2007;29(3):78-81.
- Wang Y. Techniques of caxa-eb application development. Journal of Computer Aided Design & Computer Graphics 2002;2:189-192.
Publication Dates
-
Publication in this collection
Jul-Sep 2017
History
-
Received
08 Feb 2017 -
Accepted
05 May 2017
