ABSTRACT
Brazil is one of the world’s largest broiler meat exporters. Broiler meat is one of the most consumed meats worldwide. The most significant challenge for strategic business management when optimizing the financial returnis knowing exactly where to invest. The same happens in the broiler production chain. The present research aimed to investigate which were the most central actors in the broiler supply chain and the dynamics of the chain. The current study was done based on the poultry chain business relations, from 2000 to 2015, of the leading actors of the Brazilian broiler production chain. The centrality indicator was established through social network analysis (SNA) approach, to determine their positions in the chain as a whole. The most used indicators within network analysis are those designed to identify the extent to which one actor occupies a more central position than another. The Gephi® software was applied to calculate the structural attributes and indicators of the network. Results were estimated using the RapidMiner® software. A model was presented that shows one infrastructure indicator as an explanatory variable. The findings indicate that the centrality indicator was weakly influenced when compared to the other variables, such as market demand, wide variations on the scenario, and mergers or acquisitions.
Keywords:
Poultry supply chain; social network analysis; broiler market trends
INTRODUCTION
The demand for livestock production is set to rise sharply over the next few decades, especially as the world’s population grows. It is estimated that the human population in 2050 will reach 9.6 billion, with most of the increase expected in developing countries (UNDP, 2015). According to Thornton (2010Thornton PK. Livestock production: recent trends, future prospects. Philosophical Transactions of the Royal Society B: Biological Sciences 2010;365(1554):2853-2867.), this combination of growing demand in developing countries and stationary demand in industrialized countries presents a great opportunity for animal protein production in developing countries, where local production meets most of the demand, and this scenario is likely to remain stable in the predictable future. The world food economy is increasingly driven by the change in diets and food consumption patterns considering animal protein. Per capita consumption of animal protein has rapidly grown in several large countries, China and Brazil among them, which has increased the average of the developing countries and the world.
The perception of the significant change in the meat industry reflects the increase performance of the global production and poultry meat consumption. It grew by more than 5% per year, and its share of world meat production increased from 15% three decades ago to 30% nowadays. Global production of animal protein has increased substantially since the 60’s. Meat production has more than doubled, and poultry meat production has increased by about ten times, consisting of an increase in both the number of animals and the productivity index. Carcass weights have increased by about 30% for both cattle and chicken from the early 1960’s to the mid-2000s, and by about 20% for pigs (FAO, 2006).
Brazil overtook China, in 2015, as the world’s second-largest poultry meat producer, staying behind only from the United States of America. From every 11 kg of poultry exported worldwide, about 4kgcome from Brazil. The data provided by the Brazilian Institute of Geography and Statistics (IBGE, 2016) indicate that Brazilian production reached 13.14 106 tons in 2015, 5.4% more than in 2014 and the highest level ever recorded in history. Poultry raised by a substantial number of small and medium Brazilian producers, approximately 180,000 farms, are supplied mainly to two major Brazilian multinational companies. According to the ranking produced by AVISITE, both companies, BRF S.A. and JBS S.A., slaughtered 2.6 109 chickens in 2014, almost half the country’s total. When we look over exports, the level is even higher. Together the companies accounted for about 70% of poultry shipments in 2013 (AVISITE, 2016; REPÓRTER BRASIL, 2016).
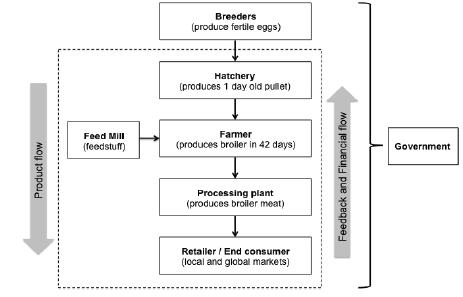
The chicken meat supply chain usually has the following configuration: breeder, poultry farm, slaughter house and the final consumer. The challenge is how to achieve better results, higher production or productivity per unit, and at the same time, improve the sustainability of the poultry industry and food safety. According to Oliveira (2012Oliveira DRMS, Nããs IA, Mollo Neto M, Canuto SA, Waker RA, Vendrametto O. Issues of sustainability on the Brazilian broiler meat production chain. Proceedings of the International Conference on Advances in Production Management Systems; 2012; Rhodes. Philadelphia: IFIP; 2012.), the poultry production chain is considered an industrial system. These industrial systems through processing plants (slaughterhouse) are the primary source of chicken meat for the markets, either domestic or export.
The product/capital/information flow starts from the producer of the one-day-old chicks at the beginning of the chain and flows into the consumer markets at the end of the chain. This flow is bidirectional. In one direction we have the products that aggregate value of each actor, and in the opposite direction, we get feedback with information plus the financial payback of their operations (Nääs, 2015Nããs IA, Mollo Neto M, Canuto SA, Waker RA, Oliveira DRMS, Vendrametto O. Brazilian chicken meat production chain:a 10-year overview. Brazilian Journal of Poultry Science 2015;17(1):87-94.).
In today’s scenario, organizational leaders face considerable challenges in managing their business units. Some goals and outcomes mustbe achieved within competitive markets. Such phenomenon can be analyzed from various perspectives to accomplish the expected results. In the present study, the social network analysis approach will be applied. Social networks analysis can improve the results of vital areas of an organization. This perspective allows leaders to identify critical points of collaboration and weaknesses in their organizations to control the criticalpoints of value (Cross & Thomas, 2009Cross R, Thomas RJ. Redes sociais: domo empresários e executivos de vanguarda as utilizam para obtenção de resultados. São Paulo: Gente; 2009.). The network process analysis provides the best insight into how the relationship between micro and macro interactions happens. In one way or another, it is through these networks that small-scale interaction transforms into large-scale patterns (Granovetter, 1973Granovetter M. The strength of weak ties. American Journal of Sociology 1973;78(6):1360-1380.).
Interorganizational networks can be made up of independent companies that are part of a business network. These networks have asa fundamental characteristic the preservation of the particularity of each company in their area, as well as reduce potential contractual risks that may occur in market transactions (Lazzarini, 2008Lazzarini SG. Empresas em rede. São Paulo: Cengage Learning; 2008.). Business networks are constituted in arrangements formed by different businesses, maintaining connections and relationships in some measure among themselves (Zaccarelli et al., 2008Zaccarelli SB, Telles R, Siqueira JPL, Boaventura JMG, Donaire D. Clusters e redes de negócios: Uma nova visão para a gestão dos negócios. São Paulo: Atlas; 2008.; Borgatti & Li, 2009Borgatti SP, Li X. On social network analysis in a supply chain context. Journal of Supply Chain Management 2009;45:5-22.). More attention should be given to the most central players considering they have a higher level of importance and strength within the network to improve the response and evolution of the broiler production chain.
The present study aimed to analyze the Brazilian broiler production chain between 2000 and 2015, and establish the level of the centrality of each actor within the chain, considering social network analysis approach.
MATERIALS AND METHODS
At first, secondary data were obtained with the objective of increasing the necessary knowledge of subjects such as chicken meat production chain; productive processes; data from the Brazilian and global markets; and social network analysis. Many reference materials were used, such as books, articles, and reports, which provided the theoretical basis for this study. In sequence, an analysis of the variables that can change as a function of local and global changes was carried out. Gephi® software was used to define the levels of the centrality of the actors in the production chain between 2000 and 2015, considering the social network analysis approach (Bastian et al., 2009Bastian M, Heymann S, Jacomy M. Gephi: an open source software for exploring and manipulating networks. Proceedings of the Third International ICWSM Conference; 2009; North America: ICWSM; 2009. p.361-362.). The focus of this paper is to present the main system components and its strength, and how they are affected bythe market changes.
The supply chain was studied, and the principal actors were identified as well as its role, products, and financial return flow. For the present study, secondary actors such as logistics companies, pharmaceutical laboratories, genetic industry, equipment, and packa-ging, were not considered. Although the feed industry is correlated and supportive, it was considereda central actor for the reason of accounting more than 66% of the production cost of live chicken (Canever, 1997Canever MD, Talamini DJD, Campos AC, Santos FJI. A cadeia produtiva do frango de corte no Brasil e na Argentina. Concordia: EMBRAPA-CNPSA; 1997.; Martins, 2005Martins SS. Avicultura de corte: situação e perspectivas em maio de 2005. Informações Econômicas 2005;35(7):57-59.; Oliveira, 2012Oliveira DRMS, Nããs IA, Mollo Neto M, Canuto SA, Waker RA, Vendrametto O. Issues of sustainability on the Brazilian broiler meat production chain. Proceedings of the International Conference on Advances in Production Management Systems; 2012; Rhodes. Philadelphia: IFIP; 2012.; AVISITE, 2016). The government has an essential role since it is connected to all the actors of the productive chain, and has the attributes to take care of taxation, biosecurity, and infrastructure (Canever, 1997). The broiler production chain is highly structured, and the main actors are arranged in a vertical integration line (Araújo et al., 2008Araújo GC, Bueno MP, Bueno VP, Sproesser RL, Souza IF. Cadeia produtiva da avicultura de corte: avaliação da apropriação de valor bruto nas transações econômicas dos agentes envolvidos. Revista Gestão e Regionalidade 2008;24(72):7-16.; Voilà & Triches, 2013). The main players selected in the broiler production chain were the hatchery, the broiler farmer, the processing plant, the feed mill, the market, and the government (Figure 1).
Interactions were analyzed, identifying the actors and their relationships. These relationships between the actors allowed the identification of the weights of their relations, and are based on the number of interactions between one actor and another during the production process. According to Lazzarini (2008Lazzarini SG. Empresas em rede. São Paulo: Cengage Learning; 2008.), to map the analyzed network, the concept of groups was used, defined as a finite set of agents, delimited by conceptual, theoretical or empirical criteria in which network measurements are performed. In this case, the group consists of the seven actors in the chain and their respective product and financial flows (Table 1).
Relationships based on the exchanges of the leading players of the Brazilian chicken production chain
Social network theory views the broiler chicken meat production chain as a system containing various actors and its relationships. The properties of the actors were adjusted and organized according to their geodesic structure and their ties according to their strength. The first step was to apply a layout algorithm (Force Atlas) to re-position the nodes in the graph to improve its readability and aesthetics. This algorithm tries to ensure as few edges cross as possible and it uses the weight of the ties. The purpose of network analysis is to analyze this system and their cause-and-effect relationships (Granovetter, 1973Granovetter M. The strength of weak ties. American Journal of Sociology 1973;78(6):1360-1380.). As suggested by the social network analysis, links connecting the players within the system can be represented as discrete events and categorized interactions, that is, a group of transactions over a period (Borgatti & Li, 2009Borgatti SP, Li X. On social network analysis in a supply chain context. Journal of Supply Chain Management 2009;45:5-22.). Relationships that support goods and information flows along the animal production chain can be represented regarding network relationships (Gaetano et al., 2013Gaetano M, Francesca MSFP. social network analysis in encouraging role-players in the beef market to take breeding decisions: a methodological study. Italian Journal of Animal Science 2013;12:53-59.). Data on goods, financial movement and market were retrieved from published materials (EMBRAPA, 2003EMBRAPA. Boas práticas de produção de frangos. Concórdia: Embrapa Suínos e Aves; 2003. [cited 2016 Mar 27]. Available from: https://www.infoteca.cnptia.embrapa.br/handle/doc/441957; FAO 2006; UBA, 2008;SINDIRAÇÕES, 2010; SINDIRAÇÕES, 2011; UBABEF, 2011; SINDIRAÇÕES, 2012;UBABEF, 2012; FAO 2013; Voilà & Triches, 2013; UBABEF, 2013; CEPEA, 2015; CEPEA, 2016; IBGE, 2016; USDA, 2016).
Four moments were used during the network analysis period to generate the graphical representation of the productive chain, done as the step two. The inter-organizational networks graphs of the broiler production chainwere obtained from the data of the actors and their ties in Gephi® software (Bastian et al., 2009Bastian M, Heymann S, Jacomy M. Gephi: an open source software for exploring and manipulating networks. Proceedings of the Third International ICWSM Conference; 2009; North America: ICWSM; 2009. p.361-362.).
Some assumptions were made considering the increased productivity in poultry production, which can be observed from three main indicators: 1) The feed conversion index (amount of feed, in kg needed to produce 1 kg of live broiler); 2) The weight and; 3) The age of the broiler chicken at the time of slaughter.
The mean feed consumed during the grow-out period was assumed as 1.75 kg of feed for each kg of weight gain, the broiler is slaughtered with 42 days, and average carcass weight is 2.3 kg (UBABEF, 2011; Costa, 2015Costa LS, Garcia LAF, Brene PRA. Panorama do setor de frango de corte no Brasil e a participação da indústria avícola paranaense no complexo dado seu alto grau de competitividade. Anais do 4º Simpósio Internacional de Gestão de Projetos, Inovação e Sustentabilidade; 2015; São Paulo. São Paulo: SINGEP; 2015. p.1-16.). We also assumed an average tax of 18% applied on all products, and as a return from the Government, 3% from the taxes are used for infrastructure and biosecurity. Thus, when we observe the main links of the broiler production chain, it is verified that the existing relations between the actors present differentiated weights, due to the goods and financial flows between them (Table 2).
Relationships based on the exchanges of the main players of the Brazilian chicken production chain
In 2003, the Brazilian poultry industry came into crisis with the outbreak of bird flu in Asian countries such as Thailand, Vietnam, China, and in countries of other continents such as the United States and Canada. There was also a drop in domestic consumption. The European countries did not want Brazil to use a particular type of antibiotic to combat the respiratory infection of the birds, generating external market restrictions (Avicultura Industrial, 2006). In the years 2005 to 2006, as a consequence of the outbreak of avian influenza, there was an average decrease of 7.53% in production for these two-year. In October 2008 there was the impact of the economic crisis, this fact caused that the year of 2009 had a decrease of 2.7%, thus damaging the production growth. The year 2010 was marked by the merger of Sadia and Perdigão companies, becoming the company Brasil Foods S.A., which owns 32.3% of the total market. JBS incorporated Seara and Pilgrim’s and became in 2013 one of the largest chicken meat production companies in the world (Costa, 2015Costa LS, Garcia LAF, Brene PRA. Panorama do setor de frango de corte no Brasil e a participação da indústria avícola paranaense no complexo dado seu alto grau de competitividade. Anais do 4º Simpósio Internacional de Gestão de Projetos, Inovação e Sustentabilidade; 2015; São Paulo. São Paulo: SINGEP; 2015. p.1-16.). Data on significant events were raisedto verify their influence on the flows between the actors of the chain (Table 3).
In the current study, the operational measurements of centrality were established using graph theory with Gephi® software, allowing data visualization in graphical format (Bastian et al., 2009Bastian M, Heymann S, Jacomy M. Gephi: an open source software for exploring and manipulating networks. Proceedings of the Third International ICWSM Conference; 2009; North America: ICWSM; 2009. p.361-362.). The more centrally positioned in the network, more capacity this actor has to access other network actors (Borgatti & Li, 2009Borgatti SP, Li X. On social network analysis in a supply chain context. Journal of Supply Chain Management 2009;45:5-22.). For networks, it is possible to work with three measures of centrality. In this case, the measure of centrality degree was used. Equation 1 calculates centrality degree, which is defined by the number of direct contacts (or adjacencies) for a particular point p k (Freeman, 1979Freeman LC. Centrality in social networks: conceptual clarification. Social Networks. 1979;1:215-239.).
Where C D = Centrality degree; p k = Network node to be considered; n = Number of nodes; a(p i ,p k ) = 1 if p i and p k are connected (number of adjacent nodes), otherwise, the value is 0.
After generating a dataset with the centrality indicators, RapidMiner® software was used to generate all the graphical results of the study (Hofmann & Klinkenberg, 2014Hofmann M, Klinkenberg R. RapidMiner: data mining use cases and business analytics applications. Minnesota: CRC Press; 2014.). The software was also applied to show the centrality degree graphically during the 15 years period.
RESULTS AND DISCUSSION
The competitiveness of the poultry production chain is expressed by impressive productivity gains in recent years, which resulted in a progressive decrease in production costs and, consequently, in the price of poultry meat compared to other meats. Therefore, chicken meat is currently one of the most produced and consumed meats in the world (ABPA, 2016; USDA, 2016). The excellent performance of the broiler production chain in Brazil reflects the process of industrial restructuring (adoption new forms of industrial organization on a large scale), technological changes and improvements in management techniques, nutrition and health of the birds occurred in Brazil since the 1970s. Table 4 presents performance indicators, and its total variance, per decade for the period from 1960 to 2010 (UBABEF, 2011).
According to FAO projections, already in the 2020s, poultry meat production is expected to overcome the production of pork and beef, thus becoming the most produced meat type in the world (FAO, 2013). The fall of the chicken meat price combined with the increase in the average income of people resulted in a steady increase in poultry meat consumption in the world. Also, changes in lifestyle and eating habits of the world population are also considered as decisive factors for the consumption increase (Costa, 2015Costa LS, Garcia LAF, Brene PRA. Panorama do setor de frango de corte no Brasil e a participação da indústria avícola paranaense no complexo dado seu alto grau de competitividade. Anais do 4º Simpósio Internacional de Gestão de Projetos, Inovação e Sustentabilidade; 2015; São Paulo. São Paulo: SINGEP; 2015. p.1-16.). Figure 2 shows the evolution of the domestic and export markets of the Brazilian broiler production chain in millions of dollars from the years 2000 to 2015. However, poultry meat production for export has grown significantly in recent decades, most of the productionis still directed to domestic markets (USDA, 2013).
The financial movement of the Brazilian broiler meat production from 2000 to 2015. Domestic market to the processing plant (a), and the export market to the processing plant (b)
Using regression analysis the value of R2 for the domestic market was 96% in a second order polynomial trendline, and the export market had the value of 90%, also in a second order polynomial trendline, which shows a strong statistical correlation between the data and the line. The future response of the production chain should remain with this trend, considering the productivity improvement of the players and the chicken meat consumption increase.
From 2000 to 2010 the merger or incorporation processes made the chicken meat market more concentrated and dynamic, since the first placed in 2000 had only 11.8% of the market, while the first one in 2010 had a 32.3% participation of the market (Costa, 2015Costa LS, Garcia LAF, Brene PRA. Panorama do setor de frango de corte no Brasil e a participação da indústria avícola paranaense no complexo dado seu alto grau de competitividade. Anais do 4º Simpósio Internacional de Gestão de Projetos, Inovação e Sustentabilidade; 2015; São Paulo. São Paulo: SINGEP; 2015. p.1-16.). The vertically coordinated system gives competitive advantages to companies and is responsible for the Brazilian achievements in both: the domestic and export markets (ABEF, 2004). In the upward chain, all activities are carried out under the command of the integrative company, with its capital and salaried labor. There is total control by the integrator (the processing plant). It operates from the production of feed, chicks, slaughter, processing, and marketing. This structure of governance between the farmer and the slaughtering industry (vertical coordination), characterized by interdependence, justifies a better distribution of appropriate gross value by the processing plant (Araújo, 2008Araújo GC, Bueno MP, Bueno VP, Sproesser RL, Souza IF. Cadeia produtiva da avicultura de corte: avaliação da apropriação de valor bruto nas transações econômicas dos agentes envolvidos. Revista Gestão e Regionalidade 2008;24(72):7-16.). Figure 3 shows the networks of the years 2000, 2005, 2010 and 2015.
It is possible to visualize that the graphs that represent the networks from years 2010 and 2015 are quite similar. The closer and thicker the tie between the players means that they have a stronger level of relationship. Since 2010, incorporation and fusion processes make the production chain more concentrated (Costa, 2015Costa LS, Garcia LAF, Brene PRA. Panorama do setor de frango de corte no Brasil e a participação da indústria avícola paranaense no complexo dado seu alto grau de competitividade. Anais do 4º Simpósio Internacional de Gestão de Projetos, Inovação e Sustentabilidade; 2015; São Paulo. São Paulo: SINGEP; 2015. p.1-16.). The centrality degree of a node is considered essential, and functions as an index of the potential activity of the node’s flow, considering the network structure as a whole (Cross & Thomas, 2009Cross R, Thomas RJ. Redes sociais: domo empresários e executivos de vanguarda as utilizam para obtenção de resultados. São Paulo: Gente; 2009.). Table 5 presents the indices that were calculated using the Gephi® software (Bastian et al., 2009Bastian M, Heymann S, Jacomy M. Gephi: an open source software for exploring and manipulating networks. Proceedings of the Third International ICWSM Conference; 2009; North America: ICWSM; 2009. p.361-362.).
The more centrally positioned the actor is, the more capacity this actor will have to access other actors in the network (Borgatti & Li, 2009Borgatti SP, Li X. On social network analysis in a supply chain context. Journal of Supply Chain Management 2009;45:5-22.). Analyzing Table 5, and considering the normalized centrality degrees for this network, it is noted that the position of the Government actor is more central than the position of the Processing plant and Farmer actors. In other words, the Government actor has a higher capacity to access, directly or indirectly, to other actors in the network. In this sense, the government’s role is to encourage the chicken meat production not only as a policy of income and employment generation but mainly as a food-security policy (BNDES, 2007). The centrality has three groups of actors at similar levels (Figure 4)
Organizations management, through social network analysis, can better understand how individual actors behave, and for that moment, seek better ways to use their financial capital to leverage an increase in operational efficiency of all productive chain (Janhonen & Johanson, 2010). Using regression analysis the result of R2 for the Processing plant present value of 89%, for the Farmer value of 60%, and for the Feed mill value of 87%, all of them in a third order polynomial trendline. The Processing plant actor is accumulating a more significant rate in centrality during the years, especially after the year 2010 (mergers and acquisitions). Farmer and Feed mill actors are decreasing its centrality due to the increase of the power of the Processing plant. According to the trend, the power of the network will continue to be concentrated in the Processing plant in the next few years, unless some unexpected event emerges in the future on the national or international scenario.
Social networks, apparently invisible, are fundamental to the performance and execution of the business strategy (Cross & Thomas, 2009Cross R, Thomas RJ. Redes sociais: domo empresários e executivos de vanguarda as utilizam para obtenção de resultados. São Paulo: Gente; 2009.). The analyzed model leads to the centrality of the network. Through the ties that reach and connect the organizational structure this model provides individuals with different access to different information, and due to this dynamic, some links become more valuable than others.
CONCLUSIONS
Brazilian poultry production activity has grown positively in the last five years and has been weakly influenced by international outbreaks of avian influenza virus. Even the economic crises that hit the broiler meat international market were not enough to slow production. Over the period 2000 to 2015 the total growth of the export and domestic markets, was approximately 800%. The Brazilian broiler meat sector has a prominent place in the world scenario due to its high degree of competitiveness and productivity.
Results from the present study showed that the broiler meat sector in Brazil has evolved and consolidated based on modern and advanced technology. The model is synergistic, combining high efficiency with a large capacity of scale production and distribution of the processing plants. The poultry production industry is probably one of the Brazilian production chains with the highest level of coordination, which gives this high competitiveness in the world market.
REFERENCES
- ABPA - Associação Brasileira de Proteína Animal. Relatório anual 2016. 2016 [cited 2017 Mar 15]. Available from: http://abpa-br.com.br/setores/avicultura/ publicacoes/relatorios-anuais/2016
» http://abpa-br.com.br/setores/avicultura/ publicacoes/relatorios-anuais/2016 - Araújo GC, Bueno MP, Bueno VP, Sproesser RL, Souza IF. Cadeia produtiva da avicultura de corte: avaliação da apropriação de valor bruto nas transações econômicas dos agentes envolvidos. Revista Gestão e Regionalidade 2008;24(72):7-16.
- Avicultura Industrial. O frango brasileiro e a hipocrisiaeuropeia. 2006 [cited 2016 Mar 15]. Available from: https://www.aviculturaindustrial.com.br/imprensa/o-frango-brasileiro-e-a-hipocrisia-europeia/20060823-092606-2947
» https://www.aviculturaindustrial.com.br/imprensa/o-frango-brasileiro-e-a-hipocrisia-europeia/20060823-092606-2947 - AVISITE - O Portal da Avicultura na Internet. O peso da alimentac¸a~o no custo do frango em 2016. 2016 [cited 2017 Feb 27]. Available from: http://avisite.com.br/index.php?page=estatisticaseprecos
» http://avisite.com.br/index.php?page=estatisticaseprecos - Bastian M, Heymann S, Jacomy M. Gephi: an open source software for exploring and manipulating networks. Proceedings of the Third International ICWSM Conference; 2009; North America: ICWSM; 2009. p.361-362.
- Borgatti SP, Li X. On social network analysis in a supply chain context. Journal of Supply Chain Management 2009;45:5-22.
- BNDS -Banco Nacional do Desenvolvimento. A cadeia da carne de frango: tensões, desafios e oportunidades. 2007 [cited 2016 Mar 20]. Available from: https://web.bndes.gov.br/bib/jspui/bitstream/1408/2681/1/BS%2026%20A%20cadeia%20de%20carne%20de%20frango_P.pdf
» https://web.bndes.gov.br/bib/jspui/bitstream/1408/2681/1/BS%2026%20A%20cadeia%20de%20carne%20de%20frango_P.pdf - Canever MD, Talamini DJD, Campos AC, Santos FJI. A cadeia produtiva do frango de corte no Brasil e na Argentina. Concordia: EMBRAPA-CNPSA; 1997.
- CEPEA - Centro de Estudos Avançados em Economia Aplicada. Custos de produção da avicultura. Piracicaba: ESALQ/USP, 2015 [cited 2017 Feb 27]. Available from: https://www.cepea.esalq.usp.br/upload/revista/pdf/0970360001468869743.pdf.
- CEPEA - Centro de Estudos Avançados em Economia Aplicada. Custos de produção da avicultura. Piracicaba: ESALQ/USP, 2016 [cited 2017 Feb 27]. Available from: https://www.cepea.esalq.usp.br/upload/revista/pdf/0305242001475605372.pdf.
- Costa LS, Garcia LAF, Brene PRA. Panorama do setor de frango de corte no Brasil e a participação da indústria avícola paranaense no complexo dado seu alto grau de competitividade. Anais do 4º Simpósio Internacional de Gestão de Projetos, Inovação e Sustentabilidade; 2015; São Paulo. São Paulo: SINGEP; 2015. p.1-16.
- Cross R, Thomas RJ. Redes sociais: domo empresários e executivos de vanguarda as utilizam para obtenção de resultados. São Paulo: Gente; 2009.
- EMBRAPA. Boas práticas de produção de frangos. Concórdia: Embrapa Suínos e Aves; 2003. [cited 2016 Mar 27]. Available from: https://www.infoteca.cnptia.embrapa.br/handle/doc/441957
- FAO - Food and Agriculture Organization of the United Nations. World agriculture: towards 2030/2050. Rome; 2006 [cited 2016 Mar 27]. Available from: http://www.fao.org/fileadmin/user_upload/esag/docs/Interim_report_AT2050web.pdf
» http://www.fao.org/fileadmin/user_upload/esag/docs/Interim_report_AT2050web.pdf - FAO - Food and Agriculture Organization of the United Nations. Food outlook, bi-annual report on global food markets. Rome; 2013 [cited 2016 Feb 27]. Available from: http://www.fao.org/docrep/019/i3473e/i3473e.pdf
» http://www.fao.org/docrep/019/i3473e/i3473e.pdf - Freeman LC. Centrality in social networks: conceptual clarification. Social Networks. 1979;1:215-239.
- Gaetano M, Francesca MSFP. social network analysis in encouraging role-players in the beef market to take breeding decisions: a methodological study. Italian Journal of Animal Science 2013;12:53-59.
- Granovetter M. The strength of weak ties. American Journal of Sociology 1973;78(6):1360-1380.
- Hofmann M, Klinkenberg R. RapidMiner: data mining use cases and business analytics applications. Minnesota: CRC Press; 2014.
- IBGE - Instituto Brasileiro de Geografia e Estatística. Estatística da produção pecuária. Rio de Janeiro; 2016 [cited 2017 Mar 20]. Available from: ftp://ftp.ibge.gov.br/Producao_Pecuaria/Fasciculo_Indicadores_IBGE/2016/abate-leite-couro-ovos_201601caderno.pdf.
- Janhonen M, Johanson JE. Role of knowledge conversion and social networks in team performance. International Journal of Information Management. 2011;31(3):217-225.
- Lazzarini SG. Empresas em rede. São Paulo: Cengage Learning; 2008.
- Martins SS. Avicultura de corte: situação e perspectivas em maio de 2005. Informações Econômicas 2005;35(7):57-59.
- Nããs IA, Mollo Neto M, Canuto SA, Waker RA, Oliveira DRMS, Vendrametto O. Brazilian chicken meat production chain:a 10-year overview. Brazilian Journal of Poultry Science 2015;17(1):87-94.
- Oliveira DRMS, Nããs IA, Mollo Neto M, Canuto SA, Waker RA, Vendrametto O. Issues of sustainability on the Brazilian broiler meat production chain. Proceedings of the International Conference on Advances in Production Management Systems; 2012; Rhodes. Philadelphia: IFIP; 2012.
- Repórter Brasil - Organization for Communication and social projects. Monitor #2 Brazil's Poultry Industry. São Paulo: Brazil Poultry Industry; 2016 [cited 2017 Mar 20]. Available from: http://reporterbrasil.org.br/wp-content/uploads/2016/07/Monitor2_ENG.pdf
- Sindirações. Indústria de ração estima crescimento de 4% na produção de ração em 2010. Boletim Informativo do Setor de Alimentação Animal; 2010 [cited 2017 Mar 20]. Available from: http://sindiracoes.org.br/wp-content/uploads/2012/03/boletim-dez-2010-port.pdf
» http://sindiracoes.org.br/wp-content/uploads/2012/03/boletim-dez-2010-port.pdf - Sindirações. Indústria de alimentação animal estima crescimento de quase 5% na produção em 2011. Boletim Informativo do Setor de Alimentação Animal; 2011 [cited 2017 Mar 20]. Available from: http://sindiracoes.org.br/wp-content/uploads/2011/12/boletim_sindiracoes_DEZ2011.pdf
» http://sindiracoes.org.br/wp-content/uploads/2011/12/boletim_sindiracoes_DEZ2011.pdf - Sindirações. Indústria de alimentação animal sente os efeitos do alto custo dos insumos. Boletim Informativo do Setor de Alimentação Animal;2012 [cited 2017 Mar 20]. Available from: http://sindiracoes.org.br/wp-content/uploads/2012/12/boletim-_dezembro_2012_ultima_atualizacao_portugues.pdf
» http://sindiracoes.org.br/wp-content/uploads/2012/12/boletim-_dezembro_2012_ultima_atualizacao_portugues.pdf - Sindirações. Alimentação animal não recupera perdas acumuladas no ano passado. Boletim Informativo do Setor de Alimentação Animal; 2013 [cited 2017 Mar 20]. Available from: http://sindiracoes.org.br/wp-content/uploads/2013/12/sindiracoes-boletim_dezembro_05122013_site.pdf
» http://sindiracoes.org.br/wp-content/uploads/2013/12/sindiracoes-boletim_dezembro_05122013_site.pdf - Sindirações. Indústria está cerda da incerteza. Boletim Informativo do Setor de Alimentação Animal; 2014 [cited 2017 Mar 20]. Available from: http://sindiracoes.org.br/wp-content/uploads/2014/12/boletim-informativo-do-setor_dezembro_2014_vs_portugues_final-site_baixa-10122014.pdf
» http://sindiracoes.org.br/wp-content/uploads/2014/12/boletim-informativo-do-setor_dezembro_2014_vs_portugues_final-site_baixa-10122014.pdf - Thornton PK. Livestock production: recent trends, future prospects. Philosophical Transactions of the Royal Society B: Biological Sciences 2010;365(1554):2853-2867.
- UBABEF - Associação Brasileira dos Produtores e Exportadores de Frango. Relatório anual 2003. 2004 [cited 2016 Feb 27]. Available from: http://abpa-br.com.br/files/publicacoes/7a2e75e6e722893b704b577ef66e8d37.pdf
» http://abpa-br.com.br/files/publicacoes/7a2e75e6e722893b704b577ef66e8d37.pdf - UBABEF - União Brasileira dos Produtores e Exportadores de Frango. Protocolo de boas práticas de produção de frangos. 2008 [cited 2016 Mar 20]. Available from: http://www.avisite.com.br/legislacao/anexos/protocolo_de_boas_praticas_de_producao_de_frangos.pdf
» http://www.avisite.com.br/legislacao/anexos/protocolo_de_boas_praticas_de_producao_de_frangos.pdf - UBABEF - The Brazilian Poultry Association. Relatório anual UBABEF 2010/2011. 2011 [cited 2016 Apr 15]. Available from: http://abpa-br.com.br/files/publicacoes/abb3e2660dca967053335727b0cf74fd.pdf
» http://abpa-br.com.br/files/publicacoes/abb3e2660dca967053335727b0cf74fd.pdf - UBABEF - União Brasileira de Avicultura. Annual Report UBABEF 2012. 2012 [cited 2016 Apr 15]. Available from: http://abpa-br.com.br/files/publicacoes/41c30a0f46702351b561675f70fae077.pdf
» http://abpa-br.com.br/files/publicacoes/41c30a0f46702351b561675f70fae077.pdf - UBABEF - União Brasileira de Avicultura. Annual Report UBABEF 2013. 2013 [cited 2016 Apr 15]. Available from: http://abpa-br.com.br/files/publicacoes/732e67e684103de4a2117dda9ddd280a.pdf
» http://abpa-br.com.br/files/publicacoes/732e67e684103de4a2117dda9ddd280a.pdf - UNDP - United Nations Development Programme. Human Development Report 2015. Work for Human Development. New York; 2015 [cited 2016 Apr 15]. Available from: http://hdr.undp.org/sites/default/files/2015_human_development_report.pdf
» http://hdr.undp.org/sites/default/files/2015_human_development_report.pdf - USDA - United States Department of Agriculture. Livestock and meat international trade data. Washington; 2016 [cited 2017 Mar 15]. Available from: https://www.ers.usda.gov/data-products/livestock-and-meat-international-trade-data/.
» https://www.ers.usda.gov/data-products/livestock-and-meat-international-trade-data - Voilà M, Triches D. A cadeia de carne de frango: uma análise dos mercados brasileiro e mundial de 2002 a 2010. Teoria e Evidência Econômica 2015;21(44):126-148.
- Zaccarelli SB, Telles R, Siqueira JPL, Boaventura JMG, Donaire D. Clusters e redes de negócios: Uma nova visão para a gestão dos negócios. São Paulo: Atlas; 2008.
Publication Dates
-
Publication in this collection
Jul-Sep 2018
History
-
Received
16 Apr 2018 -
Accepted
27 June 2018