ABSTRACT
The aim of this study was to investigate the effects of Myostatin (MSTN) and MyoGenin (MyoG) on goose skeletal muscle growth. In this study, MSTN and MyoG gene expression in breast and leg muscle of Zi and Rhine goose were detected by Real-time Polymerase Chain Reaction (PCR), and the correlations between genes expression levels and carcass traits were investigated. The results showed that the breast muscle weight and breast muscle percentage of Rhine goose were significantly higher than Zi goose (p<0.01). MSTN mRNA and MyoG mRNA expression in breast muscle of Zi goose were significantly higher than that of Rhine goose and the level of MSTN in leg muscle of Rhine was significantly higher than that of Zi goose (p<0.01). There was a significant difference between MSTN mRNA expression in breast muscle and in leg muscle of Zi goose (p<0.01). MSTN mRNA expression in leg muscle was significantly higher than that of breast muscle of Rhine goose (p<0.05). There was a significant difference between MyoG mRNA expression in breast muscle and in leg muscle of Zi goose and Rhine goose (p<0.01). There was a negative correlation between MSTN mRNA expression in breast muscle and body weight, breast muscle weight and breast muscle percentage.
Keywords:
Carcass traits; goose; genes; mRNA expression
INTRODUCTION
China is the world’s largest producer of geese and produces about 500 to 650 million geese meat every year. China accounts for approximately 90% of all goose slaughter in the world, and it is increasing by 7% annually. As meat is the main part of goose for human consumption, the development of goose breast muscle and leg muscle has significant effect on the meat yield and muscle quality. It is very important to research the genetic background and molecular regulation mechanism of the development of goose skeletal muscle, and to speed up the process of goose breeding.
Myostatin (MSTN) and MyoGenin (MyoG) are two of the most important regulatory factors related to myoblast differentiation. MSTN also known as GDF8, is a transforming growth factor (TGF)-b superfamily member. MSTN is mainly expressed in skeletal muscle, and acts as a negative regulator of skeletal muscle growth (Joulia et al. 2003Joulia D, Bernardi H, Garandel V, Rabenoelina F, Vernus B, Cabello G. Mechanisms involved in the inhibition of myoblast proliferation and differentiation by myostatin. Experimental Cell Research 2003;286(2):263-275.). MSTN is expressed in the early development of skeletal muscle and continues to be expressed in adult skeletal muscle (McPherron et al., 1997McPherron AC, Lawler AM, Lee SJ. Regulation of skeletal muscle mass in mice by a new TGF-b superfamily member. Nature 1997;387:83-90.; McCroskery et al., 2003McCroskery S, Thomas M, Maxwell L, Sharma M, Kambadur R. Myostatin negatively regulates satellite cell activation and self-renewal. The Journal of Cell Biology 2003;162(6):1135-1147.). Mice null for the MSTN gene shows a remarkable increase in skeletal muscle mass with some muscles increasing by 2-3 times in size compared with wild-type controls (McPherron et al., 1997).
The cell fate of skeletal muscle precursors is determined by the expression of MyoGenic regulatory factors (MRFs), which include Myf5, MyoD, MyoGenin (MyoG) and MRF4. MyoG is a unique gene that can be expressed in all skeletal cell lines in MRFs. MyoG gene expresses after Myf5 and MyoD and mainly engages in muscle differentiation process. Mice that lack MyoG continue to specify the muscle lineage through the formation of myoblasts. However, these mice show perinatal lethality, because of severe disruption of myoblast differentiation and muscle fiber formation, leading to the idea that MyoG is a differentiation factor in the MyoGenic process (Hasty et al., 1993Hasty P, Bradley A, Morris JH, Edmondson DG, Venuti JM, Olson EN, et al. Muscle deficiency and neonatal death in mice with a targeted mutation in MyoGenin gene. Nature 1993;364:501-506.; Moncaut et al., 2013Moncaut N, Rigby PW, Carvajal JJ. Dial M (RF) for myogenesis. FEBS Journal 2013;280(17):3980-3990.; Nabeshima et al., 1993Nabeshima Y, Hanaoka K, Hayasaka M, Esumi E, Li S, Nonaka I, et al. Myogenin gene disruption results in perinatal lethality because of severe muscle defect. Nature 1993;364(6437):532-535.). Studies of MSTN and MyoG have been mainly focused on gene structure and single nucleotide polymorphism (Zhang et al., 2011) and the correlation between gene expression and carcass traits is rarely reported (Tang et al., 2014Tang Q, Song C, Zhang S, Hu Y, Zhao D, Zou J. Gene expression profile of IGF1 and MSTN mRNA and their correlation with carcass traits in different breeds of geese at 70 d of age. British Poultry Science 2014;55(1):76-80.).
In the present study, we take Zi goose and Rhine goose as research object which have significant differences in muscle development and deposition, real time-polymerase chain reaction (PCR) was used to ananlyze MSTN and MyoG mRNA, and the correlation of gene expression with carcass traits in goose was also analyzed. The result will provide the foundation for research on the molecular mechanism of goose skeletal muscle growth and development.
MATERIALS AND METHODS
Experimental materials
The eggs of Zi and Rhine geese of the same incubation batch were selected in the Experiment Farm of Animal Husbandry Research Institute, Heilongjiang Academy of Agricultural Sciences. The breast muscles and leg muscles were collected from 12-week-old geese that were raised under the same conditions. Samples were stored in liquid nitrogen immediately after collection and then transferred into a -70°C freezer in our laboratory. A total of 20 geese of each breed were sampled and carcass traits were measured after slaughter.
Extraction of total RNA and design of primers
The total RNA of muscle tissues was extracted following the instruction of TRNzol-A+ (TIANGEN)® total RNA extraction reagent, the purity and concentration of RNA were tested by 1.4 % agarose gel electrophoresis and UV spectrophotometer, followed by storage at -70°C until use.
The target gene and reference gene were designed based on the published sequences of goose and chicken MSTN and MyoG genes. Using the software of Primer Express 2.0, MSTN and MyoG primers were designed based on the sequence of AY448009.1 and NM_204184.1 accession numbers in GenBank respectively, and synthesized by Shanghai Invitrogen Biotechnology Co., Ltd. The primers were designed to cross exons to avoid genomic DNA contamination. b-actin was used as an internal control, and the length of the amplified fragment being 139 bp (Table 1).
RT-PCR reaction
The 10 µl of cDNA synthesis reaction mixture contained the following: 2 µl of 5× PrimerScript Buffer, 0.5 µl of PrimerScript RT Enzyme Mix I, 0.5 µl of Oligo dT (50µM), 0.5 µl of random 6 mers (100µM), 500 ng of total RNA, and RNase free deionized water. The reaction was carried out at 37 °C for 15 min and then at 85 °C for 5 s. The 25 µl of the PCR reaction mixture for the targeted DNA fragment amplification contained the following: 1.0 µl of cDNA template, 2.5 µl of 10× PCR buffer, 1.5 µl of Mg2+ (25 mmol/l), 0.5 µl of each primer (10 μmol/l), 0.5 µl of dNTP (10 mmol/ l), 0.2 µl of Taq polymerase (5 U/µl), and 18.3 µl of deionized water. The PCR amplification program was as follows: initial denaturation at 95 °C for 15 min, denaturation at 95 °C for 20 s, annealing at 60 °C for 20 s, and extension at 72 °C for 20 s for a total of 33 cycles before the final extension at 72 °C for 7 min and storage at 4 °C.
Standard curve generation
A certain amount of cDNA template was sequentially diluted 10-fold. Then real-time PCR was run in order using these diluted products in gradient as a template. The values of the concentration gradient were input into the fluorescence quantitative PCR cycler. Monitoring the real-time reaction data, the system software generated the standard calibration curves for MSTN, MyoG and b-actin mRNA.
Reaction system and conditions for Fluorescence Quantitative PCR
The 20-µl reaction mixture contained the following: 1 µl of cDNA, 0.4 µl each of the upstream and downstream primers (10 μmol/l), 0.4 µl of ROX Reference Dye II (50×), 10 µl of SYBR Green Real-time PCR Master Mix (2×), and 7.8 µl of deionized water. PCR reaction conditions were as follows: 95 °C for 30 s, 95 °C for 5 s, 60 °C for 34 s, and storage at 4 °C. The dissociation curve was analyzed after amplification. A peak of Melting time at (85 ± 0.8) °C on the dissociation curve was used to determine the specificity of PCR amplification. The Tm value for each sample was the average of the real-time PCR data for triplicate samples.
Data processing and analysis
The 2-DDCt method was suitable for processing the relative quantification results. The following formula was used: DDCT = (average Ct value of the target gene in the tested group-average Ct value of the housekeeping gene in the tested group) - (average Ct value of the control gene in the control group-average Ct value of the housekeeping gene in the control group). Ct (initial cycles) is the abscissa value of the intersection between the amplification curve and the threshold line, and it refers to the number of cycles at which the fluorescence signal strength reaches the required threshold during PCR amplification.
The univariate, ANOVA and bivariate correlation were conducted to analyze the influence of goose breed and tissue on gene expression. The correlation of MSTN and MyoG mRNA expression with goose carcass traits was also analyzed. All statistical analyses were performed using SPSS 17.0 software.
RESULTS
Carcass traits of Zi and Rhine geese
The details of carcass traits of Zi and Rhine geese are shown in the table 2. There were no significant differences in body weight, leg muscle weight and leg muscle ratio between Zi and Rhine geese (p>0.05). Significant differences were found in breast muscle weight and breast muscle ratio between the two breeds (p<0.01).
Results of total RNA extraction
Total RNA samples extracted from breast muscle and leg muscle were assayed by 1.4% agarose gel electrophoresis (figure 1). Three bands, representing 28S, 18S, and 5S, were observed with no bands from DNA contamination or significant degradation. This indicates the high purity of the extracted total RNA.
Results of Fluorescence Quantitative PCR
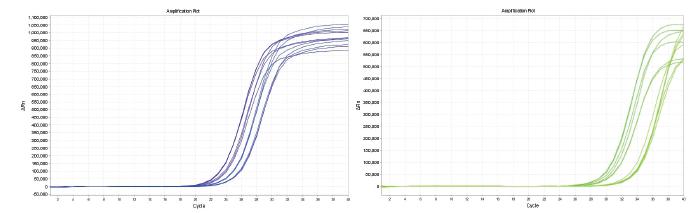
After the PCR reaction, the amplification reaction kinetics curve of the reaction cycle number versus the detected fluorescence change was automatically generated based on the change of fluorescence values. The PCR amplification curve and the dissociation curve for the MSTN gene and MyoG gene are shown in figures 2 and 3. As shown in the two figures, a single specific peak was observed with the RT-PCR products for the MSTN gene and MyoG gene with no primer dimers or nonspecific reaction products.
The amplification efficiency curves for the MSTN, MyoG and β-actin genes are shown in figure 4. The detection threshold was set at the starting point of the exponential growth phase in the PCR amplification process. A quantitative standard curve was generated with the logarithm of the starting product quantity and the threshold cycle number. For the MSTN gene, the standard curve was Y=-3.30 X+ 38.81, with a slope of -3.30, an intercept of 38.81, and a correlation coefficient of 0.996. For the MyoG gene, the standard curve was Y=-3.27 X+ 40.10, with a slope of -3.27, an intercept of 40.10, and a correlation coefficient of 0.988. For β-actin, the standard curve was Y=-3.31X+34.52, with a slope of -3.31, an intercept of 34.52, and a correlation coefficient of 0.994. The correlation coefficients were very close to 1. The difference in the slopes between the target genes and the reference gene were 0.01 and 0.04 (<0.1), indicating that the amplification efficiencies of the target genes and the reference gene were the same. The 2-DDCt method was applied for quantitative calculation.
Expression levels of MSTN and MyoG in tissues
In breast muscle, the MSTN mRNA level in Zi geese was higher than that in Rhine geese (p<0.01). The MyoG mRNA level in breast muscle was significantly different between the two breeds (p<0.01). In leg muscle, the MSTN mRNA level in Zi geese was lower than that in Rhine geese. MyoG mRNA in leg muscle did not differ significantly between the two breeds (Table 3). There was a significant difference between MSTN mRNA in breast muscle and leg muscle of Zi geese (p<0.01). MSTN mRNA level in leg muscle was higher than that in breast muscle (p<0.05). MyoG mRNA level differed significantly between the breast muscle and leg muscle of two breeds (p<0.01).
The correlation of MSTN and MyoG expression in muscle with carcass traits
The expression of MSTN mRNA was negatively correlated with MyoG mRNA expression in the breast muscle (r=-0.867). The expression of MSTN mRNA was negatively correlated with MyoG mRNA expression in the leg muscle (r=-0.527). The expression of MSTN mRNA in the breast muscle was negatively correlated with MSTN mRNA expression in the leg muscle (r=-0.808). The expression of MyoG mRNA in the breast muscle was positively correlated with MyoG mRNA expression in the leg muscle (r=0.572).
The correlations of expression of MSTN mRNA and MyoG mRNA in the muscle with carcass traits were also analyzed. The expression of MSTN mRNA in the breast muscle was negatively correlated with body weight, breast muscle weight and breast muscle ratio (r=-0.874, r=-0.683, r=-0.654). The expression of MyoG mRNA in the breast muscle was positively correlated with body weight (r=0.893). The expression of MyoG mRNA in the leg muscle was positively correlated with the body weight (r=0.680).
DISSCUSSION
Growth is a process where the body accumulates material through assimilation, the number of cells increases and the volume of tissue and organ enlarges. In this process, the individual’s body size and weight increase. The growth of the animal has a certain regularity, there was a difference because of the variety of animals, the production use, the growth stage, the environment and so on. In this study, significant differences were found in breast muscle weight and breast muscle ratio between the two breeds. There were no significant differences in body weight, leg muscle weight and leg muscle ratio between Zi and Rhine geese.
MSTN is a negative regulator of skeletal muscle development and a member of the TGF-b super family. MSTN mRNA was detected at all prenatal and postnatal stages of animals (Kambadur et al., 1997Kambadur R, Sharma M, Smith TPL, Bass JJ. Mutations in myostatin (GDF-8) in double-muscled Belgian Blue and Piedmontese cattle. Genome Research 1997;7(9):910-915.; Ji et al., 1998Ji S, Losinski RL, Cornelius SG, Frank GR, Willis GM, Gerrard DE, Depreux FFS, Spurlock ME. Myostatin expression in porcine tissues: tissue specificity and developmental and postnatal regulation. American Journal of Physiology 1998;275: 1265-1273.). There was different of MSTN mRNA expression between breeds and tissues. Lv (2015Lv XY, Sun W, Su R, Li D, Wang QZ. Correlation between sheep YAP1 temporal and spatial expression trends and MSTN and MyoG gene expression. Genetics and Molecular Research 2015;14(2):3244-3256.) reported that the expression of MSTN was significantly different in the different skeletal muscles and minimally expressed in the soleus muscle of sheep. Kuang (2014Kuang L, Xie X, Zhang XY, Zheng YC. Expression profiles of myostatin, myogenin, and Myosin heavy chain in skeletal muscles of two rabbit breeds different in growth rate. Animal Biotechnology 2014;25(4):223-233.) reported that at the age of 84d ZIKA rabbits contained significantly lower MSTNmRNA level in both longissimus dorsi and biceps femoris muscles than Californian rabbits, and mRNA levels of MSTNexhibited opposite changes from the age of 35d to 84d.Tang (2014Tang Q, Song C, Zhang S, Hu Y, Zhao D, Zou J. Gene expression profile of IGF1 and MSTN mRNA and their correlation with carcass traits in different breeds of geese at 70 d of age. British Poultry Science 2014;55(1):76-80.) reported that MSTN mRNA level in the leg muscle in Taihu geese was significantly higher than that in Wanxi geese. In this study, the MSTN mRNA level in breast muscle in Zi geese was higher than that in Rhine geese (p<0.01). In leg muscle, the MSTN mRNA level in Zi geese was lower than that in Rhine geese. There was a significant difference between MSTN mRNA in breast muscle and leg muscle of Zi geese (p<0.01). MSTN mRNA level in the leg muscle was higher than that in the breast muscle of Rhine geese (p<0.05).
The present study results were not consistent with the previous research (Tang et al., 2013). The reasons were that different breeds and different growth stages were chosen in this study. MSTN can negatively control the growth of muscle cells by inhibiting the transcriptional activity of MyoD family members. Its expression is negatively correlated with muscle weight (Weber et al., 2005Weber TE, Small BC, Bosworth BG. Lipopolysaccharide regulates myostatin and MyoD independently of an increase in plasma cortisol in channel catfish (Ictalurus punctatus). Domest Animal Endocrinology 2005;28(1):64-73.). In this study, The expression of MSTN mRNA in the breast muscle was negatively correlated with the body weight, breast muscle weight and breast muscle ratio (r=-0.874, r=-0.683, r=-0.654). The negative correlations of MSTN mRNA with the body weight and breast muscle weight suggest that MSTN might be a negative factor of breast muscle growth.
MyoG was a member of myogenic regulatory factors (MRFs) family and an important factor in regulating skeletal muscle development. It is evident that MyoG function cannot be compensated by any other MRFs. Following MyoG knockout, myogenesis begins but myoblasts do not differentiate into muscle fibers (Li, 2007). Real-time Quantitative PCR was used to detect the expression of MyoG mRNA in different growing and developmental stages of goose muscle. The results showed that the expression of MyoG mRNA of breast muscle and leg muscle was significantly different (Song et al., 2013Song JW, Gao G, Wu W, Mu YT, Li Y, Sun Y, et al. Study on expression of MyoG mRNA and histological characteristics of goose muscle fiber. Journal of Jilin Agricultural University 2013;35(1):89-93.). Zhang (2014Zhang GX, Tang Y, Zhang T, Wang JY, Wang YJ. Expression profiles and association analysis with growth traits of the MyoG and Myf5 genes in the Jinghai yellow chicken. Molecular Biology Reports 2014;41(11):7331-7338.) reported that the expression level of the MyoG gene in the breast muscle was higher than that in the leg muscle of Jinghai yellow chicken. In this study, The MyoG mRNA level in the breast muscle was significantly different between the two breeds (p<0.01). MyoG mRNA level differed significantly between the breast muscle and the leg muscle of two breeds (p<0.01).
The expression of MyoG mRNA in the breast muscle was positively correlated with body weight (r=0.893). The expression of MyoG mRNA in the leg muscle was positively correlated with body weight (r=0.680). The results showed that MyoG maybe is a positive mediator of muscle growth. The relatively high expression level of the MyoG in the muscle of geese may indicate that there are important roles in the formation and differentiation of muscles.
Smad3 induced phosphorylation after MSTN bound with its receptor and enhanced the interactions between Smad3 and MyoD. MSTN can inhibit the activation and expression of MyoD factors by Smad3, and the resulting myoblasts do not differentiate into myotubes (Rebbapragada et al., 2003Rebbapragada A, Benchabane H, Wrana J L. Myostatin signals through a transforming growth factor beta-like signaling pathway to block adipogenesis. Molecular Cell Biology 2003;23(20):7230-7242.). Sun (2010Sun W, Wang P, Ding JT, Ma YH, Guan WJ, Chu MX, et al. Development changes of gene expression of myostain and myogenin genes and their association analysis with carcass traits in Hu sheep. Scientia Agricultura Sinica 2010;43:5129-5136.) reported that MSTN and MyoG synergistically promoted the development of muscle in the early developmental stages after birth.
In this study, the expression of MSTN mRNA was negatively correlated with MyoG mRNA expression in the breast and leg muscles. The expression of MSTN mRNA in the breast muscle was negatively correlated with MSTN mRNA expression in the leg muscle. The expression of MyoG mRNA in the breast muscle was positively correlated with MyoG mRNA expression in the leg muscle. These positive and negative muscle growth factors are in a balance to regulate muscle development.
CONCLUSION
In this study, the expression of MSTN and MyoG mRNA in skeletal muscle were studied and the correlation with carcass traits were analyzed. The results not only will provide a basis for the molecular mechanisms of muscle growth and development, but also had an important theoretical and practical significance in the molecular breeding of goose.
ACKNOWLEDGEMENTS
This work was founded by the Heilongjiang postdoctoral Fund (LBH-Z13184) and National Waterfowl Industrial and Technology System (CARS-42-24). The authors gratefully thank other co-workers for their help.
REFERENCES
- Hasty P, Bradley A, Morris JH, Edmondson DG, Venuti JM, Olson EN, et al. Muscle deficiency and neonatal death in mice with a targeted mutation in MyoGenin gene. Nature 1993;364:501-506.
- Joulia D, Bernardi H, Garandel V, Rabenoelina F, Vernus B, Cabello G. Mechanisms involved in the inhibition of myoblast proliferation and differentiation by myostatin. Experimental Cell Research 2003;286(2):263-275.
- Ji S, Losinski RL, Cornelius SG, Frank GR, Willis GM, Gerrard DE, Depreux FFS, Spurlock ME. Myostatin expression in porcine tissues: tissue specificity and developmental and postnatal regulation. American Journal of Physiology 1998;275: 1265-1273.
- Kambadur R, Sharma M, Smith TPL, Bass JJ. Mutations in myostatin (GDF-8) in double-muscled Belgian Blue and Piedmontese cattle. Genome Research 1997;7(9):910-915.
- Kuang L, Xie X, Zhang XY, Zheng YC. Expression profiles of myostatin, myogenin, and Myosin heavy chain in skeletal muscles of two rabbit breeds different in growth rate. Animal Biotechnology 2014;25(4):223-233.
- Li C. RNAi in porcine MyoD and myostatin gene and the relationship between the gene functions [master,s thesis]. Heilongjiang (Chi): Northeast Agricultural University.
- Lv XY, Sun W, Su R, Li D, Wang QZ. Correlation between sheep YAP1 temporal and spatial expression trends and MSTN and MyoG gene expression. Genetics and Molecular Research 2015;14(2):3244-3256.
- McPherron AC, Lawler AM, Lee SJ. Regulation of skeletal muscle mass in mice by a new TGF-b superfamily member. Nature 1997;387:83-90.
- McCroskery S, Thomas M, Maxwell L, Sharma M, Kambadur R. Myostatin negatively regulates satellite cell activation and self-renewal. The Journal of Cell Biology 2003;162(6):1135-1147.
- Moncaut N, Rigby PW, Carvajal JJ. Dial M (RF) for myogenesis. FEBS Journal 2013;280(17):3980-3990.
- Nabeshima Y, Hanaoka K, Hayasaka M, Esumi E, Li S, Nonaka I, et al. Myogenin gene disruption results in perinatal lethality because of severe muscle defect. Nature 1993;364(6437):532-535.
- Rebbapragada A, Benchabane H, Wrana J L. Myostatin signals through a transforming growth factor beta-like signaling pathway to block adipogenesis. Molecular Cell Biology 2003;23(20):7230-7242.
- Song JW, Gao G, Wu W, Mu YT, Li Y, Sun Y, et al. Study on expression of MyoG mRNA and histological characteristics of goose muscle fiber. Journal of Jilin Agricultural University 2013;35(1):89-93.
- Sun W, Wang P, Ding JT, Ma YH, Guan WJ, Chu MX, et al. Development changes of gene expression of myostain and myogenin genes and their association analysis with carcass traits in Hu sheep. Scientia Agricultura Sinica 2010;43:5129-5136.
- Tang Q, Song C, Zhang S, Hu Y, Zhao D, Zou J. Gene expression profile of IGF1 and MSTN mRNA and their correlation with carcass traits in different breeds of geese at 70 d of age. British Poultry Science 2014;55(1):76-80.
- Weber TE, Small BC, Bosworth BG. Lipopolysaccharide regulates myostatin and MyoD independently of an increase in plasma cortisol in channel catfish (Ictalurus punctatus). Domest Animal Endocrinology 2005;28(1):64-73.
- Zhang GX, Zhao XH, Wang JY, Ding FX, Zhang L. Effect of an exon 1 mutation in the myostatin gene on the growth traits of the Bian chicken. Animal Genetics 2012;43(4):458-459.
- Zhang GX, Tang Y, Zhang T, Wang JY, Wang YJ. Expression profiles and association analysis with growth traits of the MyoG and Myf5 genes in the Jinghai yellow chicken. Molecular Biology Reports 2014;41(11):7331-7338.
Publication Dates
-
Publication in this collection
2019
History
-
Received
09 July 2018 -
Accepted
31 Oct 2018