
Abstract
Recent technological advances and increased participation of energy systems based on photovoltaic solar energy place this renewable energy source in a prominent position in the current scenario. With the increase in the share of solar photovoltaic systems, the impact of power fluctuations in these sources has worsened, which can affect the quality of electrical energy and the reliability of the electrical power system. Therefore, with the use of energy storage together with control algorithms based on artificial intelligence, it is possible to control and perform power smoothing. In this context, the study presents a technical feasibility study on the use of artificial neural network (ANN) to perform the power smoothing of the photovoltaic system connected to the network. Being studied the performance of a real photovoltaic system operating in conjunction with an ideal energy storage for comparative analysis of the performance of the artificial neural network when the numbers of neurons and layers are modified for different real operating conditions considered as temperature variation, humidity, irradiation, pressure and wind speed, which are considered to be ANN input data. The results obtained point to the feasibility of using ANN, with acceptable precision, for power smoothing. According to the analyzes carried out, it is clear that ANN's with few neurons, the smoothing profile tends to be more accurate when compared to larger amounts of neurons. In the current state of the study, it was not possible to determine a relationship between the variations in the number of neurons with the most accurate results, it is important to note that the development of the curve pointed by the neural network can be influenced by the database. It should be noted that, when ANN exceeds or does not reach the optimal smoothing curve, the storage system compensates for the lack or excess of power, and there is a need for other mechanisms to optimize power smoothing.
Keywords:
Photovoltaic system connected to the grid; Power smoothing and artificial neural network
HIGHLIGHTS
ANN with 10 neurons shows better performance when compared to 20 and 100.
ANN with more than two hidden layers does not demonstrate better accuracy.
The self-loading of the ANN exceeds the limits, requiring external mechanisms.
The lack of continuity in the data influences the behavior of the ANN training.
INTRODUCTION
The diversification of the electrical matrix with the inclusion of non-conventional renewable sources is a worldwide trend. Many countries, mainly in the European community, have adopted policies that encourage the growth of the participation of renewable energy sources [11 Moslener U, McCrone A, Francoise D'Estais, Grüning C, Louw A, Boyle R, et al. Global Trends in Renewable Energy Investment OECD Publishing. Paris/IEA. 2017. 763p.,22 Hvidtfeldt Larsen H, Sønderberg Petersen L. DTU international energy report 2013: energy storage options for future sustainable energy systems. Roskilde: Technical University of Denmark; 2013.].These policies reflect a combination of concerns about energy security and climate change. Even in some countries, the national interest in green growth and job opportunities is also a short-term policy driver for the expansion of renewable energy sources [22 Hvidtfeldt Larsen H, Sønderberg Petersen L. DTU international energy report 2013: energy storage options for future sustainable energy systems. Roskilde: Technical University of Denmark; 2013.]. Comparatively, it can be noted that many of the unconventional forms of renewable energy generation have become competitive in the face of fossil fuel-based energy generations due to tax incentives along with technological maturity.
The trend of the electric sector in the global scenario regarding the expansion of renewable energy from unconventional energy can be seen in Table 1. Despite the differences between the different scenarios, there is a very uniform trend of a substantial increase in the participation of renewable energy sources in all scenarios and around 30% renewable energy by the year 2040. In Brazil, in the case of electricity, there was a 2.3% increase in domestic supply compared to 2018. The share of renewable energy in the electricity matrix reached 83.0% in 2019. Wind generation grew by 15,5%. Wind power reached an expansion of 6.9%. Hydro generation rose, but supply decreased due to the drop in imports [33 EPE. Balanço Energético Nacional (BEN) 2020: 2019. Rio de Janeiro: Ministério de Minas e Energia -MME; 2020 May p. 73.].
Projection of renewable energy participation in electricity production in global scenarios until 2040.
In Brazil, renewable energy sources have prospects for future growth in terms of installed capacity and installed energy generation, mainly solar photovoltaic and wind power. According to the Ten-Year Energy Expansion Plan [77 Albuquerque B. Plano Decenal de Expansão de Energia. Brasília: Empresa de Pesquisa Energética; 2021 p. 453.],it shows the growth in the share of centralized photovoltaic wind and solar sources, which together correspond to an increase of 4%, that is, about 6 GW in December installed capacity 2020 until the end of 2030. The participation of renewable energies in the electric matrix is expected to be 87% by the year 2030, with an increase of 5,475 MW of installed capacity of photovoltaic plants. According to the Energy Research Company [33 EPE. Balanço Energético Nacional (BEN) 2020: 2019. Rio de Janeiro: Ministério de Minas e Energia -MME; 2020 May p. 73.], the share of solar energy in distributed generation was 74.5%, with 1,992 MW of installed power, thus totaling an expansion of 1,430 MW in one year.
With the growth in the participation of renewable energy and generation distributed in the generating matrix, there is a concern with the intermittency of power generated by the aforementioned sources, which, in turn, introduce significant uncertainties in the operation and planning of the electrical power system [88 Du P, Lu N. Energy storage for smart grids: planning and operation for renewable and variable energy resources (VERs). First edition. Amsterdam; Boston: Academic Press, an imprint of Elsevier; 2015. 331 p.,99 Shivashankar S, Mekhilef S, Mokhlis H, Karimi M. Mitigating methods of power fluctuation of photovoltaic (PV) sources - A review. Renewable and Sustainable Energy Reviews. 2016 Jun; 59:1170-84.]. In particular, photovoltaic generation can have a high variation in the instantaneous power generated, due to variations in irradiation as a result of changes in cloudiness [1010 Marcos J, Storkël O, Marroyo L, Garcia M, Lorenzo E. Storage requirements for PV power ramp-rate control. Solar Energy. 2014 Jan; 99:28-35.,1111 Marcos J, de la Parra I, García M, Marroyo L. Control Strategies to Smooth Short-Term Power Fluctuations in Large Photovoltaic Plants Using Battery Storage Systems. Energies. 2014 Oct;7(10):6593-619.], thus compromising the stability and reliability of the electrical system to which it is connected.
To try to solve the problem of fluctuations, different techniques have been proposed, with the help of Proknow-C, it was possible to find existing works using energy storage systems [1212 Sasmal RP, Sen S, Chakraborty A. Solar Photovoltaic Output Smoothing: Using Battery Energy Storage System. In: 2016 National Power Systems Conference (NPSC). Bhubaneswar, India; 2016. p. 1-5.], fuzzy control algorithms [1313 Zheng Y, Sun G, Wei Z, Ma J, Sun Y. An active power smoothing control for photovoltaic-flywheel system using fuzzy control. In: 2012 IEEE Fifth International Conference on Advanced Computational Intelligence (ICACI). Nanjing, China: IEEE; 2012. p. 1113-8.], hybrid energy storage systems [1414 Ma W, Hu R, Han X, Ding L. Optimal Allocation of Hybrid Energy Storage Systems for Smoothing Photovoltaic Power Fluctuations Considering the Active Power Curtailment of Photovoltaic. IEEE Access. 2019; 7:74787-99.], as well as smoothing for wind systems [1515 Wang JC, Wang XR. A Control Strategy for Smoothing Active Power Fluctuation of Wind Farm with Flywheel Energy Storage System Based on Improved Wind Power Prediction Algorithm. Energy and Power Eng. 2013; 5:387-92.,1616 Ding M, Chen Z, Wang B, Chen Z, Luo Y, Zheng G. Unified Control of Smoothing Out Wind Power Fluctuations and Active Power Filtering by an Energy Storage System. IEEE PES ISGT ASIA. 2012;5.], but so far no works were found using ANN for the power smoothing problem. They have greater applications for the control and grid integration of solar photovoltaic systems [1717 Sun Y, Li S, Lin B, Fu X, Ramezani M, Jaithwa I. Artificial Neural Network for Control and Grid Integration of Residential Solar Photovoltaic Systems. IEEE Transactions on Sustainable Energy. 2017 Oct;8(4):1484-95.], among other, but not in power smoothing.
Therefore, this research aims to analyze the technical feasibility of using ANN to perform active power smoothing of a grid-connected PV system operating in conjunction with a storage system. Intermittent operation of renewable energy sources causing voltage or frequency deviations, as well as generating stability problems, necessitate an energy storage system, capable of storing large amounts of energy with high power and high electrical power, to take care of energy variations and thus ensure better electrical energy quality, reliability and contribute to the mitigation of power variations. When integrated into an electrical system they function as a charge, if they need to store electricity, or as a generator during periods that require the discharge of electricity to the grid. The choice of using ANN is due to the fact that the technique is adaptive and easy to customize for different technologies, which allows its wide use for power smoothing. ANNs, which are computational models inspired by the nervous system of living beings, have the ability to acquire and maintain knowledge (based on information), and are often defined as a set of processing units [1818 Silva IN, Spatti DH, Flauzino RA. Redes Neurais Artificiais: Para Engenharia e Ciências Aplicadas. São Paulo: Artliber. 2010. 399p.]. In contrast, the main disadvantage refers to the following needs (i) a large volume and reliability of data for training the ANN; and (ii) details and knowledge of the configurations, architectures and types of networks in the training to obtain satisfactory results, if you do not have a large database, the margin of error in the output of the network affects the results, as if you do not have a good configuration, you will not reach the expected output. For the study a real database of a distributed generation in the city of Foz do Iguaçú-Paraná was used to perform the training of the proposed ANN. For validation, a series of multilayer Perceptron ANNs were developed and trained based on some study scenarios and comparative analysis for power smoothing generated by the modeled ANNs.
MATERIAL AND METHODS
One of the potential areas of applicability of the artificial neural network (ANN) is to map the functional relationship between variables in a system from a known set of representative values [1818 Silva IN, Spatti DH, Flauzino RA. Redes Neurais Artificiais: Para Engenharia e Ciências Aplicadas. São Paulo: Artliber. 2010. 399p.], which will allow finding the power profile curve. active.
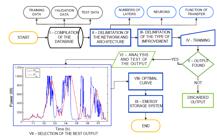
This section presents the step by step of the proposed power smoothing curve model (Figure 1). With the help of MATLAB software through the command nnstart and nftool available in the Neural Network Start and Neural Fitting library, the curves and the output data are determined. In the sequence, the brief descriptions of each step of the flowchart are presented.
-
I-Compilation of the Database: The data are measured from a photovoltaic release system installed in a residence of the authors (Foz do Iguaçú, Paraná) with 10 photovoltaic panels with a nominal capacity of 3.2KWp, during the period 22/01/2019 until 31/12/2019, the sample rate was 1 in 1 hour [1919 Wentz VH, Maciel JN, Ledesma JJG, Ando Junior OH. Construção de um Banco de Dados Para Predição do Potencial De Geração de Energia Solar Fotovoltaica. In: Anais do IX Encontro Anual de Iniciação Científica e V Encontro anual de Iniciação em Desenvolvimento Tecnológico e Inovação - EICTI. Foz do Iguaçu; 2020. p. 109.]. After verification and consolidation of the data, only some of them were validated (75% training, 15% validation and 15% test). The main reason for the rejection was due to failure to maintain the record during a prolonged period of observation, as well as the abrupt variations from the shading. The data, are treated with codes made in Excel, in which zero values (zeros) were eliminated and considered all the other recorded data.
-
II-Delimitation of the Network and Architecture: The network used was of the multilayer perceptron type (MLP), as it is the most suitable for the universal approximation of functions, Figure 2, in addition to being characterized by the high possibilities of applications in various types of problems related to different areas of knowledge, being also considered one of the most versatile architectures in terms of applicability. For learning, supervised where for each sample of the input data its respective desired output is obtained, a multilayer Feedforward architecture was used, each training sample is composed of the input signals and its corresponding output [1818 Silva IN, Spatti DH, Flauzino RA. Redes Neurais Artificiais: Para Engenharia e Ciências Aplicadas. São Paulo: Artliber. 2010. 399p.]. In addition to the number of layers, the number of neurons and the activation function to be used are defined.
-
III-Delimitation of the Type of Improvement: The type of improvement adopted at this point was Levenberg - Marquardt [2020 Benatti KA. O Método de Levenberg - Marquardt para o Problema de Quadrados Mínimos não Linear [Disertação de Mestrado]. [Curitiba]: Universidade Federal de Paraná; 2017.
21 Gavin HP. The Levenburg - Marqurdt Algorithm For Nonlinear Least Squares Curve-Fitting Problems. Department of Civil and Environmental Engineering Duke University. Duke University. 2019; 1-20.-2222 Sapna S. Backpropagation Learning Algorithm Based on Levenberg Marquardt Algorithm. In: Computer Science & Information Technology (CS & IT). Academy & Industry Research Collaboration Center (AIRCC); 2012. p.393-8.], which helps in the speed of convergence, since the neural network tends to adjust the values of the weight matrices of the MLP network in relation to the opposite direction of the quadratic error of the gradient function, which makes the convergence slower and, therefore, requires greater computational effort. -
IV-Training: The objective of the training process for the output neural layer is to adjust the weight matrix in order to minimize the error between the output produced by the network in relation to the respective desired output. The load curves were trained, taking into account some parameters (temperature, wind speed, pressure, radiation and humidity) and the algorithms used. Backpropagation was the learning algorithm applied during the training process. The phase of direct propagation allows to obtain the responses of the network, taking into account the current values of the weights and synaptic thresholds of your neurons, which will remain unchanged with each execution of this phase [1818 Silva IN, Spatti DH, Flauzino RA. Redes Neurais Artificiais: Para Engenharia e Ciências Aplicadas. São Paulo: Artliber. 2010. 399p.].
-
V- Output Found: After training, the ANN is calibrated to perform power smoothing. The power smoothing must be in agreement with the optimal curve, otherwise the curve is discarded, and the search for the representation of the PV system model is continued, which should be as close as possible to the ideal conditions.
-
VI-Analysis and Test of the Output: Once the already trained model has been determined, each interaction is validated in the training process and finally, at the end of the training, the data are tested which are used only to evaluate the accuracy of the model, this data is independent of the training data.
-
VII- Selection of the Best Output: After obtaining the best output curve, the found curves are compared and analyzed by means of statistical and graphical tools of the Matlab program.
-
VIII- Optimal Curve : The optimal curve was obtained considering the best possible operating conditions for photovoltaic panels. The data-sheet of the photovoltaic system was considered to graph the optimal curve
-
IX-Energy Storage System: The storage systems have as one of its great applications supply of energy, where they must store large amounts of energy and power certifying a more stable power and energy in the electrical system. It can be when energy is stored in periods when generation exceeds demand, or in periods of low demand such as during cloudy or rainy days.

Figure 2 states that on the left: input data, followed by the hidden layer (10, 20, 50 and 100 neurons) and finally the output layer. Optimal curve (red): Power (Watts) as a function of time (hours).
Power Fluctuations
The unpredictable behavior ofclouds from weather conditions can cause energy imbalance and frequency deviation in the energy outputs of photovoltaic systems, making photovoltaic systems unreliable [2323 Aryani DR, Kim J-S, Song H. Suppression of PV Output Fluctuation Using a Battery Energy Storage System with Model Predictive Control. International Journal of Fuzzy Logic and Intelligent Systems. 2017 Sept;17(3): 202-9.]. The power fluctuation is defined, at the moment (t) for a given sampling period (Δt), as the difference between two consecutive samples of the photovoltaic power generated , normalized by rated inverter power (P*) of the plant [1111 Marcos J, de la Parra I, García M, Marroyo L. Control Strategies to Smooth Short-Term Power Fluctuations in Large Photovoltaic Plants Using Battery Storage Systems. Energies. 2014 Oct;7(10):6593-619.]:
If the variation in power is not mitigated in distribution systems with a high level of penetration of photovoltaic generation, there may be a variation in frequency and voltage as well as in increasing voltage profiles in the distribution branch during periods of maximum generation [2424 Gabbar HA, Smart Energy Grid Engineering. London, United Kingdom; San Diego, CA: Academic Press; 2017. 568 p.]. Currently, Brazil is still in the process of standardization, and there is no regulation that establishes requirements regarding the variation of the injected power. Some countries already take this problem into account in their regulations, for example, The Puerto Rico Electric Power Authority (PREPA), which requires fluctuations in the photovoltaic system to be less than 10% of the nominal power of the inverter within one minute [2525 Gevorgian V, Booth S. Review of PREPA Technical Requirements for Interconnecting Wind and Solar Generation. 2013 Nov. NREL/TP--5D00-57089, 1260328. Report No.: NREL/TP--5D00-57089, 1260328.]. In addition, in Mexico, the regulatory federal agencies allow maximum fluctuations of around 2-5%/min of the nominal power of the plant [2626 Comisión Reguladora de Energía. Reglas Generales de Interconexión al Sistema Eléctrico Nacional: Anexo 3. 2012. 33 p.].
Modeling and Validation of the Artificial Neural Network
This section presents some values of the database used for neural network modelling and validation, taking into account that the values used for neural network analysis are the test values that are independent of the training data, which allow us to accurately assess the performance of the model. In addition, they present the formulas used to calculate the errors and factors that influence a photovoltaic system.
The neural network used is of the MLP type detailed in Figure 2, with the variation of the occult layer and supervised learning, in addition to being characterized by having great possibilities of applications in various problems. For example, in the approximation of functions to predict the mapping of processes whose modeling by conventional techniques is difficult to determine, note that the theorem of the universal approximation of functions, which is the case of the study, only states the need for a single hidden layer, however, the number of neurons is still unknown, and depends on the complexity of the problem to be addressed [1818 Silva IN, Spatti DH, Flauzino RA. Redes Neurais Artificiais: Para Engenharia e Ciências Aplicadas. São Paulo: Artliber. 2010. 399p.].
Some quantities of experimental data measured (wind, temperature, radiation, pressure and humidity) for training and testing are shown in Table 2. For better performance, data are normalized, the appropriate approximate values of each magnitude are necessary, which do not necessarily coincide with the actual or best known values such as: nominal values of photovoltaic panels [2727 Glover JD, Sarma MS. Sistemas de Potencia Análisis y Diseño. 3ra ed. D. F. México: International Thomson Editores S. A.; 2003. 650 p.].
The photovoltaic system used has a nominal capacity of 3.20 KWp, in a composition of 10 modules with dimensions of 2.00x0.90 meters each module. The temperature of 27.1 °C, the humidity of 76%, the pressure of 985.5 hPa, the wind speed of 2.7 m/s and an overall radiation of 988.5 W/m2 as nominal values for each parameter.
The vast majority of research has focused research work on two most important climatic factors, ambient temperature and radiation, but it has other climatic parameters that can influence the production of electricity generated. Based on the model shown by AMY [2828 Amy de la Breteque E. Etude Du Comportement Thermique De Modules Photovoltaïques En Vue De La Prediction De Leur Production Electrique Sur Site. [Tese De Doutorado]. [Marseille]: L'universite De Provence Institut des Systèmes Thermiques Industriels UMR 6595; 2006.], some of the factors can influence the efficiency of the photovoltaic system, as shown in Figure 3, the temperature of the module is influenced by several climatic factors.
In the case of radiation, the higher the level of radiation on the panels, the greater electrical current will be available at the output and consequently the greater the power disposition to be used. The greater the solar spectrum reached, the greater the number of hours of sunlight, and the smaller the mass of air, the greater the radiation energy available reaching the panels. In the case of temperature, the factor that varies most drastically is the output voltage, and the current presents a minimal variation. In the case of the influence of the wind, it is present in the forced convection that acts on the modules and is linked with the wind speed in the vicinity of the modules. In the case of relative air humidity, reference is made to the amount of water particles in the air that have a given environment, and is given as a percentage [2929 Rodriguez Cantor GA. Influência Dos Fatores Climáticos No Desempenho De Módulos Fotovoltaicos Em Regiões De Clima Tropical [Tese de Mestre]. [JOÃO PESSOA - PB]: Universidade Federal Da Paraíba; 2017.].
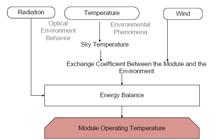
Factors can influence the efficiency of the photovoltaic system [2929 Rodriguez Cantor GA. Influência Dos Fatores Climáticos No Desempenho De Módulos Fotovoltaicos Em Regiões De Clima Tropical [Tese de Mestre]. [JOÃO PESSOA - PB]: Universidade Federal Da Paraíba; 2017.].
For errors, follow Vuolo [3030 Vuolo JH. Avaliação e Expressão de Incerteza em Medição. Revista Brasileira de Ensino de Física. 1999 Sept;21(3): 350-8.] where the error () is the difference between the result () of the measurement and the measured value (), which will be expressed as a percentage (%):
In addition, it should be specified that the time for each simulation depends on the number of neurons chosen and is approximately 10 minutes. In addition, explain that it was not possible to compare the methodology or results found in this manuscript, due to the absence of works that use ANN for power softening, so it is difficult to compare whether the configuration is correct or not, or if any other configuration behaves better than the one employed in this work.
RESULTS
After the data collection, already normalized, the ANN with the chosen architecture, begins with the training the following input data: (i) temperature, (ii) wind speed, (iii) pressure, (iv) radiation and (v) humidity, to find the expected output.
For training the number of layers was defined in two, requiring only a hidden layer, and an output layer, and the number of initial neurons for training was 20 neurons, since in the literature there is no specific number, if it chooses to start with 20 and then vary according to the performance of the results, while the activation function used the hyperbolic tangent function, for the hidden layer, which, like any function, calculates the output of a layer from its input. For the output layer, the linear function is used [1818 Silva IN, Spatti DH, Flauzino RA. Redes Neurais Artificiais: Para Engenharia e Ciências Aplicadas. São Paulo: Artliber. 2010. 399p.]. This type of configuration was achieved with the help of a laptop with a Windows 10 operating system, with Core I3-8130CPU processor, a 12GB RAM, 1 TB solid disk, 1 SSD NVMe M.2 480 GB and a 64-bit system, which is compatible to use the matlab application.
For a better understanding of the data, the ANN output will be expressed as power (watts) versus time (hours), and the optimal curve will be represented in red in all graphs, as well as the errors presented will be given in percentage (%) following the Vuolo literature [3030 Vuolo JH. Avaliação e Expressão de Incerteza em Medição. Revista Brasileira de Ensino de Física. 1999 Sept;21(3): 350-8.].
As a result, the model of the optimal power curve (red line) was compared with the response of the neural network (light blue), showing that it is possible to apply power smoothing as the ANN shows that it mostly does not overshoot the limits, and where it overshoots these limits, a storage system will be needed to inject or self-load energy. In addition, in the scenarios to be analyzed, it will be made clear that for the neural network with fewer neurons, the power smoothing profile is better when compared to larger amounts of neurons. The variation of the hidden layers was also tested and the result was not satisfactory.
Therefore, ANN with a hidden layer and with 10 neurons presents a better performance with an error [3030 Vuolo JH. Avaliação e Expressão de Incerteza em Medição. Revista Brasileira de Ensino de Física. 1999 Sept;21(3): 350-8.] of 0.28449, as shown in detail in Figure 4. The neural network has a good smoothing profile for the left side of the curve, even so, in the beginning it needs a small charge of excess energy by the EES. At the time of auto charging, it reaches 400 W, thus discharging the necessary energy from the EES. For the right side of the neural network, the smoothing was greater, therefore, more energy has to be injected than on the left side; this makes a difference in the vast majority of neural network outputs.
In comparison with a scenario three neural network with 100 neurons, the difference is considerable 0.992, since for 100 neurons you will need to inject more energy into the same analyzed network. It is important to note that it was considered an storage system and that for future steps it will be considered certain technology acting in conjunction with the output of the neural network.

The better appreciation of the results, they will be classified in scenarios, with different number of hidden layers (1, 2 and 3), as well as variations in the number of neurons (10, 20, 50 and 100).
For scenario 1 with 10 neurons (Table 3), the red curve represents the optimal curve of the photovoltaic system, the green bars represent the output of the neural network, and the blue bars represent an energy storage system. It is observed that, the behavior of the ANN is staggered both at the beginning and at the end, highlighting that it fulfills the function of smoothing the power. At the time of high consumption, as well as, high generation, the neural network exceeds the requested limits, requiring a SAE to absorb excess energy, similarly there will be times a SAE will be necessary to inject energy into the photovoltaic system since at the moment smoothing the neural network is below the optimal curve.
Considering the same scenario, with 20 neurons, the output curve of the ANN did not have a staggered profile and at the time of loading EES presents irregularities, being necessary for the EES to inject and reject power. When the number of neurons was increased to 50, expected the ANN to perform better, however, by increasing the number of neurons (50), the behavior of the ANN output is more shifted to the left side of the optimal curve. Even so, there were irregularities at the time of loading the EES, which will ask the EES to inject and reject power as there are peaks that do not reach the limit and others that go beyond the optimal curve.
Finally, there is the ANN with 100 neurons, the output of the neural network softens very much in the extreme respect, even getting to low values that need the SAE, and continues with peaks that extrapolates the optimum curve in red. Until now, the neural network with 10 neurons has had a better power smoothing at the ends of the optimal curve, even so all the curves present problems in the moment of low consumption where the EES can be loaded.
It is noteworthy that this increase in inaccuracy may be due to the configurations of the neural network, be it the number of neurons, learning, the number of layers, the type of architecture, among other configurations that can affect the ANN output, including the number of interactions or time the neural network has been trained, validated and tested.
Another approach taken was to modify the number of hidden layers to two and three respectively, Table 4, highlighting that (i) with the increase of hidden layers the error regarding the expected output tends to increase, (ii) as the number of neurons performance is getting worse. It should be noted that the lower the margin of error, the more accurate our neural network will be, because the training attempts to adjust the matrix of synaptic weights in order to minimize the error between the output produced by the network in relation to the respective desired output [1818 Silva IN, Spatti DH, Flauzino RA. Redes Neurais Artificiais: Para Engenharia e Ciências Aplicadas. São Paulo: Artliber. 2010. 399p.]. In addition, as already pointed out, it will depend on many configuration factors, or on the contrary, it is due to one of the disadvantages of the neural network, the database, which may have errors at the time of data collection.
CONCLUSION
This research presents the study and analysis of the technical feasibility of using ANN's to smooth the power of photovoltaic systems connected to the network associated with BESS. For a better understanding of the data and the proposed work was compiled bibliographies that work with power softening, but to date we do not find literature that works the ANN with power softening as such.
The initial results of this research that are described in this article are promising and show the feasibility of using ANN to smooth power, as it is an easy insertion mechanism that provides a set of inputs and outputs that produce the behavior of the system to be treated. Having the case with a number of neurons equal to 10, obtaining the best power smoothing profile when compared to the others with a greater number of neurons (20, 50 and 100). In addition, the accuracy of the submitted network was done with the help of the error calculation.
On the other hand, even applying it as an ANN, the need for a better implementation of the database was verified, as well as, the inclusion of some external mechanism to smooth the values that go beyond the optimal curve, in the EES loading in times of low consumption.
It is noteworthy that this research is in its initial stage of development by the Research Group on Energy and Energy Sustainability (GPEnSE) linked to the Postgraduate Program in Energy and Sustainability (PPGIES) of the Federal University of Latin American Integration (UNILA).
Acknowledgment
This research has the support and promotion of the Institutional Program Triple Agenda (Edital PRPPG 137/2018) of the Federal University of Integration of Latin America, CAPES, CNPq (N ° 303293 / 2020-9 and N ° 407531 / 2018-1), ITAI and the research project P&D COPEL 2866-0452 / 2016.
The authors, on behalf of the Energy and Energy Sustainability Research Group - GPEnSE, are grateful for the support and encouragement.
REFERENCES
-
1Moslener U, McCrone A, Francoise D'Estais, Grüning C, Louw A, Boyle R, et al. Global Trends in Renewable Energy Investment OECD Publishing. Paris/IEA. 2017. 763p.
-
2Hvidtfeldt Larsen H, Sønderberg Petersen L. DTU international energy report 2013: energy storage options for future sustainable energy systems. Roskilde: Technical University of Denmark; 2013.
-
3EPE. Balanço Energético Nacional (BEN) 2020: 2019. Rio de Janeiro: Ministério de Minas e Energia -MME; 2020 May p. 73.
-
4ExxonMobil. 2017 Outlook for Energy: A view to 2040. In 2017. p. 27-8.
-
5International Energy Agency. World Energy Outlook 2017. OECD Publishing. Paris/IEA. 2017. 763p.
-
6US Energy Information Administration. International Energy Outlook 2017 Overview. In: Technical Report 2017. 2017.
-
7Albuquerque B. Plano Decenal de Expansão de Energia. Brasília: Empresa de Pesquisa Energética; 2021 p. 453.
-
8Du P, Lu N. Energy storage for smart grids: planning and operation for renewable and variable energy resources (VERs). First edition. Amsterdam; Boston: Academic Press, an imprint of Elsevier; 2015. 331 p.
-
9Shivashankar S, Mekhilef S, Mokhlis H, Karimi M. Mitigating methods of power fluctuation of photovoltaic (PV) sources - A review. Renewable and Sustainable Energy Reviews. 2016 Jun; 59:1170-84.
-
10Marcos J, Storkël O, Marroyo L, Garcia M, Lorenzo E. Storage requirements for PV power ramp-rate control. Solar Energy. 2014 Jan; 99:28-35.
-
11Marcos J, de la Parra I, García M, Marroyo L. Control Strategies to Smooth Short-Term Power Fluctuations in Large Photovoltaic Plants Using Battery Storage Systems. Energies. 2014 Oct;7(10):6593-619.
-
12Sasmal RP, Sen S, Chakraborty A. Solar Photovoltaic Output Smoothing: Using Battery Energy Storage System. In: 2016 National Power Systems Conference (NPSC). Bhubaneswar, India; 2016. p. 1-5.
-
13Zheng Y, Sun G, Wei Z, Ma J, Sun Y. An active power smoothing control for photovoltaic-flywheel system using fuzzy control. In: 2012 IEEE Fifth International Conference on Advanced Computational Intelligence (ICACI). Nanjing, China: IEEE; 2012. p. 1113-8.
-
14Ma W, Hu R, Han X, Ding L. Optimal Allocation of Hybrid Energy Storage Systems for Smoothing Photovoltaic Power Fluctuations Considering the Active Power Curtailment of Photovoltaic. IEEE Access. 2019; 7:74787-99.
-
15Wang JC, Wang XR. A Control Strategy for Smoothing Active Power Fluctuation of Wind Farm with Flywheel Energy Storage System Based on Improved Wind Power Prediction Algorithm. Energy and Power Eng. 2013; 5:387-92.
-
16Ding M, Chen Z, Wang B, Chen Z, Luo Y, Zheng G. Unified Control of Smoothing Out Wind Power Fluctuations and Active Power Filtering by an Energy Storage System. IEEE PES ISGT ASIA. 2012;5.
-
17Sun Y, Li S, Lin B, Fu X, Ramezani M, Jaithwa I. Artificial Neural Network for Control and Grid Integration of Residential Solar Photovoltaic Systems. IEEE Transactions on Sustainable Energy. 2017 Oct;8(4):1484-95.
-
18Silva IN, Spatti DH, Flauzino RA. Redes Neurais Artificiais: Para Engenharia e Ciências Aplicadas. São Paulo: Artliber. 2010. 399p.
-
19Wentz VH, Maciel JN, Ledesma JJG, Ando Junior OH. Construção de um Banco de Dados Para Predição do Potencial De Geração de Energia Solar Fotovoltaica. In: Anais do IX Encontro Anual de Iniciação Científica e V Encontro anual de Iniciação em Desenvolvimento Tecnológico e Inovação - EICTI. Foz do Iguaçu; 2020. p. 109.
-
20Benatti KA. O Método de Levenberg - Marquardt para o Problema de Quadrados Mínimos não Linear [Disertação de Mestrado]. [Curitiba]: Universidade Federal de Paraná; 2017.
-
21Gavin HP. The Levenburg - Marqurdt Algorithm For Nonlinear Least Squares Curve-Fitting Problems. Department of Civil and Environmental Engineering Duke University. Duke University. 2019; 1-20.
-
22Sapna S. Backpropagation Learning Algorithm Based on Levenberg Marquardt Algorithm. In: Computer Science & Information Technology (CS & IT). Academy & Industry Research Collaboration Center (AIRCC); 2012. p.393-8.
-
23Aryani DR, Kim J-S, Song H. Suppression of PV Output Fluctuation Using a Battery Energy Storage System with Model Predictive Control. International Journal of Fuzzy Logic and Intelligent Systems. 2017 Sept;17(3): 202-9.
-
24Gabbar HA, Smart Energy Grid Engineering. London, United Kingdom; San Diego, CA: Academic Press; 2017. 568 p.
-
25Gevorgian V, Booth S. Review of PREPA Technical Requirements for Interconnecting Wind and Solar Generation. 2013 Nov. NREL/TP--5D00-57089, 1260328. Report No.: NREL/TP--5D00-57089, 1260328.
-
26Comisión Reguladora de Energía. Reglas Generales de Interconexión al Sistema Eléctrico Nacional: Anexo 3. 2012. 33 p.
-
27Glover JD, Sarma MS. Sistemas de Potencia Análisis y Diseño. 3ra ed. D. F. México: International Thomson Editores S. A.; 2003. 650 p.
-
28Amy de la Breteque E. Etude Du Comportement Thermique De Modules Photovoltaïques En Vue De La Prediction De Leur Production Electrique Sur Site. [Tese De Doutorado]. [Marseille]: L'universite De Provence Institut des Systèmes Thermiques Industriels UMR 6595; 2006.
-
29Rodriguez Cantor GA. Influência Dos Fatores Climáticos No Desempenho De Módulos Fotovoltaicos Em Regiões De Clima Tropical [Tese de Mestre]. [JOÃO PESSOA - PB]: Universidade Federal Da Paraíba; 2017.
-
30Vuolo JH. Avaliação e Expressão de Incerteza em Medição. Revista Brasileira de Ensino de Física. 1999 Sept;21(3): 350-8.
Edited by
Editor-in-Chief:
Associate Editor:
Publication Dates
-
Publication in this collection
09 July 2021 -
Date of issue
2021
History
-
Received
30 Mar 2021 -
Accepted
10 May 2021


