Abstract
INTRODUCTION: The Perception Sensory Threshold (ST) for sinusoidal current stimuli at 5, 250, and 2,000 Hz is commonly used in the assessment of peripheral nerve fibers (C, Aδ, and Aβ, respectively). However, the neuroselectivity of these frequencies is far from consensus. In addition, Reaction Time (RT) measurements suggest that 2,000 Hz stimuli excite Aβ-fibers, 250 Hz Aβ- or Aδ-fibers, as well as 5 Hz Aβ-, Aδ- or C-fibers. Therefore, we suppose that the sinusoidal current neuroselectivity may be better observed if ST and RT parameters are jointly evaluated. In addition, we have investigated whether there are other sets of frequencies that could be used. METHODS: Thus this work investigates ST and RT for stimuli with frequency ranging from 1 to 3,000 Hz, on 28 healthy subjects aged from 19 to 44 years old (27.1±5.49). ST and RT dissimilarity among different frequencies was evaluated applying bi-dimensional Fisher Quadratic Discriminant. RESULTS: The lowest classification error (3.6%) was obtained for 1, 250, and 3,000 Hz. Error for 5, 250, and 2,000Hz was 16.7%. Stimulation frequency at 1 Hz evoked more sensations related to C-fibers (53% of reports) than to Aβ-fibers (36%). However, this behavior did not repeat itself at 5 Hz (only 21% of perceptions were related to C-fibers against 64% to Aβ-fibers). Sensations related to Aβ-fibers prevailed for the highest frequencies presented to the subjects (2,000 Hz - 82% and 3,000 Hz - 93%). Mean RT values showed a decreasing trend with frequency. CONCLUSION: These results suggest that frequencies 1, 250, and 3,000 Hz are more neuroselective than 5, 250, and 2,000 Hz for the evaluation of peripheral sensitive fibers. Furthermore, they show RT usefulness.
Sensory threshold; Reaction Time; Current Perception Threshold (CPT); Nervous fibers evaluation; peripheral neuropathies
ARTIGO ORIGINAL
Current perception threshold and reaction time in the assessment of sensory peripheral nerve fibers through sinusoidal electrical stimulation at different frequencies
Henrique Resende MartinsI,* * e-mail: henriquerm@gmail.com, carjulio@peb.ufrj.br ; Renato ZanettiI; Clarissa Cardoso dos SantosII; Gilberto Mastrocola ManzanoIII; Carlos Julio Tierra-CriolloIV,* * e-mail: henriquerm@gmail.com, carjulio@peb.ufrj.br
IPrograma de Pós-Graduação em Engenharia Elétrica, Universidade Federal de Minas Gerais - UFMG, Av. Antônio Carlos, 6627, CEP 31270-901, Belo Horizonte, MG, Brazil
IIFaculdade de Ceilândia, Universidade de Brasília - UnB, Brasília, DF, Brazil
IIIUniversidade Federal de São Paulo - UNIFESP, São Paulo, Brazil
IVPrograma de Pós-Graduação em Engenharia Elétrica, Universidade Federal de Minas Gerais - UFMG, Belo Horizonte, MG, Brazil. Programa de Engenharia Biomédica, Centro de Tecnologia, COPPE, Universidade Federal do Rio de Janeiro - UFRJ, Rio de Janeiro, RJ, Brazil
ABSTRACT
INTRODUCTION: The Perception Sensory Threshold (ST) for sinusoidal current stimuli at 5, 250, and 2,000 Hz is commonly used in the assessment of peripheral nerve fibers (C, Aδ, and Aβ, respectively). However, the neuroselectivity of these frequencies is far from consensus. In addition, Reaction Time (RT) measurements suggest that 2,000 Hz stimuli excite Aβ-fibers, 250 Hz Aβ- or Aδ-fibers, as well as 5 Hz Aβ-, Aδ- or C-fibers. Therefore, we suppose that the sinusoidal current neuroselectivity may be better observed if ST and RT parameters are jointly evaluated. In addition, we have investigated whether there are other sets of frequencies that could be used.
METHODS: Thus this work investigates ST and RT for stimuli with frequency ranging from 1 to 3,000 Hz, on 28 healthy subjects aged from 19 to 44 years old (27.1±5.49). ST and RT dissimilarity among different frequencies was evaluated applying bi-dimensional Fisher Quadratic Discriminant.
RESULTS: The lowest classification error (3.6%) was obtained for 1, 250, and 3,000 Hz. Error for 5, 250, and 2,000Hz was 16.7%. Stimulation frequency at 1 Hz evoked more sensations related to C-fibers (53% of reports) than to Aβ-fibers (36%). However, this behavior did not repeat itself at 5 Hz (only 21% of perceptions were related to C-fibers against 64% to Aβ-fibers). Sensations related to Aβ-fibers prevailed for the highest frequencies presented to the subjects (2,000 Hz - 82% and 3,000 Hz - 93%). Mean RT values showed a decreasing trend with frequency.
CONCLUSION: These results suggest that frequencies 1, 250, and 3,000 Hz are more neuroselective than 5, 250, and 2,000 Hz for the evaluation of peripheral sensitive fibers. Furthermore, they show RT usefulness.
Keywords: Sensory threshold, Reaction Time, Current Perception Threshold (CPT), Nervous fibers evaluation, peripheral neuropathies.
Introduction
The skin is widely innervated by axons that are distributed through a vast network of peripheral nerves that carry sensory information from the somatosensory receptors to the central nervous system. These axons are known as primary afferents (Gardner and Kandel, 2000; Gardner et al., 2000; Purves, 2004). The axons have a variety of diameters correlated with the type of sensory receptor to which they are linked, making it possible to classify them in three large groups: Aβ, Aδ, and C (Manzano et al., 2008). Type C axons are unmyelinated and present a diameter lower than 1.5 µm, showing the lowest speed of conduction (between 0.5 and 2 m/s). Such fibers are related to pain, temperature, and itching sensations (Gardner and Martin, 2000; Purves, 2004). Thin myelinated Aδ-fibers conduct pain and temperature sensations, but at higher speeds that can achieve 30 m/s. On the other hand, tactile sensations are transmitted by Aβ-fibers, which are thick myelinated axons that can show a conduction speed as high as 75 m/s.
Some neuropathies affect peripheral fibers selectively, such as diabetes (Matsutomo et al., 2005; Richerson et al., 2005), or even gradually, such as the carpal tunnel syndrome (Nishimura et al., 2004) and the leprosy neuronal disease (Van Brakel et al., 2005; Villarroel et al., 2007). This makes the evaluation of each type of fiber an important tool for the diagnosis of diseases or even a progressive indicator of these neuropathies (Matsutomo et al., 2005).
In the 80's, a psycho-physical procedure for assessing the sensitivity to sinusoidal electrical stimulation was proposed (Katims et al., 1986a; Masson et al., 1989; Neurotron Inc., 2012). This method was based on studies suggesting that sinusoidal stimulus at different frequencies would excite sensory systems related to fibers of different diameters, thus increasing the stimulation selectivity (Katims et al., 1986a). The technique used in this evaluation, called Current Perception Threshold (CPT), determines the Sensory Threshold (ST) to the sinusoidal current, which corresponds to the lowest current intensity capable of eliciting perception. Many studies have suggested that a 5 Hz frequency would stimulate unmyelinated fibers (C-fibers), a 250 Hz one, thin myelinated fibers (Aδ-fibers), and a 2,000 Hz one, thick myelinated fibers (Aβ-fibers) (Chado, 1995; Katims et al., 1986b; Katims et al., 1987). However, frequency-based neuroselectivity is far from consensus. In the literature there are several studies that agree with the existence of such phenomenon (Lowenstein et al., 2008; Masson et al., 1989; Matsutomo et al., 2005; Nishimura et al., 2004; Tierra-Criollo et al., 2006), and others that disagree (Tack et al., 1994; Vinik et al., 1995).
Recently, Félix et al. (2009) have associated the Reaction Time (RT), which corresponds to the time elapsed between the application of a stimulus and the indication of perception by the subject, with different stimulation frequencies whenever stimuli with intensity equal to 1.1 times ST are applied, at the frequencies of 5, 250, and 2,000 Hz, and twice ST, at the frequency of 5 Hz. Findings suggest that a 2,000 Hz stimulus would excite Aβ-fibers, a 250 Hz one, Aβ- or Aδ-fibers, and a 5 Hz one, Aβ-, Aδ- or C-fibers, according to Pimentel et al. (2006) and Liu et al. (1996). Therefore, we suppose that the sinusoidal current neuroselectivity may be better observed if ST and RT parameters are jointly evaluated. In addition, we have investigated whether there are other sets of frequencies which could be used. This work aims to analyze whether ST and RT parameters, jointly evaluated at different frequencies (between 1 Hz to 3,000 Hz), contribute to better characterize nervous fibers in order to assist the early diagnosis of neuropathies.
Methods
The experiment assessed ST and RT at different frequencies of sinusoidal current stimulation applied to the skin.
This project was approved by the Ethics Committee of the Federal University of Minas Gerais (UFMG) and registered under Nº 0722.0.203.000-11. The volunteers were instructed about the procedures to be performed and were included in the study only after signing up the "Free and Clarified" Consent Term.
The procedures were performed in a controlled environment at the Biomedical Engineering Laboratory in the Electrical Engineering Department - Federal University of Minas Gerais (UFMG).
The NeuroStim System (Martins, 2008) was used for the electrical stimulation, with frequency ranging from 1 to 3,000 Hz. The system is capable of generating programmable electrical current stimuli as high as 8 mA with resolution of 8 µA. The waveforms may range from 1 Hz to 5,000 Hz at steps of 0.1 Hz, with total harmonic distortion (THD) below 1.5%.
The study included 28 male subjects, aged from 19 to 44 years old (27.1 ± 5.49), without cognitive impairment, after a minimal mental health examination (Bertolucci et al., 1994). All experiments were conducted under controlled room temperature (25 ± 2 ºC). Volunteers were positioned in a comfortable armchair with upper limbs supported by the chair arms.
For stimulation, the dorsal region of the non-dominant hand was first cleaned with alcoholembedded cotton. Stimulation was applied with the use of two 10 mm diameter gold electrodes with a thin amount of conductive gel, separated by a distance of 2 cm between centers. Subjects were instructed to remain relaxed, with eyes open, during all the procedure, and to press a button positioned in their dominant hand whenever they felt any somatosensory perception. Such information was used to determine both ST and RT, the latter defined as the elapsed time (ms) between stimulation and motor response to the stimulus perception.
ST was assessed at 1, 3, 5, 7, 10, 30, 40, 50, 60, 80, 100, 150, 200, 250, 300, 400, 500, 1,000, 2,000, and 3,000 Hz measurements for each frequency, on two different days, in order to evaluate the test's reproducibility and reliability. The frequency values were randomly presented during the procedure, in order to avoid electrical stimulus adaptation and distribute the effects of tiredness, mental fatigue, decrease of motivation and attention at RT among tested frequencies. The total time for the experiment ranged from 90 min to 150 min for each volunteer, depending on the number of failures to detect ST for each frequency.
The following protocol was used in the identification of ST and RT:
The stimulation parameters "initial amplitude" (Ai) and "initial increment" (INCi) were determined by a quick sensitivity test, which consisted of continuously increasing stimulus intensity until the volunteer pressed the button of stimulus perception (BSP). Ai was determined as half of such intensity and INCi as the third part of Ai;
Three-second stimuli were applied (T_ON) with intervals of 3s (T_OFF). After each interval, the stimulus intensity was increased by the value of INCi, until the volunteer pressed the BSP for the first time. At this moment, the current intensity was decreased of INCi and a new increment value was established as half the previous value. This procedure was repeated until the system reached the increment value of 8µA, leading to the closest current value for ST (CPT);
The CPT value found was then confirmed by the following procedure: eight stimuli were randomly applied to the subject, four at CPT intensity level and four at 0µA (false-stimulus); for a positive validation, the volunteer had to identify at least three CPT and three false stimuli. The elapsed time was measured for each valid stimulus identification and RT was calculated as their mean value.
At the end of each frequency tested, volunteers were asked to describe the sensation perceived during stimulation. Sensory perceptions, for the arrangement with the lowest classification error (explained later) and for the one commonly employed in literature (5, 250, and 2,000 Hz), were grouped according to the following criteria:
All reports having at least one word such as "prick", "pang", "twinge", and "burn" (Pimentel et al., 2006) or related, such as "heating" or "pinching" were classified as "Group X";
All reports that showed at least a word such as "squeeze", "pressure", "movement", and "vibration" (Pimentel et al., 2006) or related, such as "tingling sensation", "contraction", "touch" or "numbness", were classified as "Group Y";
Reports that showed words related to both groups above were classified as 'Group XY".
Thus it was possible to check, through the sensory perceptions reported, whether there was any correlation between the stimulus frequency and the sensory perception reported.
The statistical analysis was performed using the software package SPSS 13.0 and MATLAB and differences were considered significant whenever the probability associated was lower than 5%.
The test reproducibility was assessed using the scattering plot and boxplot of ST and RT values for each frequency, comparing both measurements.
The dissimilarity of the parameters ST and RT for different frequencies was evaluated applying bi-dimensional Fisher Quadratic Discriminant (Khemchandani et al., 2010).
Results
Stimulations at 1 Hz showed (Figure 1 and Figure 2) the lowest ST mean (240 µA ± 96 µA) followed by 3, 5, 7 Hz (around 360 µA ± 130 µA), and 10 Hz (388 µA ± 120 µA), but there were no statistical differences (p > 0.05, ANOVA with Tukey's post hoc test). Frequencies from 30 to 300 Hz showed mean values around 486 µA and did not present significant statistical differences among them (Figure 2). On the other hand, frequencies from 500 to 3,000 Hz presented statistical differences (p < 0.05). ST mean values in ranges of 1-10 Hz, 30-300 Hz, and 500-3,000 Hz were statistically different. Thus, stimuli were divided into three frequency classes: low (FL- 1 to 10 Hz), medium (FM - 30 to 300 Hz), and high (FH - 500 to 3,000 Hz).
RT mean values showed decreasing trend with stimulation frequency, although they had high variability (Figure 3).
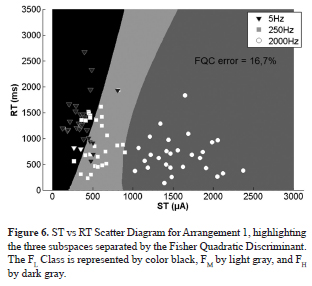
The Fisher Quadratic Classifier (FQC) error was calculated for the 220 different possible arrangements created taking one frequency from each class - 5 possible values for FL, 11 for FM and 4 for FH (Figure 4). The arrangements for FL = 1 Hz (solid lines) presented the lowest FQC error, whereas arrangements using FL = 5 Hz (dotted lines) had the highest classification errors (Figure 4). The lowest FQC error was 3.6%, occurring with FL = 1 Hz, FM = 250 Hz, and FH = 3,000 Hz (named Arrangement 2). For FL = 5 Hz, FM = 250 Hz, and FH = 2,000 Hz (Arrangement 1), the FQC error (16.7%) was 4.6 times greater.
The ST vs RT scatter plot showed a better class separation among FL, FM,and FH frequencies in Arrangement 2 (Figure 5) compared to Arrangement 1 (Figure 6), resulting in a lower FQC error for the former.
The following statistical analyses were made based only on RT and ST values at the frequencies of arrangements 1 and 2.
Examples of the associated probabilities for ST values are presented in Table 1.
RT values at 250 Hz were significantly lower than at 1 Hz and 5 Hz (Table 2), and significantly higher than at 3,000 Hz. However, they had no significant statistical differences compared with 2,000 Hz. There was no significant statistical difference between 2,000 Hz and 3,000 Hz (Table 2).
Stimulation frequency at 1 Hz evoked more sensations related to C-fibers (53% of the reports) than to Aβ-fibers (36%). However, this behavior did not repeat itself at 5 Hz, where only 21% of the perceptions were related to C-fibers against 64% to Aβ-fibers (Table 3). Sensations related to Aβ-fibers were the majority for the highest frequencies applied to the subjects (2,000 Hz - 82% and 3,000 Hz - 93%). Reports having at least one word from each sensation group were prevalent at 250 Hz (Table 3).
Finally, RT and ST measurements reliability and reproducibility were analyzed intra-subject with Pearson correlation (p < 0.05) between sections, leading to r = 0.97 and r = 0.95, respectively. These results indicate an almost perfect agreement, according to Landis and Koch (1977).
Discussion
ST values found for the frequencies of 5 Hz (370 ± 140 µA), 250 Hz (520 ± 150 µA), and 2,000 Hz (1575 ± 350 µA) are similar to the results reported by the normative data obtained with Neurometer (Neurotron Inc., 2012) for sinusoidal electrical current stimulation, often used in the literature (Galvão et al., 2005).
In this study, we were able to separate ST behavior for three frequency bands: low (1 to 10 Hz), medium (30 to 300 Hz), and high (500 to 3,000 Hz).
Mean RT values for 5 Hz (1,200 ms), 250 Hz (850 ms), and 2,000 Hz (650 ms) showed a decreasing trend with respect to the frequencies. The same behavior was obtained by Félix et al. (2009), who reported lower RT values. This difference might be due to the distinct methodologies adopted. While Félix et al. (2009) determined the RT value as the subject shortest response time in a series of 10 stimuli at the intensity of 1.1 × ST, in this study, this parameter was determined as mean RT during the validation stage of ST at 1.0 × ST intensity level.
The joint dissimilarity of ST and RT among all tested frequencies was analyzed by using the Fisher Quadratic Discriminant Classifier for the three distinct classes (low, medium, and high frequencies), taking into consideration all possible arrangements of frequencies, taking a single frequency from each band. The classification errors led to a better class separation for Arrangement 2 (1, 250, and 3,000 Hz) than Arrangement 1 (5, 250, and 2,000 Hz), the latter widely used in literature for the evaluation of peripheral nervous fibers (Hedman and Sullivan, 2011, Lowenstein et al., 2008; Matsutomo et al., 2005; Nishimura et al., 2004; Pimentel et al., 2006). Additionally, it was possible to verify that classification errors occur mainly at low and medium frequencies, for both arrangements, suggesting that such stimuli can activate similar fiber groups. On the other hand, high frequencies (2,000 Hz or 3,000 Hz) showed a well-defined separation compared to the other classes, which could mean stimulation of another fiber group.
It is noteworthy that the classification was based on two variables (ST and RT). If the ST value were considered alone, as it is usually done in literature, the classification error would increase from 16.7% to 19.1% for Arrangement 1 and from 3.6% to 7.1% for Arrangement 2. When RT alone is taken into account, the error would be even higher (47.6% for Arrangement 1 and 41.7% for Arrangement 2), which may explain the poor neuroselectivity for such parameter. These findings agree with Félix et al. (2009), who found poor neuroselectivity for low and medium frequencies.
Evaluating the RT parameter, we observed that, at high frequencies (2,000 and 3,000 Hz), only 3,000 Hz was statistically different (p < 0.05) from 250 Hz (Table 2), suggesting that the classification between 250 and 3,000 Hz would be more efficient than 250 and 2,000 Hz.
The sensory perceptions reported in Table 3 suggest that Arrangement 2 showed higher neuroselectivity than Arrangement 1. The C-fibers activation was more evident at 1 Hz than 5 Hz. On the other hand, taking into consideration high frequencies for Arrangement 1 (FH = 2,000 Hz) and Arrangement 2 (FH = 3,000 Hz), the sensory perception reports associated with Aβ-fibers were higher (93% at 3,000 Hz and 82% at 2,000 Hz) than reports concerning C-fibers (4% at 3,000 Hz and 2,000 Hz). These findings might explain the lower FQC error for Arrangement 2.
Several studies confirming the outcomes of Arrangement 1 are found in literature. For example, Tack et al. (1994) compared standardized clinical examination scores with measurements of vibratory and current perception threshold in diabetic polyneuropathy. Correlations between CPT and neurological examination scores (reflecting C-fibers and Aβ-fibers functions) were the highest ones at 2,000 Hz (r = 0.88) and no advantage for lower frequency CPT could be identified.
Results related to sensory perception (Table 3) are similar to those found in works of Tierra-Criollo et al. (2006) and Pimentel et al. (2006), which suggested that sinusoidal electrical currents at 5 and 2,000 Hz evoke different sensations. According to Félix et al. (2009), stimuli at 2,000 Hz would activate Aβ-fibers while stimuli at 5 Hz would activate Aβ- , Aδ-, and C-fibers. Furthermore, Liu et al. (1996) reported that ST values obtained during analgesic administration (Fentanyl) were affected only for stimuli at 5 and 250 Hz. This might indicate that 2,000 Hz stimuli have no connection with pain-conductive fibers.
Such phenomena may be justified by the sensory receptors anatomic layout. According to Grimnes and Martinsen (2000), low-frequency currents are expected to penetrate the skin less than high-frequency ones, having, therefore, a higher effect on free electrical terminations laid more superficially than thick fibers. In addition, since thin fibers have a higher capacitance (Koester and Sielgelbaum, 2000), one expects that currents with a slower ascension would, initially, favor these fibers depolarization. Moreover, low frequencies stimulus at a lower ST value might also hamper the development of action potentials in thick fibers due to the sodium channels inactivation rate and could explain why low frequencies stimuli with increased amplitude active thick fiber (Félix et al., 2009).
Some limitations of this work should be kept in mind. First, we assumed that the central processing and efferent response time were similar for Aβ-, Aδ-, and C-fibers (Félix et al., 2009). According to Yarnitsky and Ochoa (1991) this time is around 200 ms for the Aδ- and C-fibers. However, it is not proven by laser studies that RT measurements produced similar results (Mouraux et al., 2003).
Another limitation is that an increase in RT could occur for low frequencies, being associated with time for waves reach its peak value. However, the difference between mean RT measurements for 1 Hz and 5 Hz frequencies was 500 ms, greater than the delay between theirs peaks (200ms), being insufficient to explain this difference.
Our findings suggest that the evaluation of peripheral nervous fibers by electrical stimulation with sinusoidal currents might have better results if the CPT technique also used the RT parameter in its classification. It also indicates that the joint evaluation of ST and RT parameters showed greater dissimilarity for stimuli at 1, 250, and 3,000 Hz than at 5, 250, and 2,000 Hz - the former, therefore, more suitable for neuroselectivity evaluations by sinusoidal electrical current.
Sinusoidal electrical currents at different frequencies evoke different sensations. Stimuli at 3,000 Hz are more associated with sensations related to thick myelinated fibers and, at 1 Hz, with sensations related to Aβ- and C-fibers, although sensations associated with the latter are more often reported.
The more neuroselective characteristic of the frequencies of Arrangement 2, associated with the better description of the joint evaluation for parameters ST and RT, may produce significant benefits to the diagnosis of neuropathies affecting peripheral fibers either selectively or gradually, allowing their early identification, or even indicating their degree of evolution.
Acknowledgements
The work was supported by CNPq, CAPES and FAPEMIG, Brazil. Thanks to PhD. Danilo Melges for your help with the final manuscript.
References
Bertolucci PH, Brucki SM, Campacci SR, Juliano Y. The Mini-Mental State Examination in a general population: impact of educational status. Arquivos de Neuro-Psiquiatria. 1994;52(1):1-7.PMid :8002795.
Chado HN. Current perception threshold evaluation of sensory nerve function in pain management. Pain Digest. 1995;5:127-34.
Félix EP, Giuliano LM, Tierra-Criollo CJ, Gronich G, Braga NI, Peres CA, Nóbrega JA, Manzano GM. Sensations and reaction times evoked by electric current sinusoidal stimulation. Neurophysiologie Clinique/Clinical Neurophysiology. 2009;39(6):283-90. PMid:19962656.
Galvão ML, Manzano GM, Braga NIO, Nóbrega JA. Determination of electric current perception threshold in a sample of normal volunteers. Arquivos de Neuro-Psiquiatria. 2005;63(2A):289-93. PMid:16100976.
Gardner EP, Kandel ER. Touch. In: Kandel ER, Schuwarts JH, Jessel TM. Principles of neural science. New York: McGraw-Hill; 2000. p. 430-50.
Gardner EP, Martin JH. Coding of sensory information. In: Kandel ER, Schwarts JH, Jessell TM. Principles of neural science. New York: McGraw-Hill; 2000. p. 412-28.
Gardner EP, Martin JH, Jessell TM. The bodily senses. In: Kandel ER, Schuwarts JH, Jessel TM. Principles of neural science. New York: McGraw-Hill; 2000. p. 451-72.
Grimnes S, Martinsen ØG. Electrical properties of tissue. In: Grimnes S, Martinsen OG. Bioimpedance and bioelectricity bases. London: Academic Press, 2000. p. 87-125. http://dx.doi.org/10.1016/B978-012303260-7/50004-6
Hedman LD, Sullivan JE. An initial exploration of the perceptual threshold test using electrical stimulation to measure arm sensation. Clinical Rehabilitation. 2011;25:1042-9. http://dx.doi.org/10.1177/0269215511399475
Katims JJ, Naviasky EH, Ng LK, Rendell Ml, Bleecker ML. New screening device for assessment of peripheral neuropathy. Journal of Occupational and Environmental Medicine. 1986a;28(12):1219-21. PMid:3027284.
Katims JJ, Long DM, Lky N. Transcutaneous nerve stimulation. Frequency and waveform specificity in humans. Appl Neurophysiol.1986b; 49(1-2):86-91. PMid:3490223.
Katims JJ, Naviasky EH, Ng LK, Rendell M, Bleecker ML. Constant current sine wave transcutaneous nerve stimulation for evaluation of peripheral neuropathy. Arch Phys Med Rehabil. 1987;68(4):210-3. PMid:3032128.
Khemchandani R, Jayadeva, Chandra S. Learning the optimal kernel for Fisher discriminant analysis via second order cone programming. European Journal of Operational Research. 2010;203:692-7. http://dx.doi.org/10.1016/j.ejor.2009.09.020
Koester J, Siegelbaum SA. Local signaling passive electrical properties of the neuron. In: Kandel ER, Schwarts JH, Jessell TM. Principles of neural science. New York: McGraw-Hill; 2000. p. 140-9.
Landis JR, Koch GG. The measurement of observer agreement for categorical data. Biometrics. 1977;33(1):159-74. http://dx.doi.org/10.2307/2529310
Liu SS, Gerancher JC, Bainton BG, Kopacz DJ, Carpenter RL. The effects of electrical stimulation at different frequencies on perception and pain in human volunteers: epidural versus intravenous administration of fentanyl. Anesthesia & Analgesia. 1996;82(1):98-102. PMid:8712434.
Lowenstein L, Jesse K, Kenton K. Comparison of perception threshold testing and thermal-vibratory testing. Muscle Nerve. 2008;37(4):514-7. PMid:18067137.
Manzano GM, Giuliano MP, Nóbrega JAM. A brief historical note on the classification of nerve fibers. Arquivos de Neuro-Psiquiatria. 2008;66:117-9. http://dx.doi.org/10.1590/S0004-282X2008000100033
Martins HR. Sistema para o estudo do limiar de percepção de corrente elétrica com forma de onda arbitrária [dissertation]. Belo Horizonte: Federal University of Minas Gerais; 2008.
Masson EA, Veves A, Fernando D, Boulton AJM. Current Perception Threshold: a new, quick, and reproducible method for the assessment of peripheral neuropathy in diabetes mellitus. Diabetologia. 1989;32(10):724-8. PMid:2591640.
Matsutomo R, Takebayashi K, Aso Y. Assessment of peripheral neuropathy using measurement of the current perception threshold with the neurometer® in patients with type 2 diabetes mellitus. Journal of International Medical Research. 2005;33(4):442-53. PMid:16104448.
Mouraux A, Guérit JM, Plaghki L. Non-phase locked electroencephalogram (EEG) responses to CO2 laser skin stimulations may reflect central interactions between A[delta]- and C-fiber afferent volleys. Clinical Neurophysiology. 2003;114:710-22. http://dx.doi.org/10.1016/S1388-2457(03)00027-0
Neurotron Inc. Normative Neuroselective Current Perception Threshold (CPT) Values. Data - Neurotron Incorporated website. [cited 2012 May 15]. Available from: http://neurotron.com/Norma tive__Current_Perception_Threshold_CPT_Values.html.
Nishimura A, Oguraa T, Hasea H. A correlative electrophysiologic study of nerve fiber involvement in carpal tunnel syndrome using current perception thresholds. Clinical Neurophysiology. 2004;115(8):1921-4. PMid:15261871.
Pimentel JM, Petrillo R, Vieira MM, Giuliano LM, Tierra-Criollo CJ, Braga NI, Nóbrega JA, Manzano GM. Perceptions and electric senoidal current. Arquivos de Neuro-Psiquiatria. 2006;64(1):10-3. PMid:16622545.
Purves D. The Somatic Sensory System. In: Fitzpatrick D, editor. Neuroscience. 3rd ed. Sunderland: Sinauer Associates, Inc.; 2004. p. 189-95.
Richerson SJ, Robinson CJ, Shum J. A comparative study of reaction times between type II diabetics and non-diabetics. Biomedical Engineering Online. 2005;4:12. http://dx.doi.org/10.1186/1475-925X-4-12
Tack C, Netten PM, Scheepers MH, Meijer JW, Smits P, Lutterman J. Comparison of clinical examination, current and vibratory perception threshold in diabetic polyneuropathy. Netherlands Journal of Medicine. 1994;44(2):41-9. PMid:8208323.
Tierra-Criollo CJ, Camêlo PM, Pereira MTS, De Paula AR Jr, Giuliano LMP, Manzano GM. Clustering of somatosensory sensations during sinusoidal current stimulation. Revista Brasileira de Engenharia Biomédica. 2006;22(2):143-9.
Van Brakel WH, Nicholls PG, Das L, Barkataki P, Maddali P, Lockwood DN, Wilder-Smith E. The INFIR cohort study: assessment of sensory and motor neuropathy in leprosy at baseline. Leprosy Review. 2005;76(4): 277-95. PMid:16411508.
Villarroel MF, Orsini MB, Lima RC, Antunes CM. Comparative study of the cutaneous sensation of leprosy-suspected lesions using Semmes-Weinstein monofilaments and quantitative thermal testing. Leprosy Review. 2007;78(2):102-9. PMid:17824480.
Vinik AI, Suwanwalaikorn S, Stansberry KB, Holland MT, McNitt PM, Colen LE. Quantitation measurement of cutaneous perception in diabetic neuropathy. Muscle Nerve. 1995;18(6):574-84. PMid:7753119.
Yarnitsky D, Ochoa JL. Warm and cold specific somatosensory systems: Psychophysical thresholds, reaction times and peripheral conduction velocities. Brain. 1991;114:1819-26. http://dx.doi.org/10.1093/brain/114.4.1819
Recebido: 11/01/2013
Aceito: 16/07/2013
- Bertolucci PH, Brucki SM, Campacci SR, Juliano Y. The Mini-Mental State Examination in a general population: impact of educational status. Arquivos de Neuro-Psiquiatria. 1994;52(1):1-7.PMid :8002795.
- Chado HN. Current perception threshold evaluation of sensory nerve function in pain management. Pain Digest. 1995;5:127-34.
- Félix EP, Giuliano LM, Tierra-Criollo CJ, Gronich G, Braga NI, Peres CA, Nóbrega JA, Manzano GM. Sensations and reaction times evoked by electric current sinusoidal stimulation. Neurophysiologie Clinique/Clinical Neurophysiology. 2009;39(6):283-90. PMid:19962656.
- Galvão ML, Manzano GM, Braga NIO, Nóbrega JA. Determination of electric current perception threshold in a sample of normal volunteers. Arquivos de Neuro-Psiquiatria. 2005;63(2A):289-93. PMid:16100976.
- Gardner EP, Kandel ER. Touch. In: Kandel ER, Schuwarts JH, Jessel TM. Principles of neural science. New York: McGraw-Hill; 2000. p. 430-50.
- Gardner EP, Martin JH. Coding of sensory information. In: Kandel ER, Schwarts JH, Jessell TM. Principles of neural science. New York: McGraw-Hill; 2000. p. 412-28.
- Gardner EP, Martin JH, Jessell TM. The bodily senses. In: Kandel ER, Schuwarts JH, Jessel TM. Principles of neural science. New York: McGraw-Hill; 2000. p. 451-72.
- Grimnes S, Martinsen ØG. Electrical properties of tissue. In: Grimnes S, Martinsen OG. Bioimpedance and bioelectricity bases. London: Academic Press, 2000. p. 87-125. http://dx.doi.org/10.1016/B978-012303260-7/50004-6
- Hedman LD, Sullivan JE. An initial exploration of the perceptual threshold test using electrical stimulation to measure arm sensation. Clinical Rehabilitation. 2011;25:1042-9. http://dx.doi.org/10.1177/0269215511399475
- Katims JJ, Naviasky EH, Ng LK, Rendell Ml, Bleecker ML. New screening device for assessment of peripheral neuropathy. Journal of Occupational and Environmental Medicine. 1986a;28(12):1219-21. PMid:3027284.
- Katims JJ, Long DM, Lky N. Transcutaneous nerve stimulation. Frequency and waveform specificity in humans. Appl Neurophysiol.1986b; 49(1-2):86-91. PMid:3490223.
- Katims JJ, Naviasky EH, Ng LK, Rendell M, Bleecker ML. Constant current sine wave transcutaneous nerve stimulation for evaluation of peripheral neuropathy. Arch Phys Med Rehabil. 1987;68(4):210-3. PMid:3032128.
- Khemchandani R, Jayadeva, Chandra S. Learning the optimal kernel for Fisher discriminant analysis via second order cone programming. European Journal of Operational Research. 2010;203:692-7. http://dx.doi.org/10.1016/j.ejor.2009.09.020
- Koester J, Siegelbaum SA. Local signaling passive electrical properties of the neuron. In: Kandel ER, Schwarts JH, Jessell TM. Principles of neural science. New York: McGraw-Hill; 2000. p. 140-9.
- Landis JR, Koch GG. The measurement of observer agreement for categorical data. Biometrics. 1977;33(1):159-74. http://dx.doi.org/10.2307/2529310
- Liu SS, Gerancher JC, Bainton BG, Kopacz DJ, Carpenter RL. The effects of electrical stimulation at different frequencies on perception and pain in human volunteers: epidural versus intravenous administration of fentanyl. Anesthesia & Analgesia. 1996;82(1):98-102.
- Lowenstein L, Jesse K, Kenton K. Comparison of perception threshold testing and thermal-vibratory testing. Muscle Nerve. 2008;37(4):514-7. PMid:18067137.
- Manzano GM, Giuliano MP, Nóbrega JAM. A brief historical note on the classification of nerve fibers. Arquivos de Neuro-Psiquiatria. 2008;66:117-9. http://dx.doi.org/10.1590/S0004-282X2008000100033
- Martins HR. Sistema para o estudo do limiar de percepção de corrente elétrica com forma de onda arbitrária [dissertation]. Belo Horizonte: Federal University of Minas Gerais; 2008.
- Masson EA, Veves A, Fernando D, Boulton AJM. Current Perception Threshold: a new, quick, and reproducible method for the assessment of peripheral neuropathy in diabetes mellitus. Diabetologia. 1989;32(10):724-8. PMid:2591640.
- Mouraux A, Guérit JM, Plaghki L. Non-phase locked electroencephalogram (EEG) responses to CO2 laser skin stimulations may reflect central interactions between A[delta]- and C-fiber afferent volleys. Clinical Neurophysiology. 2003;114:710-22. http://dx.doi.org/10.1016/S1388-2457(03)00027-0
- Neurotron Inc. Normative Neuroselective Current Perception Threshold (CPT) Values. Data - Neurotron Incorporated website. [cited 2012 May 15]. Available from: http://neurotron.com/Norma tive__Current_Perception_Threshold_CPT_Values.html
- Nishimura A, Oguraa T, Hasea H. A correlative electrophysiologic study of nerve fiber involvement in carpal tunnel syndrome using current perception thresholds. Clinical Neurophysiology. 2004;115(8):1921-4. PMid:15261871.
- Pimentel JM, Petrillo R, Vieira MM, Giuliano LM, Tierra-Criollo CJ, Braga NI, Nóbrega JA, Manzano GM. Perceptions and electric senoidal current. Arquivos de Neuro-Psiquiatria. 2006;64(1):10-3. PMid:16622545.
- Purves D. The Somatic Sensory System. In: Fitzpatrick D, editor. Neuroscience. 3rd ed. Sunderland: Sinauer Associates, Inc.; 2004. p. 189-95.
- Richerson SJ, Robinson CJ, Shum J. A comparative study of reaction times between type II diabetics and non-diabetics. Biomedical Engineering Online. 2005;4:12. http://dx.doi.org/10.1186/1475-925X-4-12
- Tack C, Netten PM, Scheepers MH, Meijer JW, Smits P, Lutterman J. Comparison of clinical examination, current and vibratory perception threshold in diabetic polyneuropathy. Netherlands Journal of Medicine. 1994;44(2):41-9. PMid:8208323.
- Tierra-Criollo CJ, Camêlo PM, Pereira MTS, De Paula AR Jr, Giuliano LMP, Manzano GM. Clustering of somatosensory sensations during sinusoidal current stimulation. Revista Brasileira de Engenharia Biomédica. 2006;22(2):143-9.
- Van Brakel WH, Nicholls PG, Das L, Barkataki P, Maddali P, Lockwood DN, Wilder-Smith E. The INFIR cohort study: assessment of sensory and motor neuropathy in leprosy at baseline. Leprosy Review. 2005;76(4): 277-95. PMid:16411508.
- Villarroel MF, Orsini MB, Lima RC, Antunes CM. Comparative study of the cutaneous sensation of leprosy-suspected lesions using Semmes-Weinstein monofilaments and quantitative thermal testing. Leprosy Review. 2007;78(2):102-9. PMid:17824480.
- Vinik AI, Suwanwalaikorn S, Stansberry KB, Holland MT, McNitt PM, Colen LE. Quantitation measurement of cutaneous perception in diabetic neuropathy. Muscle Nerve. 1995;18(6):574-84. PMid:7753119.
- Yarnitsky D, Ochoa JL. Warm and cold specific somatosensory systems: Psychophysical thresholds, reaction times and peripheral conduction velocities. Brain. 1991;114:1819-26. http://dx.doi.org/10.1093/brain/114.4.1819
Publication Dates
-
Publication in this collection
28 Oct 2013 -
Date of issue
Sept 2013
History
-
Received
11 Jan 2013 -
Accepted
16 July 2013