Abstract
Exopolysaccharide (EPS) biopolymers produced by microorganisms play a crucial role in the environment such as health and bio-nanotechnology sectors, gelling agents in food and cosmetic industries in addition to bio-flocculants in the environmental sector as they are degradable, nontoxic. This study focuses on the improvement of EPS production through manipulation of different culture and environmental conditions using response surface methodology (RSM). Plackett-Burman design indicated that; molasses, yeast extract and incubation temperature are the most effective parameters. Box-Behnken RSM indicated that; the optimum concentration for each parameter was 12% (w/v) for molasses, 6 g/L yeast extract and 30 °C for incubation temperature. The most potent bacterial isolate was identified as Bacillus velezensis KY498625. After production, EPS was extracted, purified using DEAE-cellulose, identified using Fourier transform infrared (FTIR), gel permeation chromatography (GPC) and gas chromatography-mass spectroscopy (GC-MS). The result indicated that; it has molecular weight 1.14 × 10⁵ D consisting of glucose, mannose and galactose.
Keywords:
Bacterial exopolysaccharide; Plackett-Burman; Box-Behnken; DEAE-cellulose
Introduction
Microbial exopolysaccharides are the most significant group of biopolymer.11 Ates O. Systems biology of microbial exopolysaccharide production. Front Bioeng Biotechnol. 2015;(3):200. Depending on their location, EPS represented either in capsular form or slimy layer.22 Freitas F, Alves VD, Reis MA, Crespo JG, Coelhoso IM. Microbial polysaccharide-based membranes: current and future applications. J Appl Polym Sci. 2014;(6):131. Microbial exopolysaccharide are mainly composed of sugar polymers that are produced by large number of microorganisms including bacteria, fungi and yeasts.33 Freitas F, Alves VD, Pais J, et al. Production of a new exopolysaccharide (EPS) by Pseudomonas oleovorans NRRL grown on glycerol. Process Biochem. 2010;(45):297-305. Natural biopolymers (bacterial polysaccharides) are biodegradable and biocompatible in comparison with harmful synthetic polymers.44 Wang CL, Chen CJ, Nguyen AD, et al. Environmental chitinous materials as adsorbents for one-step purification of protease and chitosanase. Res Chem Intermed. 2014;(40):2363-2369. Over the past few decades, the number of known exopolysaccharide (EPS) produced by microbial fermentation has gradually increased. Microbial biopolymers have many application in biotechnology fields including pharmaceutical, tissue engineering, cosmetics, food, textile, oil recovery, metal mining and metal recovery.55 Alsharabasy AM, Moghannem SA, El-Mazny WN. Physical preparation of alginate/chitosan polyelectrolyte complexes for biomedical applications. J Biomater Appl. 2015;30(7):1071-1079.,66 Khopade A, Ren B, Liu X, Mahadik K, Zhang L, Kokare C. Production and characterization of biosurfactant from marine Streptomyces species B3. J Colloid Interface Sci. 2012;367:311-318. The production of microbial EPS are highly affected with nutritional and environmental conditions.77 Staudt AK, Wolfe LG, Shrout JD. Variations in exopolysaccharide production by Rhizobium tropici. Arch Microbiol. 2012;194(3):197-206.,88 Suresh Kumar A, Mody K, Jha B. Bacterial exopolysaccharides - a perception. J Basic Microbiol. 2007;47(2):103-117.
Compared with conventional methods, RSM can be used to design experiments, build models, search optimum factors for desirable responses, and evaluate the relative significance of several influence factors even in the presence of complex interactions.99 Khuri AI, Mukhopadhyay S. Response surface methodology. WIREs Comp Stat. 2010;2(2):128-149. The new era of microbial biopolymer production on industrial scale is directed for the production from inexpensive sources like agro-industrial wastes.1010 Pacwa-Płociniczak M, Płaza GA, Piotrowska-Seget Z, Cameotra SS. Environmental applications of biosurfactants. Recent advances. Int J Mol Sci. 2011;12(1):633-654. Molasses is the final effluent obtained in the production of sugar by repeated crystallization.1111 Razack SA, Velayutham V, Thangavelu V. Medium optimization for the production of exopolysaccharide by Bacillus subtilis using synthetic sources and agro wastes. Turk J Biol. 2013;37(3):280-288. Sugarcane molasses could be a better source of carbon due to its higher content of total sugars at 48.3%. Large scale production of microbial polysaccharide requires intensive research activities for the application of innovative ideas on a large scale. This research aimed to enhance EPS production from most potent bacterial strain using powerful statistical experimental design as one of the most important steps toward production at the industrial level.
Material and methods
Isolation and purification of bacteria producing exopolysaccharide (EPS)
Seven soil samples were collected from Al-Bahariya Oasis, Egypt 28°24¢17″N 28°52¢25″E. Each sample was serially diluted from 10-1 to 10-7 in phosphate buffered saline, pH 7.2 ± 0.2. One mL of each dilution was inoculated into tubes containing 9 mL EPS culture medium [0.2 g KH2PO4; 1.5 g K2HPO4; 0.2 g MgSO4.7H2O; 0.1 g CaSO4.2H2O; 2.0 mg FeCl3; 0.5 g yeast extract, 20 g sucrose (per liter)]. Bacteria producing EPS (characterized by colonies of bacteria that form thick slime or mucoid) was selected and purified.1212 Ruas-Madiedo P, De Los Reyes-Gavilán CG. Invited review: methods for the screening, isolation, and characterization of exopolysaccharides produced by lactic acid bacteria. J Dairy Sci. 2005;88(3):843-856.
Determination of EPS yield
Bacterial culture was mixed with two volumes of cold absolute ethanol, and centrifuged for 10 min at 10,000 rpm. This step was repeated twice to remove impurities of low molecular weight. Exopolysaccharide was dissolved in deionized water and quantified using phenol-sulfuric acid method.1313 Dubois M, Gilles KA, Hamilton JK, Rebers P, Smith F. Colorimetric method for determination of sugars and related substances. Anal Chem. 1956;28(3):350-356. All experiment was repeated in triplicate to calculate mean value of results.
Preparation of cane molasses as the carbon source
Sugarcane molasses was obtained from a sugar factory at (sugarcane factory in Kafr El Sheikh, Egypt) that has been used as carbon source. Molasses was diluted with distilled water containing sodium di-hydrogen orthophosphate (2.0 g/L) with ratio 1:1. The solution was autoclaved at 121 °C for 15 min and left to settle for 24 h.1414 Fuscon R, Godinho MJL, Bossola NRS. Culture and exopolysaccharide production from sugarcane molasses by Gordonia polyisoprenivorans CCT 7137, isolated from contaminated groundwater in Brazil. World J Microbiol Biotechnol. 2008;24(7):937-943. The clarified molasses were used as sole carbon source at different concentrations 1, 2, 3, 4, 5, 6, 7 and 10%.
Experimental designs and optimization
Classical one factor at a time: this method depend on change in one factor at a time where other factors remaining constant.1515 Prasanna PHP, Grandison AS, Charalampopoulos D. Bifidobacteria in milk products: an overview of physiological and biochemical properties, exopolysaccharide production, selection criteria of milk products and health benefits. Food Res Int. 2014;55:247-262. Single-factor experiments were carried out in 500 mL flask containing 100 mL medium at 200 rpm/min and 30 °C (glucose, sucrose, lactose, maltose, soluble starch, fructose and sugarcane molasses), six nitrogen sources (yeast extract, peptone, urea, (NH4)2SO4, NH4Cl and KNO3). Statistical analysis was generated by Microsoft excel 2010 software and p levels at 0.05 were considered as significant.
Optimization of EPS using Plakett-Burman (PB) design
The PB experimental design was applied to screen the significant variables that influence EPS production.1616 Chen HQ, Chen XM, Chen TX, Xu XM, Jin ZY. Optimization of solid-state medium for the production of inulinase by Aspergillus ficuum JNSP5-06 using response surface methodology. Carbohydr Polym. 2011;86(1):249-254. Eleven variables of medium composition and culture conditions were tested at low (-1) and high (+1) levels as shown in Table 1. Based on PB matrix design, two-level factorial design, it allows the investigation of 12 variables (n + 1).1717 Plackett RL, Burman JP. The design of optimum multifactorial experiments. Biometrika. 1946;33(4):305-325. This design consisted of three replicated center points to avoid error.
Plackett-Burman experimental design for screening of culture conditions affecting EPS production.
where Y is the predicted response, β0 is the model intercept; βi is the linear coefficient and Xi is the level of the independent variable.
EPS production was measured in triplicate and the average value was taken as the response. The variables significant at 95% level (p < 0.05) were considered to have significant effect on EPS production and thus used for further optimization.
Response surface methodology
Box-Behnken design (BBD) with three factors and three levels, including three replicates at the center point, were used for fitting a second-order response surface to provide a measure of process stability and inherent variability.1818 Khani M, Bahrami A, Ghafari MD. Optimization of operating parameters for anti-corrosive biopolymer production by Chryseobacterium Indologenes MUT 2 using central composite design methodology. J Taiwan Inst Chem Eng. 2015;59:165-172.,1919 Ferreira SC, Bruns RE, Ferreira HS, et al. Box-Behnken design. An alternative for the optimization of analytical methods. Anal Chim Acta. 2007;597:179-186. The center points and parameters were selected according to Plackett-Burman design. Fifteen trials for three different variables including medium consisted of sugarcane molasses, yeast extract and incubation temperature were designed. Three levels, "high (+1)", "middle (0)" and "low (-1)" as shown in Table 2. Regression analysis was performed on the data obtained using software package ‘Design Expert' software (Version 7.0) and confirmed by Microsoft Excel 2010.2020 Rahman MBA, Chaibakhsh N, Basri M, Salleh AB, Radzi SM. Modeling and optimization of lipase-catalyzed synthesis of dilauryl adipate ester by response surface methodology. J Chem Technol Biotechnol. 2008;83:1534-1540. The accuracy of polynomial model equation was expressed by coefficient of determination R2. All experiments were performed in triplicates. The design is represented by a second-order polynomial regression model as follows:
where Y is the predicted response, β0 is the intercept, βi is the linear coefficient, βij is the interactive coefficients, βii is the quadratic coefficients, and Σ is the error, and xi and xj are the coded independent variables.
Identification of bacterial isolate
Identification of most potent bacterial isolate was based on 16S rDNA sequence analysis. This step was carried out in Sigma Company for Research, Cairo, Egypt. Forward and reverse primers used for PCR amplification were:
PCR sequence was carried out in GATC (Guanin Adenin Thymin Cytosine) German Company using ABI 3730 X1 DNA sequencer. The sequence of closely related strains were retrieved for constructing the phylogenetic tree to confirm similarities of most potent strain with other related groups. The sequence obtained was subjected to BLAST search and the bacterial species were determined. The percentages of sequence matching were also analyzed and the sequences was submitted to NCBI-Gen Bank and obtained accession numbers.
Purification of EPS by diethylaminoethyl-cellulose (DEAE-cellulose)
DEAE-cellulose was used as anion exchanger Peterson and Sober,2121 Peterson EA, Sober HA. Column chromatography of proteins: substituted celluloses. Methods Enzymol. 1962;5:3-27. Ion exchange chromatography was performed for purification of the EPS by the DEAE-Cellulose column after first purification by trichloroacetic acid. It was equilibrated with 0.05 M Tris-buffer (pH 7.5) to be used in chromatography. The lyophilized crude EPS sample was dissolved in small volume of 0.1 M NaCl. Then fractions was initially purified by DEAE-cellulose column chromatography and eluted with 25 mM Tris-HCl (pH 8.5). Polysaccharide containing fractions were determined for the presence of the total sugar by phenol-sulfuric acid method.1313 Dubois M, Gilles KA, Hamilton JK, Rebers P, Smith F. Colorimetric method for determination of sugars and related substances. Anal Chem. 1956;28(3):350-356. The fractions containing sugar were pooled, concentrated by ultra-filtration, and precipitated with 2 volumes of ethanol, respectively.
Characterization and identification of purified fraction
The purified fraction was characterized using the following spectroscopic analysis, Molecular Weight Distribution Assay by gel permeation chromatography (GPC) (Agilent 1100 series), Infrared IR (Matson Satellite 113 spectrometer), gas mass chromatography according to Seviour et al.2222 Seviour T, Lambert LK, Pijuan M, Yuan Z. Structural determination of a key EPS in mixed culture aerobic sludge granules using NMR spectroscopy. Environ Sci Technol. 2010;44(23):8964-8970. (Shimadzu GC-MS-QP5050 Thermo Scientific Prop). The peaks were identified and compare with by with the standard monosaccharide.
Result
Isolation and purification of bacteria producing exopolysaccharide (EPS)
The most potent bacterial isolates producing exopolysaccharide were M7 (30), E1 (52) and 9I (55) that have been selected from sixty isolate. The isolate 9I (55) was the maximum productivity of about 3 mg/mL that has been selected for further study of research. The selection was based on both ropy strand formation and quantitative method by phenol sulphuric after ethanol precipitation as shown in Fig. 1a. The bacterial isolate 9I was highest for mucoid and ropy formation after 24 h of incubation as shown in Fig. 1b.
The two selection criteria for the most potent bacterial isolate were: (A) EPS precipitation using ethanol 70% and (B) is the ropy strand formed by 9I strain.
Single factor optimization design and data analysis
Our results showed that there was strong correlation between bacterial growth and exopolysaccharide production in culture media where the isolate 9I (55) exhibited lag phase during 16 h of growth (no productivity of EPS). After 18 h of incubation; the log phase of bacterial growth was maximum until 40 h were the productivity of exopolysaccharide start to increase with increasing bacterial growth while the maximum productivity of EPS was during Stationary phase (after 48 h) and still constant until 80 h of incubation (Fig. 2).
Correlation between bacterial growth curve and exopolysaccharide production of bacterial isolate 9I (55).
To elucidate the optimal growth medium composition for maximal EPS production, various factors were assessed. Different carbon and nitrogen sources were used, the result obtained from this experiment indicated that; the best carbon source 4.2 g/L was molasses at 4% w/v while the lowest concentration was 1.88 g/L with starch (4% w/v) (Fig. 3). The best nitrogen source 4.4 g/L was yeast extract at concentration 3 g/L (Fig. 4).
Screening significant variables using Plackett-Burman design
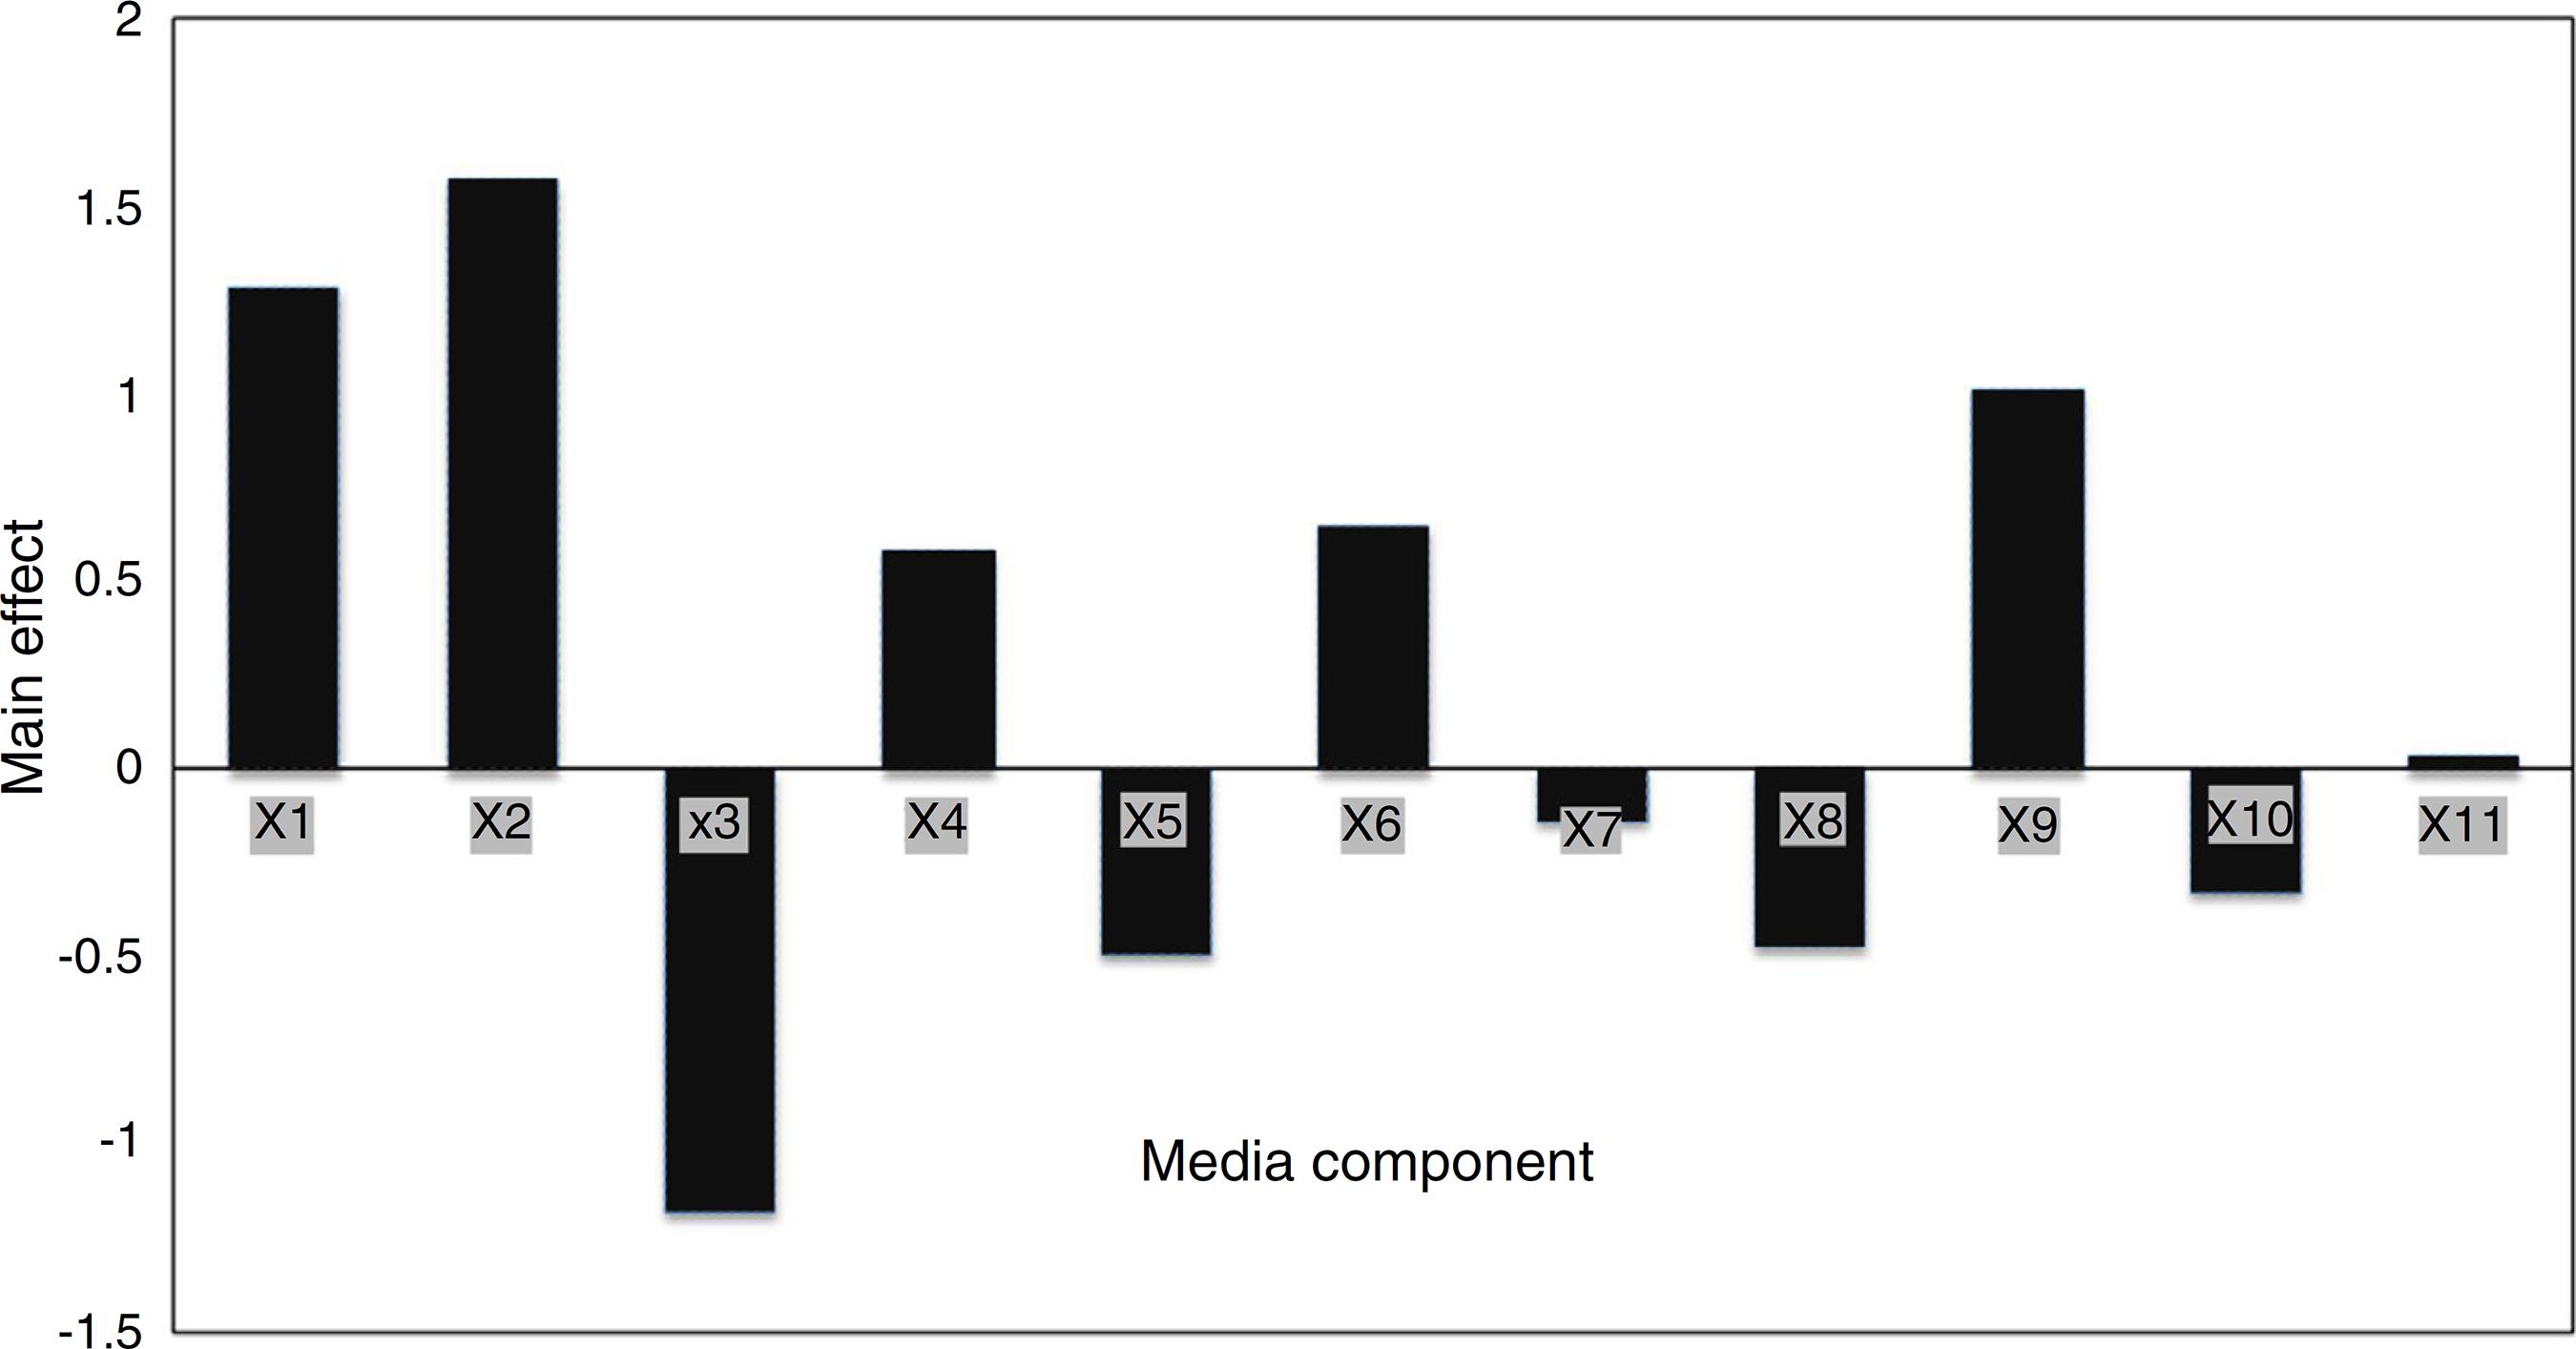
Eleven factors of media components were examined with fifty different trials, and maximum EPS production was obtained for trial number (5), while the lowest production was obtained for trial number (the regression coefficients (t value) and confidence level are given in Table 3. The media components showed both positive and negative effects on EPS production. Statistical analysis (t values) demonstrated that molasses and yeast extract and incubation temperature had significant positive influences on the EPS production with main effects of 1.57, 1.28 and 1.01 respectively (Fig. 5) whereas the media components namely KH2PO4 (X5), and MgSO4 (X3) were found to decrease the EPS production at their higher level. The ANOVA of Plackett-Burman (PB) design for EPS production is shown in Table 3 where the determinant coefficient R2 of the first-order model was 0.995 for EPS production. The significant F-values of the models were 0.0095 indicating that the models were significant.
Response surface methodology
Based on above results, three key factors yeast extract, sugarcane molasses and incubation temperature were significantly affect EPS production. These factors were selected for further analysis with Box-Behnken Design (BBD) (Table 2). The following second-order polynomial equation was:
where Y represents EPS production (g/L); 5.64 is the intercept; 0.64, 1.08 and -0.16 are the linear coefficients; 0.29, 0.35 and 0.38 are the interactive coefficients, -0.55, 0.17and 0.36 are the quadratic coefficients; and X1, X2 and X3 are the concentrations of sugarcane molasses, yeast extract and incubation temperature, respectively. The statistical significance of Eq. (3) was evaluated by F-test and ANOVA analysis (Table 4). The three-dimensional graphs that obtained from Eq. (3) were very reliable, with R2 value of 0.9401, which indicated that 99% of the variability in the response explained by this model (Fig. 6). The Model F-value of 8.72 implies the model is significant. There is only a 1.40% chance that a "Model F-Value" this large could occur due to noise. Values of "Prob > F" less than 0.0500 indicate model terms are significant. In this case, the mutual interactions between every two of the three variables were significant. By solving the inverse matrix using Expert-Design software, the optimal concentrations of molasses, yeast extract and incubation time were 12% (w/v), 6 g/L and 30 °C, respectively.
Response surface plots of three variables in medium on EPS production. (A) Interaction of molasses and yeast extract; (B) interaction of temperature and yeast extract; (C) interaction of molasses and temperature.
Molecular characterization
Based on sequence alignment results revealed that; the isolate belongs to bacillus species with maximum relation to Bacillus velezensis with 99% sequence similarities. The sequence was deposited in NCBI and assigned with accession number KY471306. The phylogenetic tree was constructed using the neighbor-joining tree making algorithm of the MEGA 4 package (Fig. 7).
Neighbor-joining tree of 16S rDNA of the local isolate 9I with respect to closely related sequences available in GenBank databases.
Purification of bacterial polysaccharide by DEAE
Ion exchange chromatography was performed for purification of the EPS by the DEAE-Cellulose column afforded 61 fractions, the first recovered polysaccharide in the nine eluting solution (fraction no. 9 to 22) that confirmed through phenol-sulphuric acid assay (Fig. 8).
Fourier transform infrared spectroscopy (FTIR)
The purified EPS polymer obtained from DEAE-cellulose column chromatography was prepared for IR analysis. The data chart (Fig. 9) shows the presence of many functional groups which are typical to bacterial EPS.
FTIR spectroscopy analysis of Bacillus velezensis polysaccharide extracted showing the transmittance trough at different wave number.
Determination of molecular weight by gel permeation chromatography (GPC)
The weight-average (Mw) and number-average (Mn) molecular weights and polydispersity (Mw/Mn) of the polysaccharide produced by B. velezensis was analyzed by GPC and found to have a weight average molecular weight (Mw) of 1.29 × 10⁵ Da, number average molecular weight (Mn) of 1.14 × 10⁵ Da and a size average molecular weight (Mz) of 1.47 × 10⁵ Da (Fig. 10). The Molecular Weight and Polydispersity Index (PDI) (Mw/Mn) of the exopolysaccharide was obtained as 1.13, which is a measure of the distribution of molecular mass in the sample.
Gas-mass chromatography (GC-MS)
Monomers from the repeating unit of the EPS produced by B. velezensis, were analyzed by GC-MS giving one major peak at 13.59 min with some minor peaks at 9.73 and at 5.36 min. The MS fragmentation patterns obtained from GC generated by each peak, were subsequently analyses it shows the characteristics of aldohexoses such as glucose, galactose and mannose in sugar alditol acetate form.2323 Ebube NK, Udeala OK, Ghobashy AA. Isolation and characterization of a novel polysaccharide from Bacillus licheniformis 11634. J Ind Microbiol. 1992;9(4):239-245. To identify each peak, the MS was generated and then compared with the available MS of different monomers. The MS fragmentation obtained for the peak at 13. 59 min. gives us fragment ions with m/z ratio of 55, 74, 87, 97, 115, 129, 157, 199, 227 and 241 (Fig. 11).
(A) Gas chromatographic of standard sugar are as follows: 1. Galactose; 2. Fucose; 3. Mannose; 4. Xylose; 5. Glucose; 6. Arabinose; 7. Mannuronic acid; 8. Glucuronic acid; 9. Galacturonic acid; 10. Mannuronic acid. (B) Gas chromatograms of extracellular polysaccharides produced by B. velezensis.
Discussion
Exopolysaccharides (EPS) was extracted from B. velezensis broth media by using ethanol to bacterial culture in ratio 2:1 respectively. The first screening of different bacterial isolates for selection of most potent EPS producing strain, the maximum productivity obtained was 3 g/L from isolate 9I (55). This result is agreed with that obtained by Reshetnikov et al.2424 Reshetnikov SV, Asser SP, Tan KK. Higher basidiomycetes as source of antitumer and immunostimulating polysaccharide (review). Int J Med Mushrooms. 2001;3:361-394. according to different growth conditions used in this study, EPS production by B. velezensis increased during the stationary phase of growth (after 32 h) and still constant until 80 h of incubation, This was probably because of the action of glycohydrolases possibly produced in the culture that catalyzed the degradation of polysaccharides, resulting in decreased EPS yields after stationary phase.2525 Pham L, Dupont I, Roy D, Lapointe G. Production of exopolysaccharide by Lactobacillus rhamnosus R and analysis of its enzymatic degradation during prolonged fermentation. Appl Environ Microbiol. 2000;(6):2302-2310. These results indicated that the maximum productivity of EPS reached post stationary phase of growth. This result is similar to that obtained by Roberson and Firestone.2626 Roberson EB, Firestone MK. Relationship between desiccation and exopolysaccharide production in a soil Pseudomonas sp.. Appl Environ Microbiol. 1992;58(4):1284-1291.
The experiment of single factor optimization was designed to identify the key variables which can affect EPS production keeping other factors constant.2727 Ismail B, Nampoothiri KM. Production, purification and structural characterization of an exopolysaccharide produced by a probiotic Lactobacillus plantarum MTCC 9510. Arch Microbiol. 2010;192(12):1049-1057. The result obtained from this experiment indicated that; EPS production was significantly affected by the type of carbon source and concentration in the medium. Molasses was most effective and economically for large scale production of EPS among the carbon sources. Carbon and nitrogen sources are well known factors that affect the cellular metabolism and EPS production.2828 Wang J, Zhao X, Tian Z, He C, Yang Y, Yang Z. Isolation and characterization of exopolysaccharide-producing Lactobacillus plantarum SKT109 from Tibet Kefir. Polish J Food Nutr Sci. 2015;4(65):269-280. The present study was carried out to study the influence of various parameters on elevation of EPS yield. One factor at a time, although difficult and labor intensive method, this experiment supported in selecting the center points for the optimization study using RSM. This method of using single variables is disadvantageous as the interactive effects between two factors cannot be studied.
Data obtained from single factor optimization was followed by Plackett-Burman design for screening of significant variables that depend on multi-variables at a time.2929 Luthra U, Singh N, Tripathi A, Vora S, Bhosle V. Media optimization for lovastatin production by statistical approach using Aspergillus terreus by submerged fermentation. J Med Sci Clin Res. 2015;2(3):4520-4528. Data analysis obtained from this model indicted the use of yeast extract as nitrogen source and sugarcane molasses during production of polysaccharides by isolate code (9I). Moreover, yeast extract could provide growth factors such as vitamins and amino acids that support much bacterial growth.2828 Wang J, Zhao X, Tian Z, He C, Yang Y, Yang Z. Isolation and characterization of exopolysaccharide-producing Lactobacillus plantarum SKT109 from Tibet Kefir. Polish J Food Nutr Sci. 2015;4(65):269-280.
With the same consequence; RSM depend on data obtained from Plackett-Burman and the data analysis indicated that the maximum yield was estimated to be 7.68 g/L, and the actual yield obtained with the optimal medium was 7.88 g/L (the average value of triple experiments), which was in close accordance with the model prediction. In addition, the sole carbon source was used in the fermentation medium for maximum EPS production, which would be advantage to reduce production cost and operation process of EPS.3030 Lee IY, Seo WT, Kim GJ, Kim MK, Park CS, Park YH. Production of curdlan using sucrose or sugar cane molasses by two-step fed-batch cultivation of Agrobacterium species. J Ind Microbiol Biotechnol. 1997;18(4):255-259.
IR analysis for purified EPS showed a characteristic absorption band appeared at 1654.11 cm-1 (Fig. 9) and was assigned to the stretching vibration of carbonyl group (C - O) in a accordance with Grigorii et al.3131 Grigorii K, Matulova M, Michalkova E. Extracellular polysaccharide of Penicillium vermiculatum. Z Natur C. 2010;57:452-458.
Another absorption band at 2941.03 cm-1 was intensified and assigned to the stretching vibration of methylene group ( - CH2 - ), usually present in hexoses, like glucose or galactose or deoxyhexoses like rhamnose or fucose. Absorption peak at 1063.57 cm-1 was assigned to carbohydrate C - O stretching vibrations and dominated by glycosidic linkage - (C - O - C) - stretching vibration. This also agree with He et al.3232 He Y, Liu C, Chen Y, et al. Isolation and structural characterization of a novel polysaccharide prepared from Arca subcrenata Lischke. J Biosci Bioeng. 2007;104(2):111-116.
Absorption peak around 1540 cm-1 corresponding to an amino group was also observe in the spectrum of EPS and a weak symmetrical stretching peak near 1447-1380 cm-1, suggests the presence of carboxyl groups.). The carbohydrates show high absorbencies in the region 1200-950 cm-1, that is within the so-called fingerprint region, where the position and intensity of the bands are specific for every polysaccharide, allowing it possible identification. These results are harmony with Sun et al.3333 Sun Y, Wang S, Li T, Li X, Jiao L, Zhang L. Purification, structure and immunobiological activity of a new water-soluble polysaccharide from the mycelium of Polyporus albicans Teng. Bioresour Technol. 2008;99(4):900-904.
Based on the result of GC-mass analysis, it was concluded that the major monosaccharide for purified EPS obtained from Bacillus. velezensis KY498625 revealed that glucose, galactose and mannose. Couso et al.3434 Couso RO, Ielpi L, Dankert MA. A Xanthan gum-like polysaccharide from Acetobacter xylinum. J Gen Microbiol. 1987;133(8):2123-2135. reported that G. hansenii LMG1524 produce EPS that contains glucose, mannose that agreed with our EPS.
Conclusion
Two statistical experimental design Plackett-Burman and Box-Behnken were used to improve Exopolysaccharide production from Bacillus. velezensis KY498625. The production of EPS under optimal conditions obtained from data analysis succeeded to increase productivity from 4.1 to 7.6 g/L compared to the initial EPS production. Industrial production of EPS requires cost effective and optimal culture medium. The purified EPS has molecular weight 1.29 × 10⁵ Da with number average molecular weight (Mn) 1.14 × 10⁵ Da that consists mainly of glucose, mannose and galactose.
References
-
1Ates O. Systems biology of microbial exopolysaccharide production. Front Bioeng Biotechnol. 2015;(3):200.
-
2Freitas F, Alves VD, Reis MA, Crespo JG, Coelhoso IM. Microbial polysaccharide-based membranes: current and future applications. J Appl Polym Sci. 2014;(6):131.
-
3Freitas F, Alves VD, Pais J, et al. Production of a new exopolysaccharide (EPS) by Pseudomonas oleovorans NRRL grown on glycerol. Process Biochem. 2010;(45):297-305.
-
4Wang CL, Chen CJ, Nguyen AD, et al. Environmental chitinous materials as adsorbents for one-step purification of protease and chitosanase. Res Chem Intermed. 2014;(40):2363-2369.
-
5Alsharabasy AM, Moghannem SA, El-Mazny WN. Physical preparation of alginate/chitosan polyelectrolyte complexes for biomedical applications. J Biomater Appl. 2015;30(7):1071-1079.
-
6Khopade A, Ren B, Liu X, Mahadik K, Zhang L, Kokare C. Production and characterization of biosurfactant from marine Streptomyces species B3. J Colloid Interface Sci. 2012;367:311-318.
-
7Staudt AK, Wolfe LG, Shrout JD. Variations in exopolysaccharide production by Rhizobium tropici. Arch Microbiol. 2012;194(3):197-206.
-
8Suresh Kumar A, Mody K, Jha B. Bacterial exopolysaccharides - a perception. J Basic Microbiol. 2007;47(2):103-117.
-
9Khuri AI, Mukhopadhyay S. Response surface methodology. WIREs Comp Stat 2010;2(2):128-149.
-
10Pacwa-Płociniczak M, Płaza GA, Piotrowska-Seget Z, Cameotra SS. Environmental applications of biosurfactants. Recent advances. Int J Mol Sci. 2011;12(1):633-654.
-
11Razack SA, Velayutham V, Thangavelu V. Medium optimization for the production of exopolysaccharide by Bacillus subtilis using synthetic sources and agro wastes. Turk J Biol. 2013;37(3):280-288.
-
12Ruas-Madiedo P, De Los Reyes-Gavilán CG. Invited review: methods for the screening, isolation, and characterization of exopolysaccharides produced by lactic acid bacteria. J Dairy Sci. 2005;88(3):843-856.
-
13Dubois M, Gilles KA, Hamilton JK, Rebers P, Smith F. Colorimetric method for determination of sugars and related substances. Anal Chem. 1956;28(3):350-356.
-
14Fuscon R, Godinho MJL, Bossola NRS. Culture and exopolysaccharide production from sugarcane molasses by Gordonia polyisoprenivorans CCT 7137, isolated from contaminated groundwater in Brazil. World J Microbiol Biotechnol. 2008;24(7):937-943.
-
15Prasanna PHP, Grandison AS, Charalampopoulos D. Bifidobacteria in milk products: an overview of physiological and biochemical properties, exopolysaccharide production, selection criteria of milk products and health benefits. Food Res Int. 2014;55:247-262.
-
16Chen HQ, Chen XM, Chen TX, Xu XM, Jin ZY. Optimization of solid-state medium for the production of inulinase by Aspergillus ficuum JNSP5-06 using response surface methodology. Carbohydr Polym. 2011;86(1):249-254.
-
17Plackett RL, Burman JP. The design of optimum multifactorial experiments. Biometrika 1946;33(4):305-325.
-
18Khani M, Bahrami A, Ghafari MD. Optimization of operating parameters for anti-corrosive biopolymer production by Chryseobacterium Indologenes MUT 2 using central composite design methodology. J Taiwan Inst Chem Eng. 2015;59:165-172.
-
19Ferreira SC, Bruns RE, Ferreira HS, et al. Box-Behnken design. An alternative for the optimization of analytical methods. Anal Chim Acta. 2007;597:179-186.
-
20Rahman MBA, Chaibakhsh N, Basri M, Salleh AB, Radzi SM. Modeling and optimization of lipase-catalyzed synthesis of dilauryl adipate ester by response surface methodology. J Chem Technol Biotechnol. 2008;83:1534-1540.
-
21Peterson EA, Sober HA. Column chromatography of proteins: substituted celluloses. Methods Enzymol. 1962;5:3-27.
-
22Seviour T, Lambert LK, Pijuan M, Yuan Z. Structural determination of a key EPS in mixed culture aerobic sludge granules using NMR spectroscopy. Environ Sci Technol. 2010;44(23):8964-8970.
-
23Ebube NK, Udeala OK, Ghobashy AA. Isolation and characterization of a novel polysaccharide from Bacillus licheniformis 11634. J Ind Microbiol. 1992;9(4):239-245.
-
24Reshetnikov SV, Asser SP, Tan KK. Higher basidiomycetes as source of antitumer and immunostimulating polysaccharide (review). Int J Med Mushrooms. 2001;3:361-394.
-
25Pham L, Dupont I, Roy D, Lapointe G. Production of exopolysaccharide by Lactobacillus rhamnosus R and analysis of its enzymatic degradation during prolonged fermentation. Appl Environ Microbiol. 2000;(6):2302-2310.
-
26Roberson EB, Firestone MK. Relationship between desiccation and exopolysaccharide production in a soil Pseudomonas sp.. Appl Environ Microbiol. 1992;58(4):1284-1291.
-
27Ismail B, Nampoothiri KM. Production, purification and structural characterization of an exopolysaccharide produced by a probiotic Lactobacillus plantarum MTCC 9510. Arch Microbiol. 2010;192(12):1049-1057.
-
28Wang J, Zhao X, Tian Z, He C, Yang Y, Yang Z. Isolation and characterization of exopolysaccharide-producing Lactobacillus plantarum SKT109 from Tibet Kefir. Polish J Food Nutr Sci. 2015;4(65):269-280.
-
29Luthra U, Singh N, Tripathi A, Vora S, Bhosle V. Media optimization for lovastatin production by statistical approach using Aspergillus terreus by submerged fermentation. J Med Sci Clin Res. 2015;2(3):4520-4528.
-
30Lee IY, Seo WT, Kim GJ, Kim MK, Park CS, Park YH. Production of curdlan using sucrose or sugar cane molasses by two-step fed-batch cultivation of Agrobacterium species. J Ind Microbiol Biotechnol. 1997;18(4):255-259.
-
31Grigorii K, Matulova M, Michalkova E. Extracellular polysaccharide of Penicillium vermiculatum. Z Natur C. 2010;57:452-458.
-
32He Y, Liu C, Chen Y, et al. Isolation and structural characterization of a novel polysaccharide prepared from Arca subcrenata Lischke. J Biosci Bioeng. 2007;104(2):111-116.
-
33Sun Y, Wang S, Li T, Li X, Jiao L, Zhang L. Purification, structure and immunobiological activity of a new water-soluble polysaccharide from the mycelium of Polyporus albicans Teng. Bioresour Technol. 2008;99(4):900-904.
-
34Couso RO, Ielpi L, Dankert MA. A Xanthan gum-like polysaccharide from Acetobacter xylinum. J Gen Microbiol. 1987;133(8):2123-2135.
Edited by
Publication Dates
-
Publication in this collection
Jul-Sep 2018
History
-
Received
14 July 2016 -
Accepted
9 May 2017