ABSTRACT
Anaerobic digestion is important for the management of livestock manure with high ammonia level. Although ammonia effects on anaerobic digestion have been comprehensively studied, the molecular mechanism underlying ammonia inhibition still remains elusive. In this study, based on metatranscriptomic analysis, the transcriptional profile of microbial community in anaerobic digestion under low (1500 mg L-1) and high NH4 + (5000 mg L-1) concentrations, respectively, were revealed. The results showed that high NH4 + concentrations significantly inhibited methane production but facilitated the accumulations of volatile fatty acids. The expression of methanogenic pathway was significantly inhibited by high NH4 + concentration but most of the other pathways were not significantly affected. Furthermore, the expressions of methanogenic genes which encode acetyl-CoA decarbonylase and methyl-coenzyme M reductase were significantly inhibited by high NH4 + concentration. The inhibition of the co-expressions of the genes which encode acetyl-CoA decarbonylase was observed. Some genes involved in the pathways of aminoacyl-tRNA biosynthesis and ribosome were highly expressed under high NH4 + concentration. Consequently, the ammonia inhibition on anaerobic digestion mainly focused on methanogenic process by suppressing the expressions of genes which encode acetyl-CoA decarbonylase and methyl-coenzyme M reductase. This study improved the accuracy and depth of understanding ammonia inhibition on anaerobic digestion.
Keywords:
Anaerobic digestion; Ammonia; Pathway; Gene expression; Methanogenesis
Introduction
Anaerobic digestion (AD) is a promising technology in the field of waste treatment and renewable energy production. Livestock manure has been processed increasingly by AD to reduce pathogens and to generate bioenergy such as methane.11 Lin Q, De Vrieze J, He G, Li X, Li J. Temperature regulates methane production through the function centralization of microbial community in anaerobic digestion. Bioresour Technol. 2016;216:150-158.,22 Sun W, Qian X, Gu J, Wang XJ, Zhang L, Guo AY. Mechanisms and effects of arsanilic acid on antibiotic resistance genes and microbial communities during pig manure digestion. Bioresour Technol. 2017;234:217-223. Thus, the improvement of stability and efficiency of AD is crucial for the comprehensive application of this technology. Ammonia concentration is one of crucial factors regulating AD stability.33 Rajagopal R, Masse DI, Singh G. A critical review on inhibition of anaerobic digestion process by excess ammonia. Bioresour Technol. 2013;143:632-641. Optimal ammonia concentrations provide sufficient buffer capacity and nutrient for microbial growth, which improves the AD stability and efficiency. However, low or excessive ammonia concentrations usually result in the failure of AD. It is reported that low ammonia concentration (<500 mg L-1) decreases methane production, biomass and the aceticlastic methanogenic activity.44 Prochazka J, Dolejs P, Maca J, Dohanyos M. Stability and inhibition of anaerobic processes caused by insufficiency or excess of ammonia nitrogen. Appl Microbiol Biotechnol. 2012;93:439-447. The high ammonia (>4000 mg L-1) results in the inhibition of microbial activity and accumulation of volatile fatty acids, which finally causes decreased stability and even failure of AD.33 Rajagopal R, Masse DI, Singh G. A critical review on inhibition of anaerobic digestion process by excess ammonia. Bioresour Technol. 2013;143:632-641.–66 Zhang M, Lin Q, Rui J, Li J, Li X. Ammonium inhibition through the decoupling of acidification process and methanogenesis in anaerobic digester revealed by high throughput sequencing. Biotechnol Lett. 2016;:1-6. Due to high protein content in manure, there are usually high ammonia concentrations in the AD of manure.33 Rajagopal R, Masse DI, Singh G. A critical review on inhibition of anaerobic digestion process by excess ammonia. Bioresour Technol. 2013;143:632-641. Thus, AD of livestock manure has to confront the inhibition from high ammonia. It is necessary to reveal the mechanisms underlying ammonia inhibition on the AD process.
Temperature is considered as a prominent factor regulating ammonia toxicity on AD process.33 Rajagopal R, Masse DI, Singh G. A critical review on inhibition of anaerobic digestion process by excess ammonia. Bioresour Technol. 2013;143:632-641.,77 Hejnfelt A, Angelidaki I. Anaerobic digestion of slaughterhouse by-products. Biomass Bioenergy. 2009;33:1046-1054.,88 Kayhanian M. Ammonia inhibition in high-solids biogasification: an overview and practical solutions. Environ Technol. 1999;20:355-365. The thermophilic temperatures compared to mesophilic temperatures usually cause higher ammonia toxicity.77 Hejnfelt A, Angelidaki I. Anaerobic digestion of slaughterhouse by-products. Biomass Bioenergy. 2009;33:1046-1054.,88 Kayhanian M. Ammonia inhibition in high-solids biogasification: an overview and practical solutions. Environ Technol. 1999;20:355-365. The thermophilic temperatures enhance metabolic activities of microorganisms, which strengthens hydrolysis of substrates including proteins. This process increases ammonia concentration in the slurry, so that ammonia toxicity is undoubtedly strengthened. Thus, under mesophilic temperatures, the ammonia toxicity more depended on the initial ammonia concentration, which facilitates the understanding of the relationship between ammonia concentration and ammonia toxicity. Different methanogens are distinguishably sensitive to ammonia concentrations, which partly determines ammonia toxicity on AD process. Due to spherical Methanosarcina with higher ratio of volume/surface than that of rod-shaped Methanosaeta, the diffusion of ammonia is less into the Methanosarcina than Methanosaeta,99 Wiegant W, Zeeman G. The mechanism of ammonia inhibition in the thermophilic digestion of livestock wastes. Agric Wastes. 1986;16:243-253. which results in their different sensitivities to ammonia concentrations. Thus, high ammonia more probably causes failure of AD where Methanosaeta are dominated in the methanogens than that where Methanosarcina are dominated. The recovery of AD from failure depends on a reconstruction of methanogenic species,1010 Karakashev D, Batstone DJ, Angelidaki I. Influence of environmental conditions on methanogenic compositions in anaerobic biogas reactors. Appl Environ Microb. 2005;71:331-338. so that Methanosarcina as dominated methanogens replace Methanosaeta. This process probably causes the decrease of acetoclastic methanogenesis.1111 Schnurer A, Nordberg A. Ammonia, a selective agent for methane production by syntrophic acetate oxidation at mesophilic temperature. Water Sci Technol. 2008;57:735-740. These studies of ammonia toxicity on AD process mainly focus on methanogens and methanogenic process.33 Rajagopal R, Masse DI, Singh G. A critical review on inhibition of anaerobic digestion process by excess ammonia. Bioresour Technol. 2013;143:632-641.,55 Chen Y, Cheng JJ, Creamer KS. Inhibition of anaerobic digestion process: a review. Bioresour Technol. 2008;99:4044-4064.,66 Zhang M, Lin Q, Rui J, Li J, Li X. Ammonium inhibition through the decoupling of acidification process and methanogenesis in anaerobic digester revealed by high throughput sequencing. Biotechnol Lett. 2016;:1-6.,1212 Gallert C, Bauer S, Winter J. Effect of ammonia on the anaerobic degradation of protein by a mesophilic and thermophilic biowaste population. Appl Microbiol Biotechnol. 1998;50:495-501.,1313 Ibba M, Soll D. Aminoacyl-tRNA synthesis. Annu Rev Biochem. 2000;69:617-650.
Although the ammonia toxicity on AD process has been comprehensively revealed mainly based on methanogenic microflora,33 Rajagopal R, Masse DI, Singh G. A critical review on inhibition of anaerobic digestion process by excess ammonia. Bioresour Technol. 2013;143:632-641.,55 Chen Y, Cheng JJ, Creamer KS. Inhibition of anaerobic digestion process: a review. Bioresour Technol. 2008;99:4044-4064.,1212 Gallert C, Bauer S, Winter J. Effect of ammonia on the anaerobic degradation of protein by a mesophilic and thermophilic biowaste population. Appl Microbiol Biotechnol. 1998;50:495-501.–1414 Ho L, Ho G. Mitigating ammonia inhibition of thermophilic anaerobic treatment of digested piggery wastewater: use of pH reduction, zeolite, biomass and humic acid. Water Res. 2012;46:4339-4350. the transcriptional profiles of specific pathways and genes in response to ammonia have rarely been discussed. The AD process consists of AD food web (hydrolysis, acidogenesis, acetogenesis and methanogenesis), so besides methanogenesis, the other three steps of the food web also play important roles in final methane production. Thus, the transcriptional profiles of methanogenesis-related processes are necessary to be revealed based on metatranscriptomic analysis, which can provide a new sight underlying ammonia toxicity on AD process.
In this study, based on metatranscriptomic analysis, the transcriptional profiles of microbial community in response to low and high NH4+ concentrations, respectively, were revealed in AD. Specifically, we focused on the expressions of pathways and genes responsible for methane production under different NH4+ concentrations to further reveal the mechanism underlying ammonia toxicity on AD process.
Materials and methods
Setup of AD system
The AD experiment of swine manure was conducted with working volume of 2.5 L digestion sludge containing 0.75 L initial inoculum, and the total solid content was 7% (Supplement Table S1). The high ammonia treatment with NH4+ (5000 mg L-1) (HN) and low ammonia treatment with NH4+ (1500 mg L-1) (LN) were determined by adding NH4Cl at the beginning of AD, which was mainly based on previous report66 Zhang M, Lin Q, Rui J, Li J, Li X. Ammonium inhibition through the decoupling of acidification process and methanogenesis in anaerobic digester revealed by high throughput sequencing. Biotechnol Lett. 2016;:1-6. and pre-experiments. All the treatments were conducted in triplicate at 37 ºC. Seed slurry was prepared by anaerobic digestion of swine manure (obtained from a pig farm in Neijiang, Sichuan Province, China) at 37 ºC, for one hydraulic retention time (HRT). After methane production reached the first peak (6th day) in the reactor, we performed a semi-continuous feeding mode that 500 mL of digestate was exchanged every three days with HRT of 15 days and organic loading rate of 4.5 g VS (volatile solid) L-1 day-1. The anaerobic digestion was performed for two HRT. The feeding slurry was adjusted to the corresponding NH4+ concentration using NH4Cl. Details about parameters at the start of fermentation were shown in Supplement Table S1.
Sampling and analysis
At each feeding, methane content in biogas, volatile fatty acids (VFA), NH4 + and pH were measured to monitor AD dynamic. The methane content in biogas was measured using an Agilent 6890 gas chromatography system (Agilent Technologies, USA), equipped with a thermal conductivity detector and carrier gas of argon. The injection port, column oven, and detector were operated at 100, 70, and 150 ºC, respectively. The daily volume of biogas was detected by water replacement method. The VFA in the slurry was detected using Agilent 1260 Infinity liquid chromatography (Agilent Technologies, USA), equipped with a differential refraction detector (RID) and mobile phase of H2SO4 (0.005 M). Total solid and volatile solid were measured based on previous report.1515 APHA. Standard Methods for the Examination of Water and Wastewater. Washington, DC: American Public Health Association; 1998. NH4 + concentration was quantified with Nessler's reagent colorimetric method.1616 Hart SC, Stark JM, Davidson EA, Firestone MK. Nitrogen mineralization, immobilization, and nitrification. Soil Sci Soc Am J. 1994;44:985-1018. At the end of the second HRT, the digestate were sampled in triplicate for total RNA extraction with the RNeasy PowerMicrobiome Kit (Cat. No. 26000-50; MO BIO, USA). The quality of RNA was checked with a NanoDrop 2000 spectrophotometer (Thermo, USA). Ribosomal RNA was removed from the total RNA with the RiboMinusTM kit (Lot. No. 1539791; Invitrogen, USA). The metatranscriptomic (mRNA) sequencing was performed using an Illumina Hiseq 2000 (Illumina Inc., USA). The sequencing raw data from total 6 samples were uploaded to MG-RAST with assigned MG-RAST ID (mgs589946, mgs589949, mgs589952, mgs589955, mgs589958 and mgs589961) for further analysis.1717 Meyer F, Paarmann D, D'Souza M, et al. The metagenomics RAST server – a public resource for the automatic phylogenetic and functional analysis of metagenomes. BMC Bioinformatics. 2008;9:1-8. Prior to the analysis, the quality control pipeline in MG-RAST1717 Meyer F, Paarmann D, D'Souza M, et al. The metagenomics RAST server – a public resource for the automatic phylogenetic and functional analysis of metagenomes. BMC Bioinformatics. 2008;9:1-8. was performed to remove poor quality sequences. The annotation of functional profiles was based on the KEGG Orthologs database including 4 levels. The functional categories was presented as level 2. Level 3 reflected the KEGG pathways, and level 4 (gene expression level) showed expressions of specific genes.1818 Yu K, Zhang T. Metagenomic and metatranscriptomic analysis of microbial community structure and gene expression of activated sludge. PLoS ONE. 2012;7:e38183. During annotation analysis, the pipeline parameters were kept at default settings.
Statistical analysis
The ammonia effect on the general changes of gene expressions was assessed by principal coordinates analysis (PCoA) in R (http://www.r-project.org/), based on the Bray–Curtis dissimilarity index, using the vegan package. The normality and homoscedasticity of the raw data, and one way analysis of variance (ANOVA) were performed in SPSS 21 software (IBM USA). Spearman's correlation analysis, enrichment analysis and redundancy analysis (RDA) were calculated in R with the vegan package. The Spearman's p value was adjusted using the Benjamini and Hochberg methods.1919 Benjamini Y, Hochberg Y. Controlling the false discovery rate: a practical and powerful approach to multiple testing. J R Stat Soc B. 1995;57:289-300. The taxa with average relative abundance >0.1% and significantly different expression (p < 0.05) between HN and LN were selected for network analysis to reveal co-response to ammonia. If the correlation p value was <0.05, the correlation between two taxa was considered statistically robust and shown in the network. The network was visualized in Cytoscape software.2020 Shannon P, Markiel A, Ozier O, et al. Cytoscape: a software environment for integrated models of biomolecular interaction networks. Genome Res. 2003;13:2498-2504.
Results
Anaerobic digestion and global expressions of genes
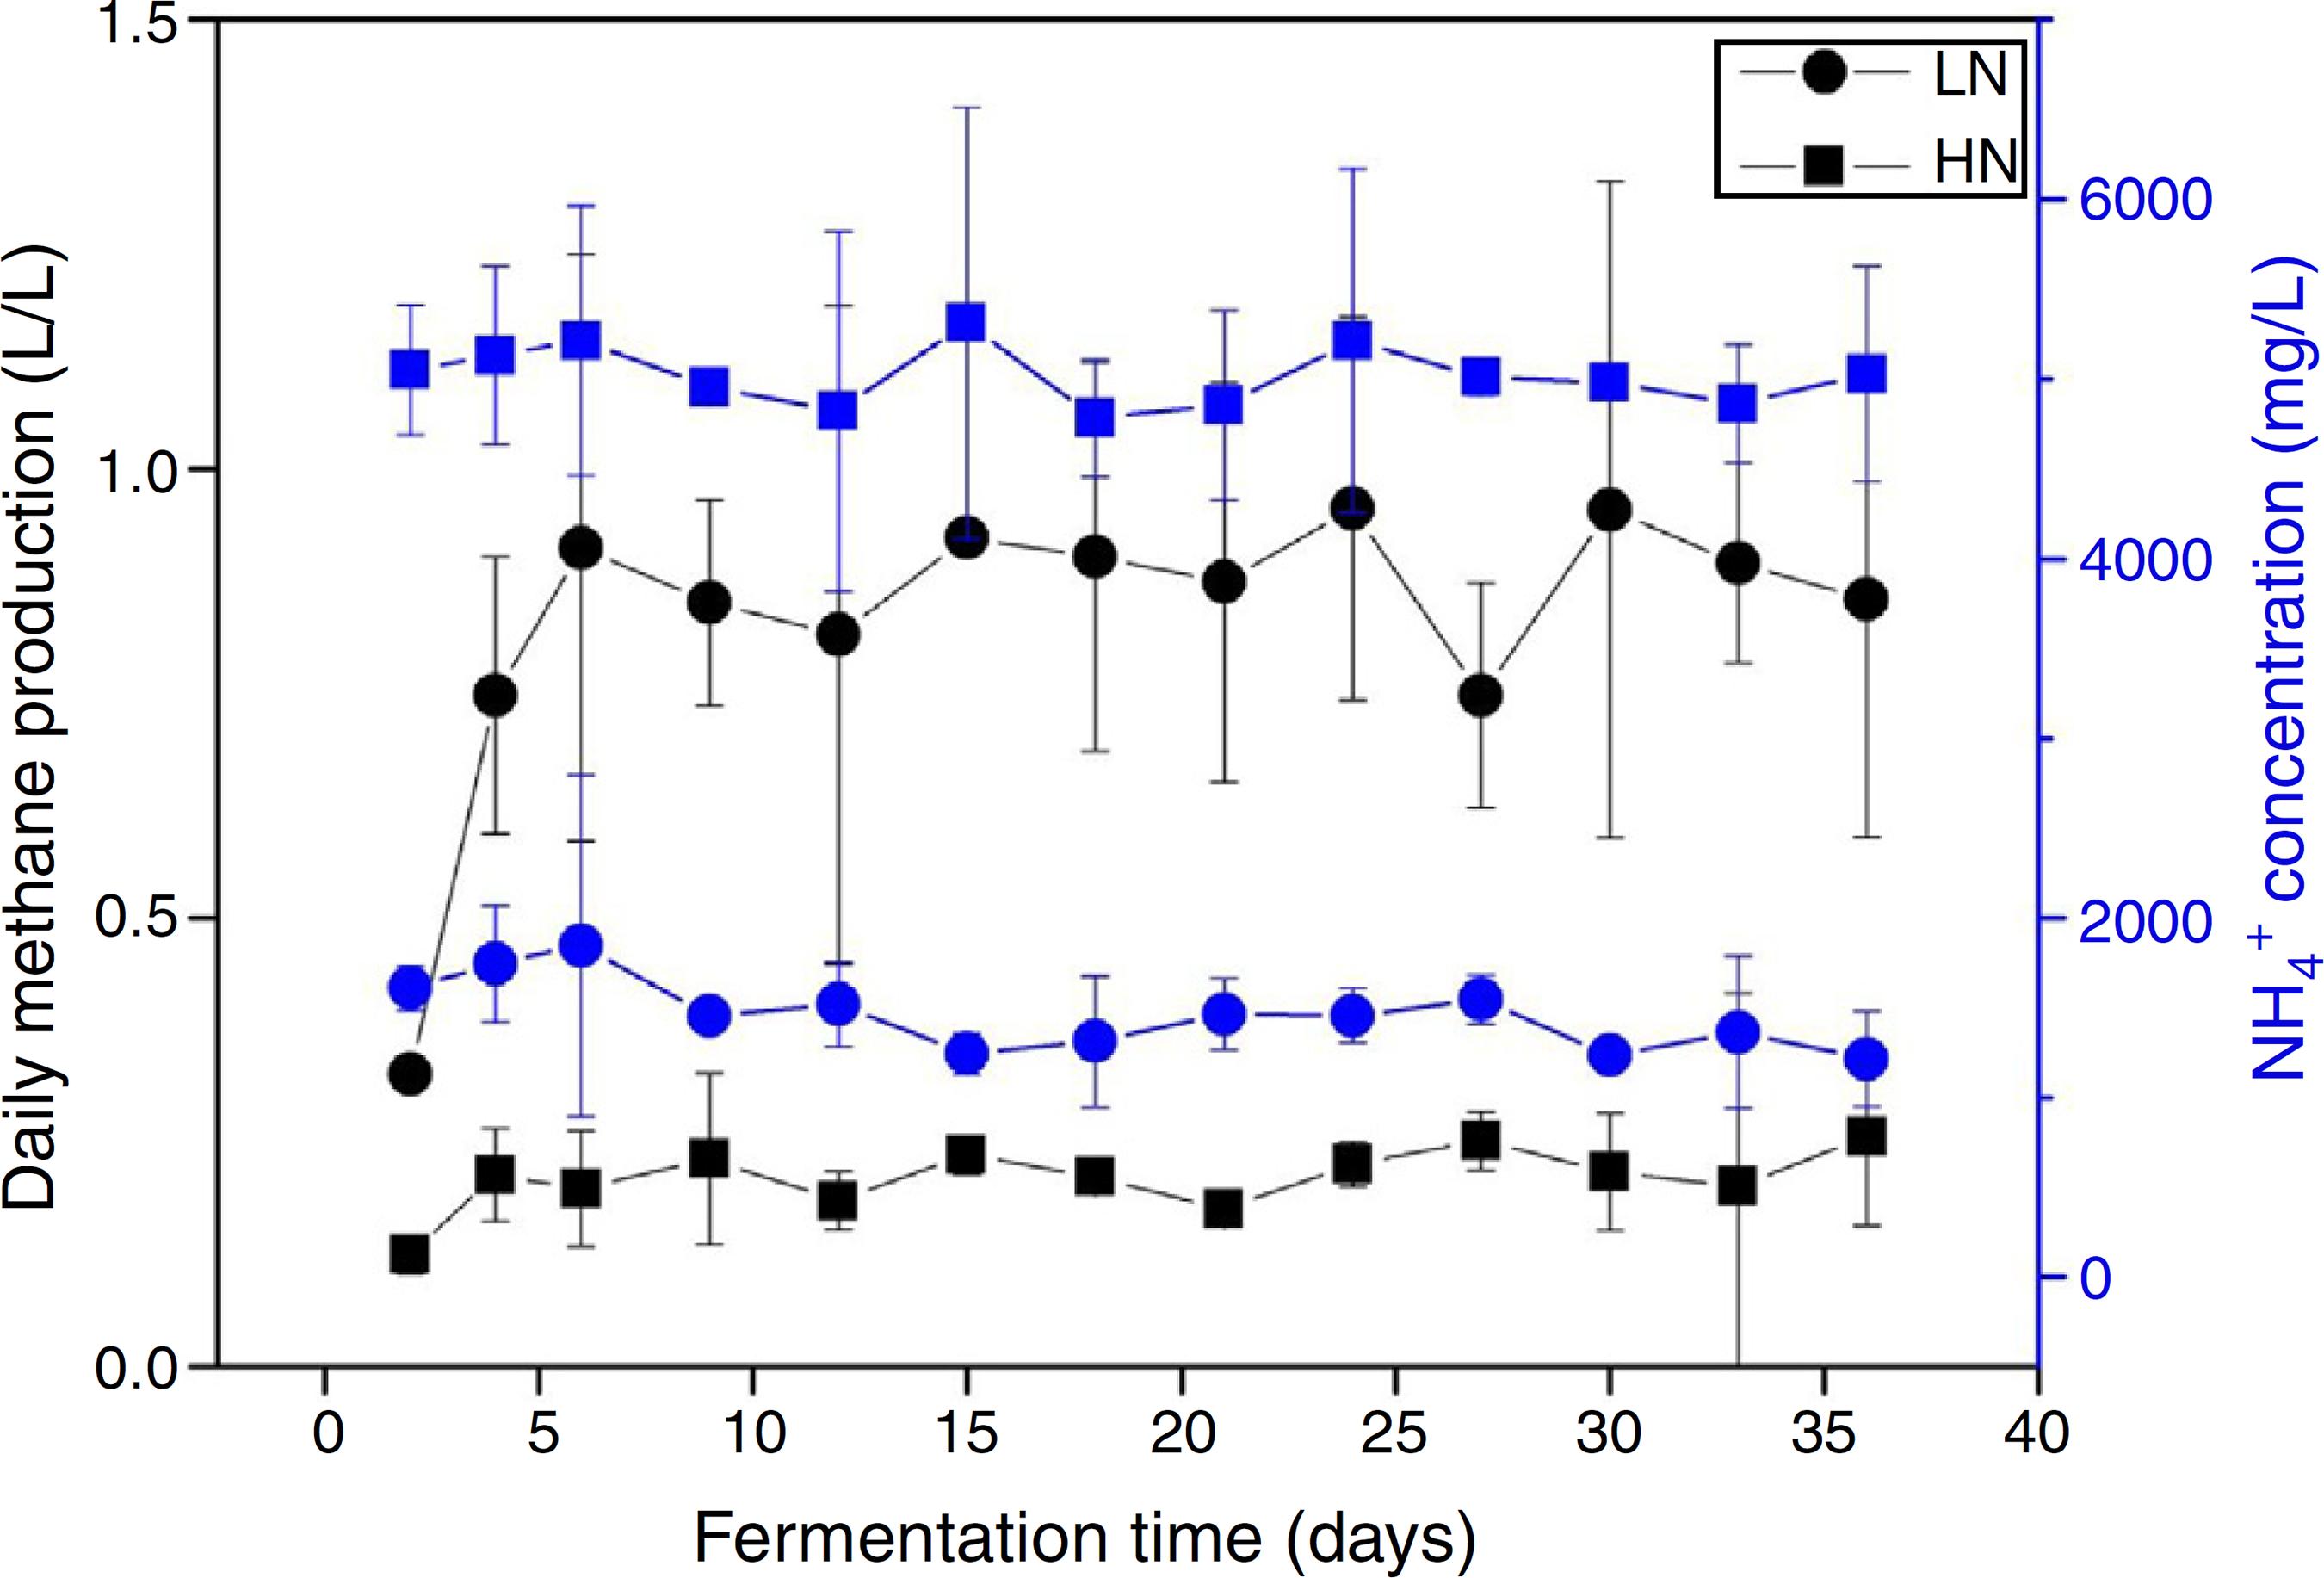
There were significant differences of AD performances between LN and HN (Fig. 1 and Supplement Table S1). Methane production and content in the biogas were higher in LN than that in HN (p < 0.01). The concentrations of acetic acid and propionic acid, and pH were higher in HN. It showed that high NH4+ concentration inhibited methane production and resulted in some accumulations of VFA. The global expressions of genes showed obvious differences between HN and LN (Fig. 2), which well corresponded with the significant differences of performances of AD. Compared with HN, the replicates in LN clustered more closely (Fig. 2), which implied that high NH4+ probably caused more randomness of gene expressions in AD.
Fermentation performance under high (HN) and low (LN) NH4 + concentrations. All the data are presented as means ± standard deviations (n = 3).
The principal coordinates analysis (PCoA) of global expressions of genes in anaerobic digestions with high NH4 + (HN) and low NH4 + (LN).
Differentiated expressions of metabolic pathways
In the comparison between HN and LN based on pathways (level 2), most expressions of these pathways were higher in HN, but only signal transduction was significantly higher at HN (p < 0.05) (Fig. 3). Surprisingly, only energy metabolism was higher in LN (p < 0.01). At level 3, most expressions of pathways were not significantly distinguishable between HN and LN (Table 1). The pathway of methane metabolism (ko00680) (usually indicating the methanogenesis in anaerobic digestion) has a higher expression in LN (p < 0.01), but the pathways of RNA polymerase (ko03020) and Valine, leucine and isoleucine degradation (ko00280) had higher expressions in HN (p < 0.05) (Table 1). The relative abundances of arginine and proline metabolism (ko00330) and methane metabolism showed positive correlations with daily methane production (p < 0.05), but those of RNA polymerase and cell cycle-caulobacter (ko04112) showed negative correlations with methane production (p < 0.05) (Table 1).
Expression profiles of level 2 at high NH4 + (HN) and low NH4 + (LN). ** significant at p < 0.01; * Significant at p < 0.05.
In redundancy analysis (RDA) of the relationship between the expressions of pathways (level 3) and the environmental variables (Fig. 4A), the expressions of the pathways including methane metabolism, arginine and proline metabolism, pentose phosphate pathway (ko00030), histidine metabolism (ko00340), oxidative phosphorylation (ko00190) and pyruvate metabolism (ko00620) positively correlated with methane production. The expressions of RNA degradation (ko030180), pentose and glucuronate interconversions (ko00040) and Citrate cycle (ko00020) positively correlated with acetic acid and pH. The expressions of DNA replication (ko03030) and peroxisome (ko04146) potentially contributed to propionic acid accumulation.
Redundancy analysis (RDA) of key pathway (a) and gene (b) expressions where the methanogenic genes mainly encoding acetyl-CoA decarbonylase and methyl-coenzyme M reductase positively contribute to methane production but are omitted to simplify the figure to be clearer.
Gene differentiated expressions
Besides the overall difference of gene expressions (Fig. 2), the enrichment analysis was applied to further uncover differentiated expressions of individual genes between HN and LN. Probably attributed to significant difference of the expression of methane metabolism (Table 1), most of these genes with significant differentiated expressions (p < 0.05) were involved in methane metabolism (Supplementary Table S2). These methanogenic genes mainly encode acetyl-CoA decarbonylase and methyl-coenzyme M reductase. Additionally, most of methanogenic genes showed significant positive correlations with methane production (p < 0.05) (Supplementary Table S2). Besides methanogenic genes, two genes involved in the pathway of pyruvate metabolism showed higher expressions in LN, but three and two genes involved in aminoacyl-tRNA biosynthesis (ko00970) and ribosome (ko03010), respectively, showed higher expressions in HN (Supplementary Table S2). In the RDA of the relationship between gene expressions and environmental variables (Fig. 4B), it indicated that besides the methanogenic genes, the genes which encode glycerol kinase, phosphate acetyltransferase, transporting ATPase and pyruvate_orthophosphate dikinase positively contributed to methane production. The genes which encode ribosomal subunits, tRNA_synthetase and phosphoribosylamine_glycine ligase positively contributed to pH and acetic acid.
Although there were 19 genes (each taxon with average relative abundance > 0.1%) significantly distinguishingly expressed between LN and HN (Supplementary Table S2), the co-expressions of these genes should be further verified. Based on Spearman’ correlations, the co-expressions of these genes to different NH4+ concentrations were further revealed (Fig. 5 and Supplementary Table S3). The expressions of the genes involved in methane metabolism, glycerolipid metabolism, pyruvate metabolism and oxidative phosphorylation showed a co-inhibition under the high ammonia condition. The expressions of methanogenic genes especially the genes which encode acetyl-CoA decarbonylase were comprehensively co-inhibited by high ammonia. However, the expressions of the genes involved in ribosome, aminoacyl-tRNA biosynthesis, purine metabolism, cell cycle-caulobacter and RNA degradation showed co-enhancement under the high ammonia condition. The expressions of more genes were co-inhibited under the high ammonia condition, which supported ammonia toxicity on AD process.
Networks of gene expressions negatively (a) and positively (b) responding to ammonia. The taxa with average relative abundance >0.1% and significant differentiated expressions between LN and HN are shown.
Discussion
Although the hydrolysis of substrates would cause variations of ammonia concentrations during AD, in this study the operations of ammonia addition in HN and LN created distinct ammonia pressures to differentiate AD performances and microbial gene expression (Figs. 1 and 2). High ammonia significantly inhibited AD process by decreasing methane production and content in the biogas, and the accumulations of VFA. The decreased methane content in biogas not only resulted in a low methane production but also indicated a mass of byproducts. The accumulations of VFA, especially acetic acid, implied a potential inhibition of acetoclastic methanogenesis, which agreed well with previous reports.33 Rajagopal R, Masse DI, Singh G. A critical review on inhibition of anaerobic digestion process by excess ammonia. Bioresour Technol. 2013;143:632-641.,55 Chen Y, Cheng JJ, Creamer KS. Inhibition of anaerobic digestion process: a review. Bioresour Technol. 2008;99:4044-4064. Although the accumulations of VFA were observed in HN, such accumulations unlikely caused excessive acidification in AD, which was further supported by the pH value (7.8 ± 0.5). Additionally, the ammonia inhibition more probably occurred under thermophilic temperatures than mesophilic condition (37 ºC).33 Rajagopal R, Masse DI, Singh G. A critical review on inhibition of anaerobic digestion process by excess ammonia. Bioresour Technol. 2013;143:632-641. Thus, in this study, the inhibition of AD process was supposed to be directly attributed to ammonia toxicity on microbial activities, rather than other environmental factors regulated by ammonia.
The microbial activities were obviously regulated by ammonia, which was supported by the PCoA result (Fig. 2). In level 2 pathways, the expressions of energy metabolism and signal transduction were significantly influenced (Fig. 3). The AD actually is an energy metabolism process during which energy is transferred and transformed through various metabolic pathways especially the methanogenic pathways. The energy metabolism mainly including methane metabolism usually couples to actual methane production,11 Lin Q, De Vrieze J, He G, Li X, Li J. Temperature regulates methane production through the function centralization of microbial community in anaerobic digestion. Bioresour Technol. 2016;216:150-158.,2121 Shi WB, Moon CD, Leahy SC, et al. Methane yield phenotypes linked to differential gene expression in the sheep rumen microbiome. Genome Res. 2014;24:1517-1525. so the inhibited expression of energy metabolism mainly resulted in the low methane production in HN. Signal transduction is usually involved in modulating cell behaviors in response to environmental pressures such as pH and ammonia.2222 Landraud P, Chuzeville S, Billon-Grande G, Poussereau N, Bruel C. Adaptation to pH and role of PacC in the rice blast fungus Magnaporthe oryzae. PLoS ONE. 2013;:8.,2323 Liu YL, Burne RA. Multiple two-component systems modulate alkali generation in Streptococcus gordonii in response to environmental stresses. J Bacteriol. 2009;191:7353-7362. Thus, a higher expression of this pathway in HN could be explained. The obviously higher expression of cell motility in HN coupled to that of signal transduction, which agreed with previous report.2424 Wang ZB, Liu XL, Ni SQ, et al. Weak magnetic field: a powerful strategy to enhance partial nitrification. Water Res. 2017;120:190-198. This further supported microbial response to ammonia by behaviors or movements. Unexpectedly, in HN only the expression of energy metabolism was depressed, but other pathways had higher expressions compared to that in LN (Fig. 3). In consideration of that methanogens are not dominant microorganisms compared to bacteria such as Firmicutes, Bacteroidetes and Proteobacteria in AD,2525 De Vrieze J, Saunders AM, He Y, et al. Ammonia and temperature determine potential clustering in the anaerobic digestion microbiome. Water Res. 2015;75:312-323. it is reasonable to deduce that these pathways except energy metabolism were mainly conducted by bacteria. Thus, the higher expressions of these pathways in HN probably indicated high activities of bacteria under high ammonia condition. This was likely because ammonia could improve nutrient of nitrogen for bacterial growth.44 Prochazka J, Dolejs P, Maca J, Dohanyos M. Stability and inhibition of anaerobic processes caused by insufficiency or excess of ammonia nitrogen. Appl Microbiol Biotechnol. 2012;93:439-447. In level 3, the most significantly differentiated expressions between HN and LN was methane metabolism (p = 0.003) which positively correlated with methane production (Table 1). Most of the other pathways had no significant expression differences. Interestingly, only the expressions of methane metabolism, oxidative phosphorylation and pyruvate metabolism were higher in LN and positively contributed to methane production (Fig. 4 and Table 1), but the other pathways had higher expressions in HN. This situation was similar with that of level 2. This further confirmed that high ammonia provided some improvements to substrate metabolisms mainly conducted by bacteria, but inhibited methanogenic activity. Consequently, although each step of AD food web played crucial roles in actual methane production, the ammonia toxicity on AD process mainly targeted methanogenic process to inhibit methane production.
Ammonia inhibition on methanogenic process would result in a shift in methanogenic acetate utilization from direct acetate cleavage toward syntrophic acetate oxidation.1111 Schnurer A, Nordberg A. Ammonia, a selective agent for methane production by syntrophic acetate oxidation at mesophilic temperature. Water Sci Technol. 2008;57:735-740.,2626 Angenent LT, Sung SW, Raskin L. Methanogenic population dynamics during startup of a full-scale anaerobic sequencing batch reactor treating swine waste. Water Res. 2002;36:4648-4654. This was mainly attributed to the greatly decreased abundance of acetoclastic Methanosaeta under high ammonia condition.1111 Schnurer A, Nordberg A. Ammonia, a selective agent for methane production by syntrophic acetate oxidation at mesophilic temperature. Water Sci Technol. 2008;57:735-740. However, whether the expressions of genes involved in acetoclastic methanogenesis were reduced should be revealed. In methanogenic pathway, only the expressions of the genes which encode acetyl-CoA decarbonylase and methyl-coenzyme M reductase were significantly higher in LN (p < 0.05), and showed positive correlations with methane production (p < 0.05). Acetyl-CoA decarbonylase plays an important role in acetoclastic pathway2727 Gong W, Hao B, Wei Z, et al. Structure of the α2ɛ2 Ni-dependent CO dehydrogenase component of the Methanosarcina barkeri acetyl-CoA decarbonylase/synthase complex. Proc Natl Acad Sci USA. 2008;105:9558-9563. and methyl-coenzyme M reductase is the key enzyme in methanogenesis.2828 Ermler U, Grabarse W, Shima S, Goubeaud M, Thauer RK. Crystal structure of methyl coenzyme M reductase: the key enzyme of biological methane formation. Science. 1997;278:1457-1462. Thus, the higher expressions of these genes encoding the two enzymes undoubtedly improved methane production. The expressions of genes which encode acetyl-CoA decarbonylase were significantly depressed in HN, indicating that the acetoclastic methanogenesis was inhibited. Based on transcriptional profile, the ammonia toxicity on acetoclastic methanogenesis was further revealed. Additionally, ammonia inhibited methanogens’ activities also probably by depressing the expressions of genes which encode methyl-coenzyme M reductase. Besides methanogenic genes, the genes involved in pyruvate metabolism had significantly higher expressions in HN, which probably improved the production of acetyl-CoA.2929 Kornberg H, Krebs H. Synthesis of cell constituents from C2-units by a modified tricarboxylic acid cycle. Nature. 1957;179:988-991. The genes involved in aminoacyl-tRNA biosynthesis and ribosome were significantly higher expressed in HN, indicating that ammonia potentially facilitated translation process.1313 Ibba M, Soll D. Aminoacyl-tRNA synthesis. Annu Rev Biochem. 2000;69:617-650.
Although the expressions of individual key genes could generally explain the ammonia toxicity on AD process, gene co-expressions in response to ammonia probably provided a systemic sight. The inhibition of the co-expressions of the genes involved in methane metabolism, glycerolipid metabolism, pyruvate metabolism and oxidative phosphorylation indicated that these pathways probably performed a cooperation to regulate AD efficiency that was mainly represented by methane production. The coupling relationship between methane metabolism and oxidative phosphorylation has been revealed before.11 Lin Q, De Vrieze J, He G, Li X, Li J. Temperature regulates methane production through the function centralization of microbial community in anaerobic digestion. Bioresour Technol. 2016;216:150-158. The glycerolipid metabolism and pyruvate metabolism probably provided potential substrates2929 Kornberg H, Krebs H. Synthesis of cell constituents from C2-units by a modified tricarboxylic acid cycle. Nature. 1957;179:988-991. for methanogenesis. Interestingly, nearly all the genes which encode acetyl-CoA decarbonylase showed inhibition of co-expressions under the high ammonia condition, which further demonstrated that acetoclastic methanogenesis were inhibited by high ammonia. This also showed that these genes compared to other methanogenic genes were unitedly and highly sensitive to NH4 + concentration. These genes could be used as potential indicators for ammonia toxicity on AD process. Additionally, the in inhibition of co-expression of the genes which encode acetyl-CoA decarbonylase and methyl-coenzyme M reductase, indicating the cooperation of the two enzymes in methanogenesis.
Consequently, except methanogenesis, most of pathways were not significantly influenced by high ammonia concentration, so that they were probably not the key factors contributing to decreased methane production. Thus, ammonia toxicity on AD process mainly targeted methanogenic process by inhibiting the expressions of genes which encode acetyl-CoA decarbonylase and methyl-coenzyme M reductase to finally decrease methane production. This study revealed mechanisms underlying microbial response to ammonia pressure based on gene expressions, and further discovered ammonia inhibition only targeting on the genes encoding the above two enzymes. However, the adaptions of microbial gene expressions to ammonia pressure during longtime AD also should be considered in the future work.
Acknowledgements
This work was supported by the Key Project of Education Department of Sichuan Province (No. 17ZA0215) and Major Cultivation Project of Education Department of Sichuan Province (No. 17CZ0018).
Appendix A Supplementary data
Supplementary data associated with this article can be found, in the online version, at doi:10.1016/j.bjm.2018.04.008.
REFERENCES
-
1Lin Q, De Vrieze J, He G, Li X, Li J. Temperature regulates methane production through the function centralization of microbial community in anaerobic digestion. Bioresour Technol 2016;216:150-158.
-
2Sun W, Qian X, Gu J, Wang XJ, Zhang L, Guo AY. Mechanisms and effects of arsanilic acid on antibiotic resistance genes and microbial communities during pig manure digestion. Bioresour Technol 2017;234:217-223.
-
3Rajagopal R, Masse DI, Singh G. A critical review on inhibition of anaerobic digestion process by excess ammonia. Bioresour Technol 2013;143:632-641.
-
4Prochazka J, Dolejs P, Maca J, Dohanyos M. Stability and inhibition of anaerobic processes caused by insufficiency or excess of ammonia nitrogen. Appl Microbiol Biotechnol 2012;93:439-447.
-
5Chen Y, Cheng JJ, Creamer KS. Inhibition of anaerobic digestion process: a review. Bioresour Technol 2008;99:4044-4064.
-
6Zhang M, Lin Q, Rui J, Li J, Li X. Ammonium inhibition through the decoupling of acidification process and methanogenesis in anaerobic digester revealed by high throughput sequencing. Biotechnol Lett 2016;:1-6.
-
7Hejnfelt A, Angelidaki I. Anaerobic digestion of slaughterhouse by-products. Biomass Bioenergy 2009;33:1046-1054.
-
8Kayhanian M. Ammonia inhibition in high-solids biogasification: an overview and practical solutions. Environ Technol 1999;20:355-365.
-
9Wiegant W, Zeeman G. The mechanism of ammonia inhibition in the thermophilic digestion of livestock wastes. Agric Wastes 1986;16:243-253.
-
10Karakashev D, Batstone DJ, Angelidaki I. Influence of environmental conditions on methanogenic compositions in anaerobic biogas reactors. Appl Environ Microb 2005;71:331-338.
-
11Schnurer A, Nordberg A. Ammonia, a selective agent for methane production by syntrophic acetate oxidation at mesophilic temperature. Water Sci Technol 2008;57:735-740.
-
12Gallert C, Bauer S, Winter J. Effect of ammonia on the anaerobic degradation of protein by a mesophilic and thermophilic biowaste population. Appl Microbiol Biotechnol 1998;50:495-501.
-
13Ibba M, Soll D. Aminoacyl-tRNA synthesis. Annu Rev Biochem 2000;69:617-650.
-
14Ho L, Ho G. Mitigating ammonia inhibition of thermophilic anaerobic treatment of digested piggery wastewater: use of pH reduction, zeolite, biomass and humic acid. Water Res 2012;46:4339-4350.
-
15APHA. Standard Methods for the Examination of Water and Wastewater Washington, DC: American Public Health Association; 1998.
-
16Hart SC, Stark JM, Davidson EA, Firestone MK. Nitrogen mineralization, immobilization, and nitrification. Soil Sci Soc Am J 1994;44:985-1018.
-
17Meyer F, Paarmann D, D'Souza M, et al. The metagenomics RAST server – a public resource for the automatic phylogenetic and functional analysis of metagenomes. BMC Bioinformatics 2008;9:1-8.
-
18Yu K, Zhang T. Metagenomic and metatranscriptomic analysis of microbial community structure and gene expression of activated sludge. PLoS ONE 2012;7:e38183.
-
19Benjamini Y, Hochberg Y. Controlling the false discovery rate: a practical and powerful approach to multiple testing. J R Stat Soc B 1995;57:289-300.
-
20Shannon P, Markiel A, Ozier O, et al. Cytoscape: a software environment for integrated models of biomolecular interaction networks. Genome Res 2003;13:2498-2504.
-
21Shi WB, Moon CD, Leahy SC, et al. Methane yield phenotypes linked to differential gene expression in the sheep rumen microbiome. Genome Res 2014;24:1517-1525.
-
22Landraud P, Chuzeville S, Billon-Grande G, Poussereau N, Bruel C. Adaptation to pH and role of PacC in the rice blast fungus Magnaporthe oryzae PLoS ONE 2013;:8.
-
23Liu YL, Burne RA. Multiple two-component systems modulate alkali generation in Streptococcus gordonii in response to environmental stresses. J Bacteriol 2009;191:7353-7362.
-
24Wang ZB, Liu XL, Ni SQ, et al. Weak magnetic field: a powerful strategy to enhance partial nitrification. Water Res 2017;120:190-198.
-
25De Vrieze J, Saunders AM, He Y, et al. Ammonia and temperature determine potential clustering in the anaerobic digestion microbiome. Water Res 2015;75:312-323.
-
26Angenent LT, Sung SW, Raskin L. Methanogenic population dynamics during startup of a full-scale anaerobic sequencing batch reactor treating swine waste. Water Res 2002;36:4648-4654.
-
27Gong W, Hao B, Wei Z, et al. Structure of the α2ɛ2 Ni-dependent CO dehydrogenase component of the Methanosarcina barkeri acetyl-CoA decarbonylase/synthase complex. Proc Natl Acad Sci USA 2008;105:9558-9563.
-
28Ermler U, Grabarse W, Shima S, Goubeaud M, Thauer RK. Crystal structure of methyl coenzyme M reductase: the key enzyme of biological methane formation. Science 1997;278:1457-1462.
-
29Kornberg H, Krebs H. Synthesis of cell constituents from C2-units by a modified tricarboxylic acid cycle. Nature 1957;179:988-991.
Edited by
Publication Dates
-
Publication in this collection
Oct-Dec 2018
History
-
Received
25 Sept 2017 -
Accepted
13 Apr 2018 -
Published
21 May 2018