ABSTRACT
Introduction:
The maximum oxygen consumption (VO2max) is the gold standard in the cardiorespiratory endurance assessment.
Objective:
This study aimed to develop a mathematical model that contains variables to determine the VO2max of sedentary people.
Methods:
Twenty participants (10 men and 10 women) with a mean age of 19.8±1.77 years were included. For each participant, body composition (percentage of fat and muscle), heart rate variability (HRV) at rest (supine and standing), and VO2max were evaluated through an indirect test on a cycloergometer. A multivariate linear regression model was developed from the data obtained, and the model assumptions were verified.
Results:
Using the data obtained, including percentage of fat (F), percentage of muscle (M), percentage of power at very low frequency (VLF), α-value of the detrended fluctuation analysis (DFAα1), heart rate (HR) in the resting standing position, and age of the participants, a model was established for men, which was expressed as VO2max = 4.216 + (Age*0.153) + (F*0.110) - (M*0.053) - (VLF*0.649) - (DFAα1*2.441) - (HR*0.014), with R2 = 0.965 and standard error = 0.146 L/min. For women, the model was expressed as VO2max = 1.947 - (Age*0.047) + (F*0.024) + (M*0.054) + (VLF*1.949) - (DFAα1*0.424) - (HR*0.019), with R2 = 0.987 and standard error = 0.077 L/min.
Conclusion:
The obtained model demonstrated the influence exerted by body composition, the autonomic nervous system, and age in the prediction of VO2max.
Keywords:
body composition; autonomic nervous system; oxygen consumption; linear models
RESUMO
Introdução:
O consumo máximo de oxigênio (VO2máx) é o padrão-ouro na avaliação da resistência cardiorrespiratória. Objetivo: Este estudo visou desenvolver um modelo matemático com as variáveis usadas na determinação do VO2máx em indivíduos sedentários.
Método:
Vinte indivíduos (10 homens e 10 mulheres) com média de idade 19,8±1,77 anos foram incluídos. Para cada participante, foram avaliados composição corporal (percentual de gordura e de músculo), variabilidade da frequência cardíaca (VFC) em repouso (em decúbito dorsal e em pé) e o VO2máx, empregando-se o protocolo em cicloergômetro, método indireto. A partir dos dados obtidos, desenvolveu-se um modelo de regressão linear multivariado e os pressupostos do modelo foram verificados.
Resultados:
Usando os dados obtidos, incluindo percentual de gordura (G), porcentagem de músculos (M), porcentagem de energia em frequência muito baixa (FMB), valor de α da análise de flutuação sem tendências (DFAα1), frequência cardíaca (FC) em repouso na posição em pé e a idade dos participantes, estabeleceu-se um modelo para homens, expresso como: VO2máx = 4,216 + (Idade*0,153) + (G*0,110) - (M*0,053) - (FMB0,649*) - (DFAα1*2,441) - (FC*0,014) com R2 = 0,965 e erro padrão = 0,146 L/min. Para as mulheres, o modelo foi expresso como: VO2máx = 1,947 - (Idade*0,047) + (G*0,024) + (M*0,054) + (FMB*1,949) - (DFAα1*0,424) - (FC*0,019) com R2 = 0,987 e erro padrão de 0,077 L/min.
Conclusão:
O modelo desenvolvido demonstrou a influência exercida pela composição corporal, pelo sistema nervoso autônomo e pela idade na predição do VO2máx.
Descritores:
composição corporal; sistema nervoso autônomo; consumo de oxigênio; modelos lineares
RESUMEN
Introducción:
El consumo máximo de oxígeno (VO2max) es el patrón áureo en la evaluación de la resistencia cardiorrespiratoria.
Objetivo:
Este estudio tuvo como objetivo desarrollar un modelo matemático con las variables que participan en la determinación del VO2max en individuos sedentarios.
Método:
Veinte sujetos (10 hombres y 10 mujeres) con edad promedio de 19,8 ± 1,77 años se han incluido. Para cada participante, se evaluó la composición corporal (porcentaje de grasa y músculo), variabilidad de la frecuencia cardiaca (VFC) en reposo (decúbito supino y en pie) y VO2max mediante un test indirecto en cicloergómetro. A partir de los datos obtenidos se desarrolló un modelo de regresión lineal multivariado y se comprobaron los supuestos del modelo.
Resultados:
Usando los datos obtenidos, incluyendo porcentaje de grasa (G), porcentaje de músculos (M), porcentaje de energía en frecuencia muy baja (FMB), valor de α del análisis de fluctuación sin tendencias (DFAα1), frecuencia cardiaca (FC) en reposo en la posición en pie y la edad de los participantes, se estableció un modelo para hombres que se expresa como VO2max = 4,216 + (Edad*0,153) + (G*0,110) - (M*0,053) - (FMB*0,649) - (DFAα1*2,441) - (FC*0,014) con R2 = 0,965 y error típico = 0,146 L/min. Para las mujeres el modelo se expresó como VO2max = 1,947 - (Edad*0,047) + (G*0,024) + (M*0,054) + (FMB*1,949) - (DFAα1*0,424) - (FC*0,019) con R2 = 0,987 y error típico de 0,077 L/min.
Conclusión:
El modelo desarrollado demostró la influencia ejercida por la composición corporal, el sistema nervioso autónomo y la edad en la predicción del VO2max.
Descriptores:
composición corporal; sistema nervioso autónomo; consumo de oxígeno; modelos lineales
INTRODUCTION
For the determination of cardiorespiratory endurance, the gold standard has been maximum oxygen consumption (VO2max), which corresponds to the maximum transport capacity and use of oxygen during high intensity exercise11 - Åstrand PO. Rodahl K. Dahl H. Strømme S. Textbook of work physiology: physiological bases of exercise. 4th ed. Windsor: Human Kinetics; 2003.. From a physiological point of view, VO2max is determined by central conditions associated with the transport of atmospheric oxygen to the muscles (lung function, cardiac output, and blood volume), while the use of oxygen is determined peripherally by conditions such as muscular capillarity, diffusion capacity, and mitochondrial activity22 - Bassett DR Jr, Howley ET. Limiting factors for maximum oxygen uptake and determinants of endurance performance. Med Sci Sports Exerc. 2000;32(1):70-84.. In addition, there is a significant genetic component of VO2maX33 - Bouchard C, Sarzynski MA, Rice TK, Kraus WE, Church TS, Sung YJ, et al. Genomic predictors of the maximal O2 uptake response to standardized exercise training programs. J Appl Physiol (1985). 2011;110(5):1160-70..
From a central viewpoint, one of the main factors for the determination of VO2max is cardiac output, which corresponds to the volume of blood ejected by the heart in one minute. This value can be increased by as much as six times in the case of high-intensity exercise in well-trained athletes44 - Klasnja AV, Jakovljevic DG, Barak OF, Popadic Gacesa JZ, Lukac DD, Grujic NG. Cardiac power output and its response to exercise in athletes and non-athletes. Clin Physiol Funct Imaging. 2013;33(3):201-5.. Cardiac output exhibits rapid variation due to the action of the autonomic nervous system, and it can be greatly increased in the ventricular cavities, which has been observed in athletes55 - Plews DJ, Laursen PB, Stanley J, Kilding AE, Buchheit M. Training adaptation and heart rate variability in elite endurance athletes: opening the door to effective monitoring. Sports Med. 2013;43(9):773-81..
To evaluate the action of the autonomic nervous system, Heart Rate Variability (HRV) has been used, which analyzes a time series (TS) of the variation in the duration of a beat with respect to the next. In addition, due to the use of digital signal processing systems, this TS can be analyzed by characteristics of its spectrum and by nonlinear methods66 - Martinelli FS, Chacon-Mikahil MP, Martins LE, Lima-Filho EC, Golfetti R, Paschoal MA, et al. Heart rate variability in athletes and nonathletes at rest and during head-up tilt. Braz J Med Biol Res. 2005;38(4):639-47.. Similarly, both HRV and heart rate (HR) at rest account for cardiovascular adaptations such as left ventricular hypertrophy and increased parasympathetic tone77 - Azevedo LF, Perlingeiro PS, Hachul DT, Gomes-Santos IL, Brum PC, Allison TG, et al. Sport modality affects bradycardia level and its mechanisms of control in professional athletes. Int J Sports Med. 2014;35(11):954-9..
From a peripheral point of view, conditions exist at the muscular level itself that are related to VO2max such as muscular capillarity and mitochondrial density88 - Miller BF, Hamilton KL. A perspective on the determination of mitochondrial biogenesis. Am J Physiol Endocrinol Metab. 2012;302(5):E496-9.. This finding demonstrates the directly proportional relationship between VO2max and muscle mass and an inversely proportional relationship to percentage of fat99 - Amani AR. Somchit MN. B Konting MM. Kok LY. Relationship between body fat percent and maximal oxygen uptake among young adults. J Am Sci. 2010;6(4):1-4..
Given the significant role that VO2max plays in predicting cardio-respiratory fitness and its limitations for direct evaluation in physically inactive people, the aim of this study is to contribute to the development of a mathematical model that determines the variables that are directly involved in predicting the VO2max in sedentary people.
MATERIALS AND METHODS
After approval of the project by the ethics committee of the University of La Sabana, 20 volunteer subjects (10 men and 10 women) with a mean age of 19.8 ±1.77 were selected for convenience. The inclusion criteria consisted of a sedentary lifestyle, no history of cardiovascular disease, no musculoskeletal pathological conditions, and not taking any medications that affect the response of the autonomic nervous system. All participants signed an informed consent form. In addition, a specialist with the capacity to evaluate obtained biological signals was consulted, and those subjects whose signals were excessively contaminated and were impossible to clean were excluded. Participants were evaluated in the morning between 7 and 9 a.m. and were asked about quality of sleep the night before and the use of caffeine, alcohol, or cigarettes during the previous 24 hours; inclusion decisions were postponed for those who did not meet the established criteria.
Acquisition variables
Body composition was evaluated anthropometrically, and the measures included body weight (kg), height (cm) and six skin folds (triceps, suprailiac, subscapular, abdominal, thigh, and leg). To calculate the fat percentage, the Yuhasz1010 - Yuhasz MS. Physiscal fitness manual. London Ontario: Universidad de Western Ontario; 1974. formula was used, and for muscle mass calculations, the Doupe et al.1111 - Doupe MB, Martin AD, Searle MS, Kriellaars DJ, Giesbrecht GG. A new formula for population-based estimation of whole body muscle mass in males. Can J Appl Physiol. 1997;22(6):598-608. formula was used. The perimeters, diameters, and folds were obtained by a standardized protocol applied by a certified expert of the International Society for the Advancement of Kinanthropometry (ISAK). In addition, waist circumference was measured midway between the seventh rib and the iliac spine1212 - Klein S, Allison DB, Heymsfield SB, Kelley DE, Leibel RL, Nonas C, et al. Waist circumference and cardiometabolic risk: a consensus statement from shaping America's health: Association for Weight Management and Obesity Prevention; NAASO, the Obesity Society; the American Society for Nutrition; and the American Diabetes Association. Diabetes Care. 2007;30(6):1647-52.. The instruments used included a Harpenden® caliper, a Stanley® metric tape, a Berfer® pachymeter, a Faga® stadiometer, and an Omron® scale. HR was measured in subjects in the physiology laboratory of the Biomedical Campus of the University of La Sabana at an average temperature of 20°C without any influence from drafts, noise or lights, which can alter the response of the autonomic nervous system. For these measurements, a Polar RS800CX heart rate monitor was used for 10 minutes (five minutes in the supine position and five minutes in the standing position), which is enough time for signal analysis1313 - Sinnreich R, Kark JD, Friedlander Y, Sapoznikov D, Luria MH. Five minute recordings of heart rate variability for population studies: repeatability and age-sex characteristics. Heart. 1998;80(2):156-62.. After warming up for five minutes, and after having established 75% of the maximum theoretical HR by the Tanaka et al.1414 - Tanaka H, Monahan KD, Seals DR. Age-predicted maximal heart rate revisited. J Am Coll Cardiol. 2001;37(1):153-6. formula the subjects performed an incremental test on the cycloergometer until they reached the established HR. At that point, the power was recorded, and this value was used to estimate VO2max with the Astrand nomogram of the cycloergometer1515 - Cink RE, Thomas TR. Validity of the Astrand-Ryhming nomogram for predicting maximal oxygen intake. Br J Sports Med. 1981;15(3):182-5.. The general characteristics of the participants are described in Table 1.
Signal analysis
Analysis of HRV was performed using Kubios HRV software (University of Kuopio)1616 - Tarvainen MP, Niskanen JP, Lipponen JA, Ranta-Aho PO, Karjalainen PA. Kubios HRV--heart rate variability analysis software. Comput Methods Programs Biomed. 2014;113(1):210-20.. The pre-processing phase of the HR signal consisted of removal of artifacts (RR interval variations greater than 0.45 sec with respect to the average) and filtering of the signal using a Smoothness priors high-pass filter with a Lambda of 500 and a cutoff frequency of 0.035 Hz1717 - Tarvainen MP, Ranta-Aho PO, Karjalainen PA. An advanced detrending method with application to HRV analysis. IEEE Trans Biomed Eng. 2002;49(2):172-5.. From the noise-free tachogram obtained, the ST segment of the HRV was analyzed in the time domain, and the relevant parameters were calculated (average HR, standard deviation of the heart rate (STDHR), root mean square of the differences between successive RR intervals (RMSSD), and the number of successive RRs that differ by more than 50 ms divided by the total RR intervals (pNN50).
For analysis of the frequency domain, a Fast Fourier transform (FFT) and autoregressive (AR) analysis were used. To obtain an ST segment with equidistant samples, piecewise cubic spline interpolation was used at a rate of 4 Hz; then an FFT was applied to obtain the power spectral density (PSD) and power parameters (RMS and total percentage values) in the very low frequency (VLF, 0-0.04 Hz), low frequency (LF, 0.04 - 0.15 Hz), and high frequency (HF, 0.15 - 0.4 Hz) ranges. Subsequently, a 16th order AR model was implemented to obtain these same values in the VLF, LF, and HF ranges. For the nonlinear analysis, a Poincaré diagram was used to establish the SD1 and SD2 parameters, and detrended fluctuation analysis (DFA) was used to establish α1 and α2. The overall results of the HRV analysis are shown in Table 2.
Statistical analysis
Statistical analyses were performed with IBM SPSS Statistics 21. Initially, the means of the general parameters (age, weight, height, body composition, VO2max, and HR) of men and women were statistically compared with a two-tailed t-test for unpaired data. The level of statistical significance was set at a p value ≤ 0.05. Next, the Pearson correlation coefficients (r) were calculated between VO2max and each of the variables including body composition, age, and HRV. An association was established according to the r value (no correlation r = 0.0, weak r = 0.1, medium r = 0.5, significant r = 0.75, very strong r = 0.9, and perfect r = 1) for further ordering using the association value1818 - Hernandez SR, Fernández CC. Metodología de la investigación. México: McGraw-Hill Interamericana; 1991.. From this ordering, the best predictors of the dependent variable (VO2max) in men and women were recorded and used to implement a multivariate linear regression model, according to equation 1 below. In the development of this model, simple linear regression and stepwise regressions were performed to discriminate each of the predictors and eliminate collinearity.
Where VO2max is the value estimated by the Astrand nomogram, X1, X2… Xk are the independent variables, B0 is the initial condition, β1, β2... βk correspond to the coefficients of each of the variables, and ε is the residual or unpredictable value.
To determine the validity of the model, compliance with the assumptions was evaluated independently, including Homoscedasticity, (standardized residual error values vs. standardized predictions), Normality (behavior of probabilities), Non-collinearity (inflation factors of the variance), Linearity (correlations between independent variables and the dependent variable), and Independence (Durbin Watson model)1919 - DUrbin J, Watson GS. Testing for serial correlation in least squares regression. II. Biometrika. 1951;38(1-2):159-78..
RESULTS
The independent variables that showed a stronger association with the dependent variable (VO2max) for men were age, HR at rest in a supine position, and DFAα1 in the nonlinear analysis. For women, the variables included percentage of muscle mass, percentage of fat, percentage of VLF in a supine position analyzed by the AR method, and HR value at rest with patient in a standing position (Table 3).
The model output showed an R2 of 0.965 for men with a standard error of estimation of VO2max of 0.146 L/min, while for women, the R2 was 0.987 with a standard error of estimation of VO2max of 0.077 L/min. The ANOVA for both men and women showed a linear relationship between the dependent variable and the independent variables, which was significant in men (p = 0.027) and women (p = 0.007). The Durbin Watson test for independence produced a value of 3.209 for men and 2.036 for women. The scatterplots of standardized predictions and standardized residuals (Figure 1A and 1B) did not show any pattern of association, which is consistent with homoscedasticity, while the normal probability graph (Figure 1C and 1D) showed a trend of aligned residues along the diagonal of the graph associated with normality.

Figure A and B represent scatterplots of the residuals, while Figures C and D represent the probability of the residuals.
Inflation factors of the variance in the model for men ranged from 1.494 to 5.676 and were higher for the DFAα1 variable. In the case of women, the values ranged from 1.493 to 3.145, and the percentage of muscle mass variable was higher.
Finally, the equation obtained for the prediction of VO2max in men was:
The equation for women was:
The results for the coefficients, standard error, significance, and inflation factors of the variance for men and women are shown in Table 4.
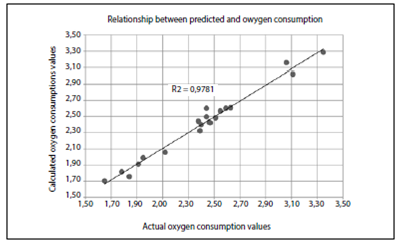
The results of the predicted values and actual values for each of the cases in men and women are shown in Table 5 and Figure 2.

Correlation graph for data obtained in men and women through the Astrand test and calculated oxygen consumption from equations 2 and 3.
DISCUSSION
The fundamental hypothesis of the study is based on the ability to predict VO2max from the variables body composition and HRV. The results obtained showed an inverse correlation between VO2max and adipose tissue (r = -0.315) and a directly proportional relationship to muscle mass in women (r = 0.668). Similar results were found in previous studies, which demonstrated that adipose tissue exhibited an inverse relationship with the measured VO2max (r = -0.40)9 and, in turn, was proportional to muscle mass (r = 0.68)2020 - LeMaitre JP, Harris S, Hannan J, Fox KA, Denvir MA. Maximum oxygen uptake corrected for skeletal muscle mass accurately predicts functional improvements following exercise training in chronic heart failure. Eur J Heart Fail. 2006;8(3):243-8.; the latter was analyzed in patients with heart failure. Additional studies presented fat free mass (r = 0.87) as a fundamental determinant of VO2max2121 - Goran M, Fields DA, Hunter GR, Herd SL, Weinsier RL. Total body fat does not influence maximal aerobic capacity. Int J Obes Relat Metab Disord. 2000;24(7):841-8., which was not found in our case. Other widely used variables such as body weight and body mass index showed poor prediction of VO2max, which was also shown in other studies2222 - Krachler B, Savonen K, Komulainen P, Hassinen M, Lakka TA, Rauramaa R. Cardiopulmonary fitness is a function of lean mass, not total body weight: The DR's EXTRA study. Eur J Prev Cardiol. 2015;22(9):1171-9..
Physiologically, the relationships found are valid, as skeletal muscle is considered the most active tissue from a metabolic point of view, in addition to being highly vascularized and rich in mitochondria2323 - Westerblad H, Bruton JD, Katz A. Skeletal muscle: energy metabolism, fiber types, fatigue and adaptability. Exp Cell Res. 2010;316(18):3093-9., contrary to adipose tissue, which has poor metabolic activity.
Athletes and individuals highly trained in predominantly aerobic exercise have a decreased HR at rest as a result of both neural and anatomical adaptations2424 - Baggish AL, Wood MJ. Athlete's heart and cardiovascular care of the athlete: scientific and clinical update. Circulation. 2011;123(23):2723-35.. For this reason, the HR at rest has been proposed as a predictor of VO2max2525 - Uth N, Sørensen H, Overgaard K, Pedersen PK. Estimation of VO2max from the ratio between HRmax and HRrest--the Heart Rate Ratio Method. Eur J Appl Physiol. 2004;91(1):111-5.. In this study, we showed that for men (r = -0.527) and women (r = -0.723), there is an inverse relationship between HR at rest in a standing position and VO2max. With respect to HRV and prediction of VO2max, some authors have stated that HRV can only explain up to 20.1% of the behavior of VO2max2626 - Grant CC, Murray C, Janse van Rensburg DC, Fletcher L. A comparison between heart rate and heart rate variability as indicators of cardiac health and fitness. Front Physiol. 2013;4:337.; however, our results demonstrated that variables such as percentage of power at VLF or DFA fluctuation analysis are highly associated with the prediction of VO2max. These findings present new research opportunities, as the power at VLF is related to changes in the humoral system2727 - Kurjanova EV, Teplyj DL. Influence of central neurotransmitters on heart rate variability in outbred rats at rest and during acute stress: nature of very-low-wave spectrum component revisited. Bull Exp Biol Med. 2010;149(1):10-3., while DFA fluctuations have been considered useful when analyzing the intrinsic behavior of a system2828 - Seely AJ, Macklem PT. Complex systems and the technology of variability analysis. Crit Care. 2004;8(6):R367-84.. Finally, the age of the participants influenced the final prediction model of VO2max, with correlations of r = 0.423 in men and r = 0.212 in women, which has been considered in the development of other prediction models2929 - Rexhepi AM. Brestovci B. Prediction of VO2max based on age, body mass. and resting heart rate. Human Movement. 2014;15(1):56-9..
The Durbin Watson test for independence of variables showed, in the case of women, independence of the residuals, while in men, the residuals were autocorrelated. These finding are consistent because HRV is related to physical activity and body composition3030 - Teisala T, Mutikainen S, Tolvanen A, Rottensteiner M, Leskinen T, et al. Associations of physical activity, fitness, and body composition with heart rate variability-based indicators of stress and recovery on workdays: a cross-sectional study. J Occup Med Toxicol. 2014;9:16.. Changes in body composition can lead to changes in the autonomic response; thus, in obese patients, the percentage of fat is associated with a decrease in the behavior of LF (r = -0.43) and a lower RMSSD (r = -0.35)3131 - Kim JA, Park YG, Cho KH, Hong MH, Han HC, Choi YS, et al. Heart rate variability and obesity indices: emphasis on the response to noise and standing. J Am Board Fam Pract. 2005;18(2):97-103.. Similar results have been found in other studies in which adipose tissue has been shown to be related to the LF/HF (r = 0.56)3232 - Millis RM, Austin RE, Hatcher MD, Bond V, Faruque MU, Goring KL, et al. Association of body fat percentage and heart rate variability measures of sympathovagal balance. Life Sci. 2010;86(5-6):153-7..
Although many studies have shown changes in HRV in athletes and physically active people3333 - Aubert AE, Seps B, Beckers F. Heart rate variability in athletes. Sports Med. 2003;33(12):889-919., few studies have linked these findings to the composition of muscle mass. Some authors have found that HRV in overweight patients is lower when it is associated with reduced muscle mass3434 - Baek J, Park D, Kim I, Won JU, Hwang J, Roh J. Autonomic dysfunction of overweight combined with low muscle mass. Clin Auton Res. 2013;23(6):325-31., while other authors have shown that anthropometric behavior contributes to changes in the HRV3535 - Andrew ME, Shengqiao L, Wactawski-Wende J, Dorn JP, Mnatsakanova A, Charles LE, et al. Adiposity, muscle, and physical activity: predictors of perturbations in heart rate variability. Am J Hum Biol. 2013;25(3):370-7. .
A small sample of individuals was used because this was considered a pilot study; the sample should be expanded to validate the equations.
CONCLUSION
The VO2max responds physiologically to multiple variables; in this study, body composition (percentage of fat and percentage of muscle) was shown to be important for establishing VO2max. Additionally, the behavior of the autonomic nervous system also contributes to the understanding of the physiological adaptations that accompany higher values of VO2max. Our model showed that other important relationships exist between variables, such as the role of body composition in HRV. The joint analysis of body composition (percent of muscle mass and percent of fat), HR at rest, HRV (percent VLF and α coefficient of DFA), and age can explain the high percentage of VO2max both in men and women.
ACKNOWLEDGMENTS
We acknowledge the physiology laboratory of the biomedical campus of the University of La Sabana, which provided the equipment and infrastructure for the development of the research and the research participants.
All authors declare no potential conflict of interest related to this article.
REFERENCES
-
1- Åstrand PO. Rodahl K. Dahl H. Strømme S. Textbook of work physiology: physiological bases of exercise. 4th ed. Windsor: Human Kinetics; 2003.
-
2- Bassett DR Jr, Howley ET. Limiting factors for maximum oxygen uptake and determinants of endurance performance. Med Sci Sports Exerc. 2000;32(1):70-84.
-
3- Bouchard C, Sarzynski MA, Rice TK, Kraus WE, Church TS, Sung YJ, et al. Genomic predictors of the maximal O2 uptake response to standardized exercise training programs. J Appl Physiol (1985). 2011;110(5):1160-70.
-
4- Klasnja AV, Jakovljevic DG, Barak OF, Popadic Gacesa JZ, Lukac DD, Grujic NG. Cardiac power output and its response to exercise in athletes and non-athletes. Clin Physiol Funct Imaging. 2013;33(3):201-5.
-
5- Plews DJ, Laursen PB, Stanley J, Kilding AE, Buchheit M. Training adaptation and heart rate variability in elite endurance athletes: opening the door to effective monitoring. Sports Med. 2013;43(9):773-81.
-
6- Martinelli FS, Chacon-Mikahil MP, Martins LE, Lima-Filho EC, Golfetti R, Paschoal MA, et al. Heart rate variability in athletes and nonathletes at rest and during head-up tilt. Braz J Med Biol Res. 2005;38(4):639-47.
-
7- Azevedo LF, Perlingeiro PS, Hachul DT, Gomes-Santos IL, Brum PC, Allison TG, et al. Sport modality affects bradycardia level and its mechanisms of control in professional athletes. Int J Sports Med. 2014;35(11):954-9.
-
8- Miller BF, Hamilton KL. A perspective on the determination of mitochondrial biogenesis. Am J Physiol Endocrinol Metab. 2012;302(5):E496-9.
-
9- Amani AR. Somchit MN. B Konting MM. Kok LY. Relationship between body fat percent and maximal oxygen uptake among young adults. J Am Sci. 2010;6(4):1-4.
-
10- Yuhasz MS. Physiscal fitness manual. London Ontario: Universidad de Western Ontario; 1974.
-
11- Doupe MB, Martin AD, Searle MS, Kriellaars DJ, Giesbrecht GG. A new formula for population-based estimation of whole body muscle mass in males. Can J Appl Physiol. 1997;22(6):598-608.
-
12- Klein S, Allison DB, Heymsfield SB, Kelley DE, Leibel RL, Nonas C, et al. Waist circumference and cardiometabolic risk: a consensus statement from shaping America's health: Association for Weight Management and Obesity Prevention; NAASO, the Obesity Society; the American Society for Nutrition; and the American Diabetes Association. Diabetes Care. 2007;30(6):1647-52.
-
13- Sinnreich R, Kark JD, Friedlander Y, Sapoznikov D, Luria MH. Five minute recordings of heart rate variability for population studies: repeatability and age-sex characteristics. Heart. 1998;80(2):156-62.
-
14- Tanaka H, Monahan KD, Seals DR. Age-predicted maximal heart rate revisited. J Am Coll Cardiol. 2001;37(1):153-6.
-
15- Cink RE, Thomas TR. Validity of the Astrand-Ryhming nomogram for predicting maximal oxygen intake. Br J Sports Med. 1981;15(3):182-5.
-
16- Tarvainen MP, Niskanen JP, Lipponen JA, Ranta-Aho PO, Karjalainen PA. Kubios HRV--heart rate variability analysis software. Comput Methods Programs Biomed. 2014;113(1):210-20.
-
17- Tarvainen MP, Ranta-Aho PO, Karjalainen PA. An advanced detrending method with application to HRV analysis. IEEE Trans Biomed Eng. 2002;49(2):172-5.
-
18- Hernandez SR, Fernández CC. Metodología de la investigación. México: McGraw-Hill Interamericana; 1991.
-
19- DUrbin J, Watson GS. Testing for serial correlation in least squares regression. II. Biometrika. 1951;38(1-2):159-78.
-
20- LeMaitre JP, Harris S, Hannan J, Fox KA, Denvir MA. Maximum oxygen uptake corrected for skeletal muscle mass accurately predicts functional improvements following exercise training in chronic heart failure. Eur J Heart Fail. 2006;8(3):243-8.
-
21- Goran M, Fields DA, Hunter GR, Herd SL, Weinsier RL. Total body fat does not influence maximal aerobic capacity. Int J Obes Relat Metab Disord. 2000;24(7):841-8.
-
22- Krachler B, Savonen K, Komulainen P, Hassinen M, Lakka TA, Rauramaa R. Cardiopulmonary fitness is a function of lean mass, not total body weight: The DR's EXTRA study. Eur J Prev Cardiol. 2015;22(9):1171-9.
-
23- Westerblad H, Bruton JD, Katz A. Skeletal muscle: energy metabolism, fiber types, fatigue and adaptability. Exp Cell Res. 2010;316(18):3093-9.
-
24- Baggish AL, Wood MJ. Athlete's heart and cardiovascular care of the athlete: scientific and clinical update. Circulation. 2011;123(23):2723-35.
-
25- Uth N, Sørensen H, Overgaard K, Pedersen PK. Estimation of VO2max from the ratio between HRmax and HRrest--the Heart Rate Ratio Method. Eur J Appl Physiol. 2004;91(1):111-5.
-
26- Grant CC, Murray C, Janse van Rensburg DC, Fletcher L. A comparison between heart rate and heart rate variability as indicators of cardiac health and fitness. Front Physiol. 2013;4:337.
-
27- Kurjanova EV, Teplyj DL. Influence of central neurotransmitters on heart rate variability in outbred rats at rest and during acute stress: nature of very-low-wave spectrum component revisited. Bull Exp Biol Med. 2010;149(1):10-3.
-
28- Seely AJ, Macklem PT. Complex systems and the technology of variability analysis. Crit Care. 2004;8(6):R367-84.
-
29- Rexhepi AM. Brestovci B. Prediction of VO2max based on age, body mass. and resting heart rate. Human Movement. 2014;15(1):56-9.
-
30- Teisala T, Mutikainen S, Tolvanen A, Rottensteiner M, Leskinen T, et al. Associations of physical activity, fitness, and body composition with heart rate variability-based indicators of stress and recovery on workdays: a cross-sectional study. J Occup Med Toxicol. 2014;9:16.
-
31- Kim JA, Park YG, Cho KH, Hong MH, Han HC, Choi YS, et al. Heart rate variability and obesity indices: emphasis on the response to noise and standing. J Am Board Fam Pract. 2005;18(2):97-103.
-
32- Millis RM, Austin RE, Hatcher MD, Bond V, Faruque MU, Goring KL, et al. Association of body fat percentage and heart rate variability measures of sympathovagal balance. Life Sci. 2010;86(5-6):153-7.
-
33- Aubert AE, Seps B, Beckers F. Heart rate variability in athletes. Sports Med. 2003;33(12):889-919.
-
34- Baek J, Park D, Kim I, Won JU, Hwang J, Roh J. Autonomic dysfunction of overweight combined with low muscle mass. Clin Auton Res. 2013;23(6):325-31.
-
35- Andrew ME, Shengqiao L, Wactawski-Wende J, Dorn JP, Mnatsakanova A, Charles LE, et al. Adiposity, muscle, and physical activity: predictors of perturbations in heart rate variability. Am J Hum Biol. 2013;25(3):370-7.
Publication Dates
-
Publication in this collection
Jul-Aug 2017
History
-
Received
16 July 2015 -
Accepted
08 Feb 2017