Abstracts
The choice of sampling gears to assess benthic macroinvertebrate communities depends on environmental characteristics, study objectives, and cost effectiveness. Because of the high foraging capacity and diverse habitats and behaviors of benthophagous fishes, their stomach contents may offer a useful sampling tool in studies of benthic macroinvertebrates, especially in large, deep, fast rivers that are difficult to sample with traditional sediment sampling gear. Our objective was to compare the benthic macroinvertebrate communities sampled from sediments with those sampled from fish stomachs. We collected benthic macroinvertebrates and fish from three different habitat types (backwater, beach, riffle) in the wet season, drying season, and dry season along a single reach of the Grande River (Paraná River Basin, southeast Brazil). We sampled sediments through use of a Petersen dredge (total of 216 grabs) and used gill nets to sample fish (total of 36 samples). We analyzed the stomach contents of three commonly occurring benthophagous fish species (Eigenmannia virescens, Iheringichthys labrosus, Leporinus amblyrhynchus). Chironomids dominated in both sampling methods. Macroinvertebrate taxonomic composition and abundances from fish stomachs differed from those from sediment samples, but less so from riffles than from backwater and beach habitats. Macroinvertebrate taxa from E. virescens stomachs were more strongly correlated with sediment samples from all three habitats than were those from the other two species. The species accumulation curves and higher mean dispersion values, compared with with sediment samples suggest that E. virescens is more efficient than sediment samples and the other fish studied at collecting benthic taxa. We conclude that by analyzing the stomach contents of benthophagous fishes it is possible to assess important characteristics of benthic communities (dispersion, taxonomic composition and diversity). This is especially true for studies that only sample fish assemblages to evaluate aquatic ecosystem impacts. Therefore, this approach can be useful to amplify assessments of human impacts, and to incorporate additional bioindicators.
large rivers sampling; fish stomach contents; trophic interactions; habitats; bioindicators
A escolha da ferramenta adequada para avaliar as comunidades de macroinvertebrados bentônicos depende dos objetivos do estudo, das características ambientais e dos recursos financeiros disponíveis. Devido à alta capacidade de forrageamento apresentada por espécies de peixes bentófagas e seu acesso a diversos tipos de habitats, a análise do conteúdo estomacal destas espécies pode ser uma ferramenta útil em avaliações de assembleias de macroinvertebrados bentônicos, especialmente em rios grandes, profundos e rápidos, que são difíceis de amostrar através de métodos convencionais de coleta de sedimento. Nosso objetivo foi comparar as assembleias de macroinvertebrados bentônicos amostrados no sedimento com as assembleias amostradas nos estômagos de espécies de peixes bentófagas. Foram coletados peixes e sedimento em três diferentes tipos de habitats (remanso, praia, corredeira) nos períodos úmido e seco ao longo de um único trecho do rio Grande (bacia do rio Paraná, sudeste do Brasil). O sedimento foi amostrado através de uma draga Petersen (total de 216 dragas) e os peixes através de redes de emalhar (total de 36 amostras). Foram analisados os conteúdos estomacais de três espécies de peixes (Eigenmannia virescens Gymnotiformes, Iheringichthys labrosus Siluriformes; Leporinus amblyrhynchus Characiformes). Chironomidae foi a família dominante em ambos os métodos. A composição taxonômica de macroinvertebrados bentônicos encontrados nos estômagos foi diferente daquela amostrada no sedimento. Os taxa de macroinvertebrados amostrados nos estômagos de E. virescens foram mais correlacionados com os três tipos de habitats do que os taxa obtidos nos estômagos das outras duas espécies. As inclinações das curvas cumulativas, assim como os maiores valores de dispersão média, demonstram que E. virescens possui potencial como ferramenta ecológica para acessar as assembleias de macroinvertebrados bentônicos, assim como os maiores valores de dispersão observados. A família Philopotamidae foi encontrada apenas no estômago de L. amblyrhynchus. Concluímos que através da análise do conteúdo do estômago de peixes é possível acessar importantes características das assembleias bentônicas (p.ex. dispersão, composição taxonômica e diversidade). Esta abordagem é especialmente verdadeira em estudos que utilizam apenas as assembleias de peixes para avaliar e/ou monitorar ecossistemas aquáticos. Desta maneira, esse enfoque pode ser útil, aumentando o conhecimento acerca dos impactos humanos sobre os ecossistemas aquáticos e contribuindo para a utilização de diferentes grupos de bioindicadores.
amostragem em grandes rios; conteúdo estomacal de peixes; interações tróficas; habitats; bioindicadores
1 Introduction
Human occupation of river basins has deteriorated water quality, limited the quantity
and availability of freshwater resources for multiple human uses, and diminished
opportunities for wildlife conservation. Therefore, the conflict between population
and economic growth and aquatic ecosystem conservation has become a substantial
challenge (Dudgeon et al., 2006Dudgeon, D., Arthington, AH., Gessner, MO., Kawabata, Z., Knowler,
DJ., Lévêque, C., Naiman, RJ., Prieur-Richard, AH., Soto, D., Stiassny, MLJ. and
Sullivan, CA., 2006. Freshwater biodiversity: importance, threats, status and
conservation challenges. Biological Reviews of the Cambridge Philosophical
Society, vol. 81, no. 2, p. 163-182.
http://dx.doi.org/10.1017/S1464793105006950. PMid:16336747
http://dx.doi.org/10.1017/S1464793105006...
; Limburg et al., 2011Limburg, KE., Hughes, RM., Jackson, DC. and Czech, B., 2011.
Population increase, economic growth, and fish conservation: collision course or
savvy stewardship. Fisheries (Bethesda, Md.), vol. 36, no. 1, p. 27-35.
http://dx.doi.org/10.1577/03632415.2011.10389053.
http://dx.doi.org/10.1577/03632415.2011....
). Increasingly,
biological assemblage assessments have been used as tools to evaluate anthropogenic
impacts on aquatic ecosystems (Barbour et al.,
1998Barbour, AMT., Gerritsen, J., Snyder, BD. and Stribling, JB., 1998.
Rapid bioassessment protocols for use in streams and wadeable rivers:
periphyton, benthic macroinvertebrates, and fish. 2nd ed. Washington: EPA
841-B-99-002. 339 p.; Li et al., 2010Li, L., Zheng, B. and Liu, L., 2010. Biomonitoring and bioindicators
used for river ecosystems: definitions, approaches and trends. Procedia
Environmental Sciences, vol. 2, p. 1510-1524.
http://dx.doi.org/10.1016/j.proenv.2010.10.164.
http://dx.doi.org/10.1016/j.proenv.2010....
; Tupinambás et al., 2014Tupinambás, TH., Cortes, RMV., Varandas, SG., Hughes, SJ., França,
JS. and Callisto, M., 2014. Taxonomy, metrics or traits? Assessing
macroinvertebrate community responses to daily flow peaking in a highly
regulated Brazilian river system. Ecohydrology, vol. 7, no. 2, p. 828-842.
http://dx.doi.org/10.1002/eco.1406.
http://dx.doi.org/10.1002/eco.1406...
). Benthic
macroinvertebrate communities have frequently been used in these assessments because
of their sensitivity to environmental changes and their ease of sampling (Hellawell, 1986Hellawell, JM., 1986. Biological indicators of freshwater pollution
and environmental management. London: Elsevier Applied Science. 546 p.
http://dx.doi.org/10.1007/978-94-009-4315-5.
http://dx.doi.org/10.1007/978-94-009-431...
; Rosenberg and Resh, 1993Rosenberg, DM. and Resh, VH., 1993. Introduction to freshwater
biomonitoring and benthic macroinvertebrates. In ROSENBERG, DM. and RESH, VH.
(Eds.). Freshwater biomonitoring and benthic macroinvertebrates. New York:
Chapman and Hall. p. 1-9.; Dolédec and Statzner, 2008Dolédec, S. and Statzner, B., 2008. Invertebrate traits for the
biomonitoring of large European rivers: an assessment of specific types of human
impact. Freshwater Biology, vol. 53, no. 3, p. 617-634.
http://dx.doi.org/10.1111/j.1365-2427.2007.01924.x.
http://dx.doi.org/10.1111/j.1365-2427.20...
). Benthic macroinvertebrates are associated
with organic and inorganic substrates (Fleituch,
2003Fleituch, T., 2003. Structure and functional organization of benthic
invertebrates in a regulated stream. International Review of Hydrobiology, vol.
88, no. 34, p. 332-344.
http://dx.doi.org/10.1002/iroh.200390029.
http://dx.doi.org/10.1002/iroh.200390029...
) and are important elements in the bottom-up trophic processes of
aquatic ecosystems (Northcote, 1988Northcote, TG., 1988. Fish in the structure and function of
freshwater ecosystems: a “top-down” view. Canadian Journal of Fisheries and
Aquatic Sciences, vol. 45, no. 2, p. 361-379.
http://dx.doi.org/10.1139/f88-044.
http://dx.doi.org/10.1139/f88-044...
),
converting algae and organic debris into animal tissue (Graça, 2001Graça, MAS., 2001. The role of invertebrates on leaf litter
decomposition in streams - a review. International Review of Hydrobiology, vol.
86, no. 4-5, p. 383-393.
http://dx.doi.org/10.1002/1522-2632(200107)86:4/5<383::AID-IROH383>3.0.CO;2-D.
http://dx.doi.org/10.1002/1522-2632(2001...
) available for fish consumption. Thus, benthic
macroinvertebrates reflect the physical-chemical-biological quality of freshwaters
and are important in aquatic food-webs.
Benthic macroinvertebrates are sampled through use of multiple gears (e.g., Surber
sampler, dredges, kick-nets, rock baskets) depending of the type of ecosystem
(streams, rivers, lakes), substrates (organic and inorganic), and study objectives
(Buss and Borges, 2008Buss, DF. and Borges, EL., 2008. Application of Rapid Bioassessment
Protocols (RBP) for benthic macroinvertebrates in Brazil: comparison between
sampling techniques and mesh sizes. Neotropical Entomology, vol. 37, no. 3, p.
288-295. http://dx.doi.org/10.1590/S1519-566X2008000300007.
PMid:18641899
http://dx.doi.org/10.1590/S1519-566X2008...
; Chadd, 2010Chadd, R., 2010. Assessment of aquatic invertebrates. In HURFORD,
C., SCHNEIDER, M. and COWXEDS, I. (Eds.). Conservation monitoring in freshwater
habitats: a practical guide and case studies. Dordrecht: Springer Netherlands.
p. 63-72. Available from:
<http://www.springerlink.com/index/10.1007/978-1-4020-9278-7>. Access in:
9 July 2012. http://dx.doi.org/10.1007/978-1-4020-9278-7_7.
http://dx.doi.org/10.1007/978-1-4020-927...
). In large rivers, sampling is
mostly limited to margins for logistical and financial reasons (Bartsch et al., 1998BartsCh, LA., RICHARDSON, WB. and NAIMO, TJ., 1998. Sampling benthic
macroinvertebrates in a large flood-plain river: considerations of study design,
sample size, and cost. Environmental Monitoring and Assessment, vol. 52, no. 3,
p. 425-439. http://dx.doi.org/10.1023/A:1005802715051.
http://dx.doi.org/10.1023/A:100580271505...
; Reece and Richardson, 2000Reece, PF. and Richardson, JS., 2000. Benthic macroinvertebrate
assemblages of coastal and continental streams and large rivers of southwestern
British Columbia, Canada. Hydrobiologia, vol. 439, no. 1/3, p. 77-89.
http://dx.doi.org/10.1023/A:1004105820586.
http://dx.doi.org/10.1023/A:100410582058...
; Hughes et al., 2012Hughes, RM., Herlihy, AT., Gerth, WJ. and Pan, Y., 2012. Estimating
vertebrate, benthic macroinvertebrate, and diatom taxa richness in raftable
Pacific Northwest rivers for bioassessment purposes. Environmental Monitoring
and Assessment, vol. 184, no. 5, p. 3185-3198.
http://dx.doi.org/10.1007/s10661-011-2181-9. PMid:21713475
http://dx.doi.org/10.1007/s10661-011-218...
); therefore, many habitats remain un-sampled and the
taxonomic richness of river benthos is substantially underestimated in surveys
(Hughes et al., 2012Hughes, RM., Herlihy, AT., Gerth, WJ. and Pan, Y., 2012. Estimating
vertebrate, benthic macroinvertebrate, and diatom taxa richness in raftable
Pacific Northwest rivers for bioassessment purposes. Environmental Monitoring
and Assessment, vol. 184, no. 5, p. 3185-3198.
http://dx.doi.org/10.1007/s10661-011-2181-9. PMid:21713475
http://dx.doi.org/10.1007/s10661-011-218...
).
To complement traditional macroinvertebrate sampling, especially when concurrent with fish sampling, some authors have suggested using stomach content analysis of benthophagous fishes (Callisto et al., 2002Callisto, M., Vono, V., Barbosa, FAR. and Santeiro, S., 2002. Chironomidae as a food resource for Leporinus amblyrhynchus (Teleostei: Characiformes) and . Pimelodus maculatus (Teleostei: Siluriformes) in a Brazilian reservoirLundiana, vol. 3, no. 1, p. 67-73.; Russo et al., 2002Russo, MR., Ferreira, A. and Dias, RM., 2002. Disponibilidade de invertebrados aquáticos para peixes bentófagos de dois riachos da bacia do rio Iguaçu, Estado do Paraná. Acta Scientiarum: Biological Sciences, no. 2, p. 411-417.; Galina and Hahn, 2004Galina, AB. and Hahn, NS., 2004. Atividade de forrageamento de spp (Characidae, Triportheinae) utilizada como ferramenta de amostragem da entomofauna, na área do reservatório de Manso, MT. TriportheusRevista Brasileira de Zoociências, vol. 6, no. 1, p. 81-92.). The rationale for using fish gut contents as a tool to assess benthic macroinvertebrate communities is based on two factors. 1) Morphological and physiological adaptations aid fish in finding and consuming macroinvertebrates from many substrates and micro-habitats that are difficult to sample with conventional sediment sampling gear in large, deep, fast rivers (Gerking, 1994Gerking, SD., 1994. Feeding Ecology of Fish. San Diego: Academic Press. 416 p.; Fugi et al., 2001Fugi, R., Agostinho, AA. and Hahn, NS., 2001. Trophic morphology of five benthic-feeding fish species of a tropical floodplain. Revista Brasileira de Biologia = Brazilian Journal of Biology, vol. 61, no. 1, p. 27-33.). 2) Most environmental studies in Brazil focus only on the fish fauna, especially those involved with environmental licensing. Therefore, stomach contents analysis of benthophagous fishes can easily yield ancillary information about benthic macroinvertebrate communities.
We evaluated the efficacy of using stomach content analysis of three commonly occurring benthophagous fishes belonging to three different orders and foraging strategies (Eigenmannia virescens (Valenciennes, 1836) - Gymnotiformes, electrical; Iheringichthys labrosus (Lütken, 1874) - Siluriformes, olfactory; and Leporinus amblyrhynchus Garavello and Britski, 1987 - Characiformes, visual) as a proxy for providing information about benthic macroinvertebrate communities. We tested three hypotheses: 1) benthic macroinvertebrate taxa in fish stomachs and sediments are similar; 2) the proportional abundances of benthic macroinvertebrate taxa in fish stomachs and sediments are similar, especially when assessed by habitat type; and 3) samples from benthophagous fish can add taxa to inventories quicker than additional sediment samples.
2 Material and Methods
2.1 Study area
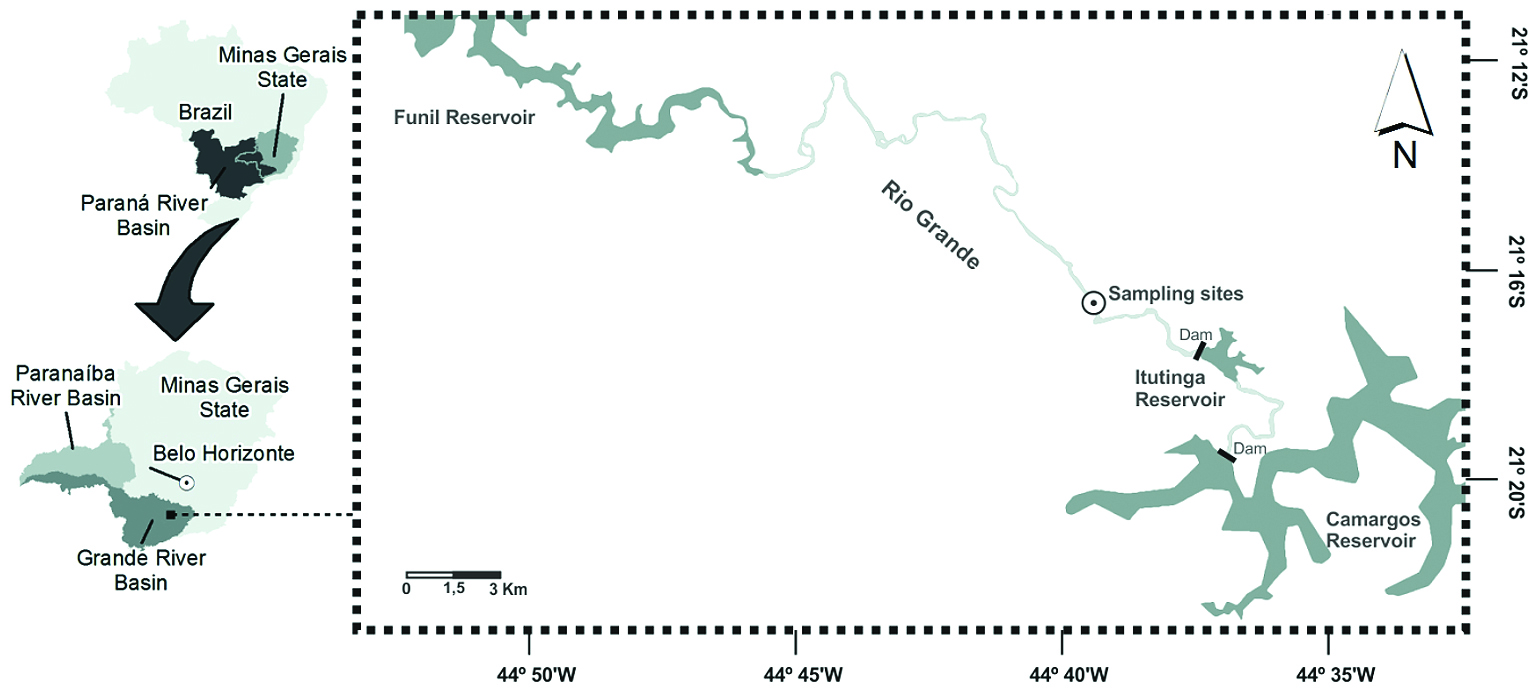
The Rio Grande, located in the state of Minas Gerais, southeast Brazil (Figure 1), is a highly regulated river (12 hydroelectric power plants and dams installed along the river’s length) with a length of 1,300 km and a catchment area of 143,000 km2 (Santos, 2010Santos, GB., 2010. A ictiofauna da bacia do Alto Paraná (rio Grande e rio Paranaíba). MG Biota, vol. 2, no. 6, p. 1-56.). The sampling stations were located in a river reach located about 5 km downstream of the Itutinga Reservoir in the upper area of the Rio Grande (Figure 1).

The region’s climate is humid subtropical (Köppen-Geiger classification: Cwb) with dry winters (April-September, mean 107 ± 12 mm precipitation month –1) and wet summers (October-March, mean 1410 ± 156 mm precipitation month –1) (Van Den Berg and Oliveira-Filho, 2000Van Den Berg, E. and Oliveira-Filho, AT., 2000. Composição florística e estrutura fitossociológica de uma floresta ripária em Itutinga, MG, e comparação com outras áreas. Revista Brasileira de Botânica, vol. 23, no. 3, p. 231-253.). The vegetation is cerrado (tropical savanna) (Van Den Berg and Oliveira-Filho, 2000Van Den Berg, E. and Oliveira-Filho, AT., 2000. Composição florística e estrutura fitossociológica de uma floresta ripária em Itutinga, MG, e comparação com outras áreas. Revista Brasileira de Botânica, vol. 23, no. 3, p. 231-253.).
2.2 Ecological sampling
We sampled benthic macroinvertebrates and fish for six consecutive days in each of the three different periods of the hydrological regime in 2010: January (high water level), March (falling water) and July (low water level). We sampled biota from three different habitat types (backwater, beach, riffle) (Table 1). Because of the relative low number of fish stomachs collected from each sampling, we did not consider seasonal variations.
2.2.1 Fish sampling and stomach contents analysis
We collected fish using two gill nets (each net 10 m X 1.6 m, 2.4 to 16 cm between opposing knots) placed in the three different habitat types (Table 1) in each of the three seasons, exposed for 24 hours and inspected at 06:00 and 18:00, during six consecutive days (total of 36 samples). All captured specimens and their stomachs were fixed in a 10% formalin solution in the field. In the laboratory, we measured each fish’s standard length and weight, tagged each specimen, and placed it in 70% alcohol. Because of their greater abundances and foraging capacities, three benthophagous fish species were selected for stomach contents analysis. We evaluate 16 Eigenmannia virescens with sizes ranging from 12 to 19 cm standard length, 15 Iheringichthys labrosus ranging from 5 to 14 cm standard length, and 13 Leporinus amblyrhynchus ranging from 14 to 20 cm standard length. The stomachs were dissected and the food items found were identified (Gandini et al., 2012Gandini, CV., Boratto, IA., Fagundes, DC. and Pompeu, PS., 2012. Estudo da alimentação dos peixes no rio Grande a jusante da usina hidrelétrica de Itutinga, Minas Gerais, Brasil. Revista Brasileira de Biologia = Brazilian Journal of Biology, vol. 102, no. 1, p. 56-61.).
2.2.2 Benthic macroinvertebrates
We collected benthic macroinvertebrates from sediments through use of a Petersen dredge (0.0375 m²). During each of the six consecutive days, four replicates were collected from each of three habitat types in each of three periods giving a total of 216 benthic macroinvertebrate samples. The samples were washed through 1.0, 0.5 and 0.25 mm sieves and preserved in 70% alcohol. Individuals from both stomachs and sediments were identified to family level, whenever possible, by using taxonomic keys (Pérez, 1988Pérez, GAR., 1988. Guía para el estudio de los macroinvertebrados acuáticos del Departamento de Antioquia. Bogotá: Colciencias. 217 p.; Merritt and Cummins, 1998Merritt, RW. and Cummins, KW., 1998. An introduction to the aquatic insects of North America. 3rd ed. Iowa: Kendall Hunt. 750 p.; Mugnai et al., 2010Mugnai, R., Nessimian, JL. and Baptista, DF., 2010. Manual de identificação de macroinvertebrados aquáticos do estado do Rio de Janeiro. Rio de Janeiro: Technical Brooks. 173 p.). Voucher specimens were deposited in the reference collection of the Instituto de Ciências Biológicas of the Universidade Federal de Minas Gerais.
2.3 Data analyses
To run all the following analyses, the data from sediment and stomachs were standardized. For each taxon, the number of individuals within each sample was divided by the total number of individuals (sediment samples) and the volume within each stomach was divided by the total volume (fish stomachs).
To test hypothesis 1 we used an analysis of similarity (ANOSIM, α = 0.05) with
log (x+1) transformed data from the Bray-Curtis distances to assess the
significance of differences between benthic macroinvertebrate composition of
samples from fish stomachs and sediments. ANOSIM analyses were performed with
PRIMER 6.0 (Anderson et al., 2008Anderson, MJ., Gorley, RN. and Clarke, KR., 2008. PERMANOVA+ for
PRIMER: Guide to Software and Statistical Methods. Plymouth: PRIMER-E Ltd. 190
p.).
ANOSIM values of R > 0.75 indicate distinct groups, 0.50 < R < 0.75
indicates separate but moderately overlapping groups, 0.25 < R < 0.50
indicates separate but strongly overlapping groups, and R < 0.25 represents
groups that cannot be distinguished (Maroneze
et al., 2011aMaroneze, DM., Tupinambás, TH., França, JS. and Callisto, M., 2011a.
Effects of flow reduction and spillways on the composition and structure of
benthic macroinvertebrate communities in a Brazilian river reach. Brazilian
journal of biology = Revista brasileira de biologia, vol. 71, no. 3, p. 639-651.
http://dx.doi.org/10.1590/S1519-69842011000400008.
PMid:21881787
http://dx.doi.org/10.1590/S1519-69842011...
). A randomization process using Monte Carlo testing
with 9,999 interactions was conducted to validate the R values observed. A value
of p < 0.05 indicates that the R value observed was not randomly
obtained.
To test our second hypothesis, we first used Spearman’s correlation analyses to assess the significant correlations between macroinvertebrate taxa from sediment samples against those from fish stomachs. For those that were significant, we then regressed the log (x+1) transformed relative abundances of benthic macroinvertebrate taxa from the sediment from those in fish stomachs to illustrate some alimentary preferences. We used STATISTICA 7.0 software (StatSoft, 2007Statsoft, INC., 2007. STATISTICA: data analysis software system. Software version 8.0. Available from: <www.statsoft.com>. Access in: 12 July 2012.) in both analyses.
To test our third hypothesis, we calculated and plotted the cumulative observed richness for benthic macroinvertebrate families from stomach contents and sediment samples through use of EstimateS 8.2.0 (Colwell, 2009Colwell, RK., 2009. EstimateS: statistical estimation of species richness and shared species from samples. Software version 8.2.0.). We used STATISTICA 7.0 software (StatSoft, 2007Statsoft, INC., 2007. STATISTICA: data analysis software system. Software version 8.0. Available from: <www.statsoft.com>. Access in: 12 July 2012.) for graphs. To test for statistically significant differences in macroinvertebrate assemblage composition between stomach and sediment samples we used a test of homogeneity of dispersions (PERMDISP) with PRIMER 6.0 software (Anderson et al., 2008Anderson, MJ., Gorley, RN. and Clarke, KR., 2008. PERMANOVA+ for PRIMER: Guide to Software and Statistical Methods. Plymouth: PRIMER-E Ltd. 190 p.). PERMDISP (permutational analysis of multivariate dispersions) calculates the distances between observations and their centroids for a group, and then compares the averages of these distances among groups through use of ANOVA. We conducted pairwise tests to assess the significance of differences. We assumed that the greater the dispersion or variability, the more effective the method is at sampling a wide range of taxa.
3 Results
We collected 33 macroinvertebrates taxa from the 216 sediment samples and 23 taxa from the 44 fish stomach samples (Table 2). We collected 20 taxa from E. virescens, 6 taxa from I. labrosus and 10 taxa from L. amblyrhinchus. Chironomids were the dominant group in both sediment (>80%) and fish stomach (> 63%) samples. Thirteen taxa were collected from sediments but not fish stomachs, and one taxon (Philopotamidae) found in the stomachs of L. amblyrhinchus was not present in the sediment samples (Table 2).
Proportional abundances (mean and standard deviation) and total richness of benthic macroinvertebrate assemblage samples from sediment and fish stomachs.
The Global R values obtained by ANOSIM indicated that benthic macroinvertebrate taxa from fish stomachs were significantly separated from those from sediment samples (Table 3). However, there was strong overlapping between fish and sediment samples from backwater and beach habitats, and fish and sediment samples from riffle habitats were indistinguishable.
ANOSIM results comparing macroinvertebrate taxa collected from sediment versus fish stomachs.
We observed significant and positive correlations in macroinvertebrate abundances only between sediment samples and E. virescens, especially in riffle habitats (Table 4). However, E. virescens consumed several taxa at proportionately greater rates than occurred in the sediments (Figure 2).
Spearman correlations comparing macroinvertebrate abundances in fish stomachs with those in sediment samples from different habitat types.

Relationship between the abundances of benthic macroinvertebrate taxa in E. virescens stomach contents and riffle habitats. Taxa above the 45° degree line were collected in proportionately greater abundance by E. virescens than they occurred in riffle sediments.
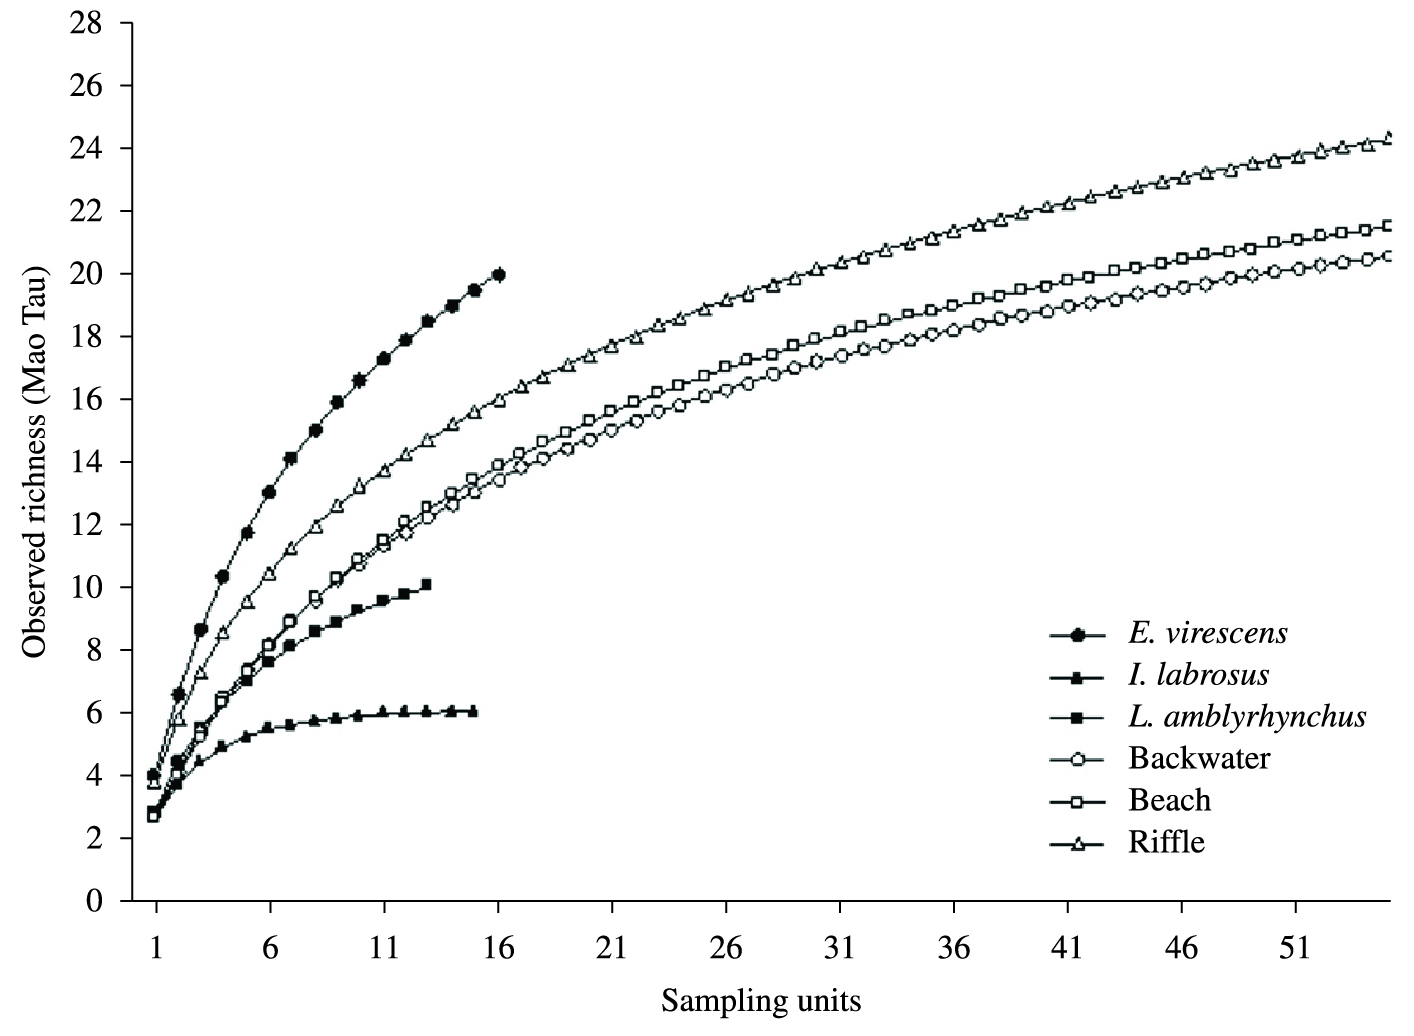
Comparing taxa accumulation curves for fish stomach and sediment samples we observed that E. virescens had a relatively high potential to collect benthic macroinvertebrate taxa (Figure 3). The PERMIDISP analysis revealed significant greater differences in benthic macroinvertebrate community dispersions from fish stomach samples than from sediment samples (F = 18.513; p = 0.001; Table 5). The dispersion of benthic macroinvertebrate taxa from E. virescens and I. labrosus were significantly different from those from backwater and beach sediments, but not from riffle sediments. Leporinus amblyrhynchus had the greatest mean dispersion of all (Table 5).

Taxa accumulation curves of benthic macroinvertebrates from fish stomach and sediment samples from three habitat types.
Average distance to the centroid and standard errors from PERMIDISP analysis, comparing the variability in benthic macroinvertebrate assemblages collected from fish stomachs and sediments. The superscript letters represent pairwise tests indicating significant differences among samples.
4 Discussion
Dominance of chironomids is common in stomachs of E. virescens
(Castro and Cassati, 1997Castro, RMC. and Cassati, L., 1997. The fish fauna from a small
forest stream of the upper Paraná river basin, Southeastern Brazil.
Ichthyological Exploration of Freshwaters, vol. 7, p. 337-352.; Tupinambás et al., 2007Tupinambás, TH., Callisto, M. and Santos, GB., 2007. Benthic
macroinvertebrate assemblages structure in two headwater streams, south-eastern
Brazil. Revista Brasileira de Zoologia, vol. 24, no. 4, p. 887-897.
http://dx.doi.org/10.1590/S0101-81752007000400005.
http://dx.doi.org/10.1590/S0101-81752007...
; Brandão-Gonçalves et al., 2009Brandão-Gonçalves, L., Lima-Junior, E. and Suarez, YR., 2009.
Hábitos alimentares de Eigenmann, 1908 (Characidae), em diferentes riachos da
sub-bacia do Rio Guiraí, Mato Grosso do Sul, Brasil. Bryconamericus
stramineusBiota Neotropica, vol. 9, no. 1, p. 135-143.
http://dx.doi.org/10.1590/S1676-06032009000100016.
http://dx.doi.org/10.1590/S1676-06032009...
), I. labrosus
(Fagundes et al., 2008Fagundes, CK., Behr, ER. and Kotzian, CB., 2008. Diet of
(Siluriformes, Pimelodidae) in the Ibicuí River, Southern Brazil.
Iheringichthys labrosusIheringia: Série Zoologia, vol. 98,
no. 1, p. 60-65.
http://dx.doi.org/10.1590/S0073-47212008000100008.
http://dx.doi.org/10.1590/S0073-47212008...
; Maroneze et al., 2011bMARONEZE, DM., TUPINAMBÁS, TH, ALVES, CBM, VIEIRA, F., POMPEU, PS.
and CALLISTO, M., 2011b. Fish as ecological tools to complement biodiversity
inventories of benthic macroinvertebrates. Hydrobiologia, vol. 673, no. 1, p.
29-40.; Masdeu et al., 2011Masdeu, M., Mello, FT., Loureiro, M. and Arim, M., 2011. Feeding
habits and morphometry of . Iheringichthys labrosus (Lütken,
1874) in the Uruguay River (Uruguay)Neotropical Ichthyology, vol. 9, no. 3, p.
657-664. http://dx.doi.org/10.1590/S1679-62252011005000034.
http://dx.doi.org/10.1590/S1679-62252011...
), and L. amblyrhynchus
(Callisto et al., 2002Callisto, M., Vono, V., Barbosa, FAR. and Santeiro, S., 2002.
Chironomidae as a food resource for Leporinus amblyrhynchus
(Teleostei: Characiformes) and . Pimelodus maculatus
(Teleostei: Siluriformes) in a Brazilian reservoirLundiana, vol. 3, no. 1, p.
67-73.; Mendonça et al., 2004Mendonça, FP., Hahn, NS. and Loureiro-Crippa, VE., 2004. Feeding
aspects of (Characiformes: Anostomidae) in the first stages of formation of a
Neotropical reservoir, Brazil. Leporinus
amblyrhynchusNeotropical Ichthyology, vol. 2, no. 3, p. 145-150.
http://dx.doi.org/10.1590/S1679-62252004000300006.
http://dx.doi.org/10.1590/S1679-62252004...
; Maroneze et al., 2011bMARONEZE, DM., TUPINAMBÁS, TH, ALVES, CBM, VIEIRA, F., POMPEU, PS.
and CALLISTO, M., 2011b. Fish as ecological tools to complement biodiversity
inventories of benthic macroinvertebrates. Hydrobiologia, vol. 673, no. 1, p.
29-40.). The three fish species studied have
high foraging capacities because of their morphological and physiological
adaptations (Gerking, 1994Gerking, SD., 1994. Feeding Ecology of Fish. San Diego: Academic
Press. 416 p.; Fugi et al., 2001Fugi, R., Agostinho, AA. and Hahn, NS., 2001. Trophic morphology of
five benthic-feeding fish species of a tropical floodplain. Revista Brasileira
de Biologia = Brazilian Journal of Biology, vol. 61, no. 1, p.
27-33.). Nonetheless, the
predominance of chironomids at the site and aquatic ecosystems in general (Maroneze et al., 2011aMaroneze, DM., Tupinambás, TH., França, JS. and Callisto, M., 2011a.
Effects of flow reduction and spillways on the composition and structure of
benthic macroinvertebrate communities in a Brazilian river reach. Brazilian
journal of biology = Revista brasileira de biologia, vol. 71, no. 3, p. 639-651.
http://dx.doi.org/10.1590/S1519-69842011000400008.
PMid:21881787
http://dx.doi.org/10.1590/S1519-69842011...
) seems to drive the
food of the studied fishes. In addition, chironomid larvae have a high nutrient
content and high digestibility (Armitage,
1995Armitage, PD., 1995. Chironomidae as food. In ARMITAGE, PD.,
CRANSTON, PS. and PINDEREDS, LCV. (Eds.). The Chironomidae: the biology and
ecology of non-biting midges. New York: Chapman and Hall. p. 423-435..
http://dx.doi.org/10.1007/978-94-011-0715-0_17.
http://dx.doi.org/10.1007/978-94-011-071...
). However, some alimentary preferences have been observed in fish
species (e.g., Strauss, 1979Strauss, RE., 1979. Reliability estimates for Ivlev’s Electivity
Index, the forage ratio, and a proposed Linear Index of food selection.
Transactions of the American Fisheries Society, vol. 108, no. 4, p. 344-352.
http://dx.doi.org/10.1577/1548-8659(1979)108<344:REFIEI>2.0.CO;2.
http://dx.doi.org/10.1577/1548-8659(1979...
), especially in
E. virescens.
Benthic macroinvertebrate community composition in sediment samples and fish stomachs
exhibited low similarity. Therefore, we reject our first hypothesis; although, the
benthic macroinvertebrates in fish stomachs were more similar to those in riffle
sediments than to those in other habitats. This dissimilarity between gut contents
and sediments indicates that fish feed opportunistically, select certain prey over
others, or both (Hyslop, 1980Hyslop, EJ., 1980. Stomach contents analysis - a review of methods
and their application. Journal of Fish Biology, vol. 17, no. 4, p. 411-429.
http://dx.doi.org/10.1111/j.1095-8649.1980.tb02775.x.
http://dx.doi.org/10.1111/j.1095-8649.19...
; Kasumyan and Doving, 2003Kasumyan, AO. and Doving, KB., 2003. Taste preferences in fishes.
Fish and Fisheries, vol. 4, no. 4, p. 289-347.
http://dx.doi.org/10.1046/j.1467-2979.2003.00121.x.
http://dx.doi.org/10.1046/j.1467-2979.20...
). However, the
observed differences may arise from insufficient sample sizes, differential prey
availability, and varied prey digestion rates (Strauss, 1979Strauss, RE., 1979. Reliability estimates for Ivlev’s Electivity
Index, the forage ratio, and a proposed Linear Index of food selection.
Transactions of the American Fisheries Society, vol. 108, no. 4, p. 344-352.
http://dx.doi.org/10.1577/1548-8659(1979)108<344:REFIEI>2.0.CO;2.
http://dx.doi.org/10.1577/1548-8659(1979...
).
Our second hypothesis was that there would be positive and significant correlations
in the abundances of benthic macroinvertebrate taxa from fish stomachs and sediment
samples. We accepted this hypothesis only for E. virescens and in
all three habitat types. This suggests that E. virescens exploits
all three habitat types, despite its tendency for territorial behavior and occupancy
of pools with submerged vegetation and snags (Brandão-Gonçalves et al., 2009Brandão-Gonçalves, L., Lima-Junior, E. and Suarez, YR., 2009.
Hábitos alimentares de Eigenmann, 1908 (Characidae), em diferentes riachos da
sub-bacia do Rio Guiraí, Mato Grosso do Sul, Brasil. Bryconamericus
stramineusBiota Neotropica, vol. 9, no. 1, p. 135-143.
http://dx.doi.org/10.1590/S1676-06032009000100016.
http://dx.doi.org/10.1590/S1676-06032009...
).
The taxa accumulation curves show that E. virescens had a more rapidly ascending curve than the sediment samples. In addition, fish stomach samples had higher dispersion values than sediment samples, likely because of the high foraging capacities of the fish. L. amblyrhynchus, especially, showed significantly higher dispersion values than the other fish species and consequently added one taxa absent from the sediment and from the other fish species studied (Philopotamidae). Therefore, we conclude that stomach content analysis of at least one benthophagous fish species can be a useful proxy to assess benthic macroinvertebrates communities, and a means to add new taxa to conventional sediment samples. Consequently, we accept our third hypothesis only for E. virescens.
Because of limitations in environmental laws, it is common in Brazil to use only fish assemblages for evaluating human impacts on catchments and rivers during environmental impact evaluations and licensing processes. In those cases, stomach content analyses can be useful to amplify the assessment of human impacts, and to add additional bioindicators. To do so, we recommend focusing on mobile benthophagous fishes.
Acknowledgments
We thank colleagues that contributed to this paper from the Laboratory of Ecology of Benthos (UFMG), Laboratory of Ichthyology (UFLA) and CEMIG (P&D ANEEL). We also thank to Education Secretariat of Minas Gerais (SEE-MG) for the permission to THT attending the doctoral course at UFMG, to CNPq for PhD scholarship in Brazil, to CAPES for Sandwich PhD scholarship and to CITAB- UTAD to receive the first author during 10 months. MC received a research grant and a research fellowship from the Conselho Nacional de Desenvolvimento Científico e Tecnológico (CNPq no. 302960/2011-2 and 475830/2008-3) and from the Fundação de Amparo à Pesquisa do Estado de Minas Gerais (FAPEMIG no. PPM-00077/13).
-
(With 3 figures)
References
- Anderson, MJ., Gorley, RN. and Clarke, KR., 2008. PERMANOVA+ for PRIMER: Guide to Software and Statistical Methods. Plymouth: PRIMER-E Ltd. 190 p.
- Armitage, PD., 1995. Chironomidae as food. In ARMITAGE, PD., CRANSTON, PS. and PINDEREDS, LCV. (Eds.). The Chironomidae: the biology and ecology of non-biting midges. New York: Chapman and Hall. p. 423-435.. http://dx.doi.org/10.1007/978-94-011-0715-0_17.
» http://dx.doi.org/10.1007/978-94-011-0715-0_17 - Barbour, AMT., Gerritsen, J., Snyder, BD. and Stribling, JB., 1998. Rapid bioassessment protocols for use in streams and wadeable rivers: periphyton, benthic macroinvertebrates, and fish. 2nd ed. Washington: EPA 841-B-99-002. 339 p.
- BartsCh, LA., RICHARDSON, WB. and NAIMO, TJ., 1998. Sampling benthic macroinvertebrates in a large flood-plain river: considerations of study design, sample size, and cost. Environmental Monitoring and Assessment, vol. 52, no. 3, p. 425-439. http://dx.doi.org/10.1023/A:1005802715051.
» http://dx.doi.org/10.1023/A:1005802715051 - Brandão-Gonçalves, L., Lima-Junior, E. and Suarez, YR., 2009. Hábitos alimentares de Eigenmann, 1908 (Characidae), em diferentes riachos da sub-bacia do Rio Guiraí, Mato Grosso do Sul, Brasil. Bryconamericus stramineusBiota Neotropica, vol. 9, no. 1, p. 135-143. http://dx.doi.org/10.1590/S1676-06032009000100016.
» http://dx.doi.org/10.1590/S1676-06032009000100016 - Buss, DF. and Borges, EL., 2008. Application of Rapid Bioassessment Protocols (RBP) for benthic macroinvertebrates in Brazil: comparison between sampling techniques and mesh sizes. Neotropical Entomology, vol. 37, no. 3, p. 288-295. http://dx.doi.org/10.1590/S1519-566X2008000300007. PMid:18641899
» http://dx.doi.org/10.1590/S1519-566X2008000300007 - Callisto, M., Vono, V., Barbosa, FAR. and Santeiro, S., 2002. Chironomidae as a food resource for Leporinus amblyrhynchus (Teleostei: Characiformes) and . Pimelodus maculatus (Teleostei: Siluriformes) in a Brazilian reservoirLundiana, vol. 3, no. 1, p. 67-73.
- Castro, RMC. and Cassati, L., 1997. The fish fauna from a small forest stream of the upper Paraná river basin, Southeastern Brazil. Ichthyological Exploration of Freshwaters, vol. 7, p. 337-352.
- Chadd, R., 2010. Assessment of aquatic invertebrates. In HURFORD, C., SCHNEIDER, M. and COWXEDS, I. (Eds.). Conservation monitoring in freshwater habitats: a practical guide and case studies. Dordrecht: Springer Netherlands. p. 63-72. Available from: <http://www.springerlink.com/index/10.1007/978-1-4020-9278-7>. Access in: 9 July 2012. http://dx.doi.org/10.1007/978-1-4020-9278-7_7.
» http://dx.doi.org/10.1007/978-1-4020-9278-7_7 - Colwell, RK., 2009. EstimateS: statistical estimation of species richness and shared species from samples. Software version 8.2.0.
- Dolédec, S. and Statzner, B., 2008. Invertebrate traits for the biomonitoring of large European rivers: an assessment of specific types of human impact. Freshwater Biology, vol. 53, no. 3, p. 617-634. http://dx.doi.org/10.1111/j.1365-2427.2007.01924.x.
» http://dx.doi.org/10.1111/j.1365-2427.2007.01924.x - Dudgeon, D., Arthington, AH., Gessner, MO., Kawabata, Z., Knowler, DJ., Lévêque, C., Naiman, RJ., Prieur-Richard, AH., Soto, D., Stiassny, MLJ. and Sullivan, CA., 2006. Freshwater biodiversity: importance, threats, status and conservation challenges. Biological Reviews of the Cambridge Philosophical Society, vol. 81, no. 2, p. 163-182. http://dx.doi.org/10.1017/S1464793105006950. PMid:16336747
» http://dx.doi.org/10.1017/S1464793105006950 - Fagundes, CK., Behr, ER. and Kotzian, CB., 2008. Diet of (Siluriformes, Pimelodidae) in the Ibicuí River, Southern Brazil. Iheringichthys labrosusIheringia: Série Zoologia, vol. 98, no. 1, p. 60-65. http://dx.doi.org/10.1590/S0073-47212008000100008.
» http://dx.doi.org/10.1590/S0073-47212008000100008 - Fleituch, T., 2003. Structure and functional organization of benthic invertebrates in a regulated stream. International Review of Hydrobiology, vol. 88, no. 34, p. 332-344. http://dx.doi.org/10.1002/iroh.200390029.
» http://dx.doi.org/10.1002/iroh.200390029 - Fugi, R., Agostinho, AA. and Hahn, NS., 2001. Trophic morphology of five benthic-feeding fish species of a tropical floodplain. Revista Brasileira de Biologia = Brazilian Journal of Biology, vol. 61, no. 1, p. 27-33.
- Galina, AB. and Hahn, NS., 2004. Atividade de forrageamento de spp (Characidae, Triportheinae) utilizada como ferramenta de amostragem da entomofauna, na área do reservatório de Manso, MT. TriportheusRevista Brasileira de Zoociências, vol. 6, no. 1, p. 81-92.
- Gandini, CV., Boratto, IA., Fagundes, DC. and Pompeu, PS., 2012. Estudo da alimentação dos peixes no rio Grande a jusante da usina hidrelétrica de Itutinga, Minas Gerais, Brasil. Revista Brasileira de Biologia = Brazilian Journal of Biology, vol. 102, no. 1, p. 56-61.
- Gerking, SD., 1994. Feeding Ecology of Fish. San Diego: Academic Press. 416 p.
- Graça, MAS., 2001. The role of invertebrates on leaf litter decomposition in streams - a review. International Review of Hydrobiology, vol. 86, no. 4-5, p. 383-393. http://dx.doi.org/10.1002/1522-2632(200107)86:4/5<383::AID-IROH383>3.0.CO;2-D.
» http://dx.doi.org/10.1002/1522-2632(200107)86:4/5<383::AID-IROH383>3.0.CO;2-D - Hellawell, JM., 1986. Biological indicators of freshwater pollution and environmental management. London: Elsevier Applied Science. 546 p. http://dx.doi.org/10.1007/978-94-009-4315-5.
» http://dx.doi.org/10.1007/978-94-009-4315-5 - Hughes, RM., Herlihy, AT., Gerth, WJ. and Pan, Y., 2012. Estimating vertebrate, benthic macroinvertebrate, and diatom taxa richness in raftable Pacific Northwest rivers for bioassessment purposes. Environmental Monitoring and Assessment, vol. 184, no. 5, p. 3185-3198. http://dx.doi.org/10.1007/s10661-011-2181-9. PMid:21713475
» http://dx.doi.org/10.1007/s10661-011-2181-9 - Hyslop, EJ., 1980. Stomach contents analysis - a review of methods and their application. Journal of Fish Biology, vol. 17, no. 4, p. 411-429. http://dx.doi.org/10.1111/j.1095-8649.1980.tb02775.x.
» http://dx.doi.org/10.1111/j.1095-8649.1980.tb02775.x - Kasumyan, AO. and Doving, KB., 2003. Taste preferences in fishes. Fish and Fisheries, vol. 4, no. 4, p. 289-347. http://dx.doi.org/10.1046/j.1467-2979.2003.00121.x.
» http://dx.doi.org/10.1046/j.1467-2979.2003.00121.x - Li, L., Zheng, B. and Liu, L., 2010. Biomonitoring and bioindicators used for river ecosystems: definitions, approaches and trends. Procedia Environmental Sciences, vol. 2, p. 1510-1524. http://dx.doi.org/10.1016/j.proenv.2010.10.164.
» http://dx.doi.org/10.1016/j.proenv.2010.10.164 - Limburg, KE., Hughes, RM., Jackson, DC. and Czech, B., 2011. Population increase, economic growth, and fish conservation: collision course or savvy stewardship. Fisheries (Bethesda, Md.), vol. 36, no. 1, p. 27-35. http://dx.doi.org/10.1577/03632415.2011.10389053.
» http://dx.doi.org/10.1577/03632415.2011.10389053 - MARONEZE, DM., TUPINAMBÁS, TH, ALVES, CBM, VIEIRA, F., POMPEU, PS. and CALLISTO, M., 2011b. Fish as ecological tools to complement biodiversity inventories of benthic macroinvertebrates. Hydrobiologia, vol. 673, no. 1, p. 29-40.
- Maroneze, DM., Tupinambás, TH., França, JS. and Callisto, M., 2011a. Effects of flow reduction and spillways on the composition and structure of benthic macroinvertebrate communities in a Brazilian river reach. Brazilian journal of biology = Revista brasileira de biologia, vol. 71, no. 3, p. 639-651. http://dx.doi.org/10.1590/S1519-69842011000400008. PMid:21881787
» http://dx.doi.org/10.1590/S1519-69842011000400008 - Masdeu, M., Mello, FT., Loureiro, M. and Arim, M., 2011. Feeding habits and morphometry of . Iheringichthys labrosus (Lütken, 1874) in the Uruguay River (Uruguay)Neotropical Ichthyology, vol. 9, no. 3, p. 657-664. http://dx.doi.org/10.1590/S1679-62252011005000034.
» http://dx.doi.org/10.1590/S1679-62252011005000034 - Mendonça, FP., Hahn, NS. and Loureiro-Crippa, VE., 2004. Feeding aspects of (Characiformes: Anostomidae) in the first stages of formation of a Neotropical reservoir, Brazil. Leporinus amblyrhynchusNeotropical Ichthyology, vol. 2, no. 3, p. 145-150. http://dx.doi.org/10.1590/S1679-62252004000300006.
» http://dx.doi.org/10.1590/S1679-62252004000300006 - Merritt, RW. and Cummins, KW., 1998. An introduction to the aquatic insects of North America. 3rd ed. Iowa: Kendall Hunt. 750 p.
- Mugnai, R., Nessimian, JL. and Baptista, DF., 2010. Manual de identificação de macroinvertebrados aquáticos do estado do Rio de Janeiro. Rio de Janeiro: Technical Brooks. 173 p.
- Northcote, TG., 1988. Fish in the structure and function of freshwater ecosystems: a “top-down” view. Canadian Journal of Fisheries and Aquatic Sciences, vol. 45, no. 2, p. 361-379. http://dx.doi.org/10.1139/f88-044.
» http://dx.doi.org/10.1139/f88-044 - Pérez, GAR., 1988. Guía para el estudio de los macroinvertebrados acuáticos del Departamento de Antioquia. Bogotá: Colciencias. 217 p.
- Reece, PF. and Richardson, JS., 2000. Benthic macroinvertebrate assemblages of coastal and continental streams and large rivers of southwestern British Columbia, Canada. Hydrobiologia, vol. 439, no. 1/3, p. 77-89. http://dx.doi.org/10.1023/A:1004105820586.
» http://dx.doi.org/10.1023/A:1004105820586 - Rosenberg, DM. and Resh, VH., 1993. Introduction to freshwater biomonitoring and benthic macroinvertebrates. In ROSENBERG, DM. and RESH, VH. (Eds.). Freshwater biomonitoring and benthic macroinvertebrates. New York: Chapman and Hall. p. 1-9.
- Russo, MR., Ferreira, A. and Dias, RM., 2002. Disponibilidade de invertebrados aquáticos para peixes bentófagos de dois riachos da bacia do rio Iguaçu, Estado do Paraná. Acta Scientiarum: Biological Sciences, no. 2, p. 411-417.
- Santos, GB., 2010. A ictiofauna da bacia do Alto Paraná (rio Grande e rio Paranaíba). MG Biota, vol. 2, no. 6, p. 1-56.
- Statsoft, INC., 2007. STATISTICA: data analysis software system. Software version 8.0. Available from: <www.statsoft.com>. Access in: 12 July 2012.
- Strauss, RE., 1979. Reliability estimates for Ivlev’s Electivity Index, the forage ratio, and a proposed Linear Index of food selection. Transactions of the American Fisheries Society, vol. 108, no. 4, p. 344-352. http://dx.doi.org/10.1577/1548-8659(1979)108<344:REFIEI>2.0.CO;2.
» http://dx.doi.org/10.1577/1548-8659(1979)108<344:REFIEI>2.0.CO;2 - Tupinambás, TH., Callisto, M. and Santos, GB., 2007. Benthic macroinvertebrate assemblages structure in two headwater streams, south-eastern Brazil. Revista Brasileira de Zoologia, vol. 24, no. 4, p. 887-897. http://dx.doi.org/10.1590/S0101-81752007000400005.
» http://dx.doi.org/10.1590/S0101-81752007000400005 - Tupinambás, TH., Cortes, RMV., Varandas, SG., Hughes, SJ., França, JS. and Callisto, M., 2014. Taxonomy, metrics or traits? Assessing macroinvertebrate community responses to daily flow peaking in a highly regulated Brazilian river system. Ecohydrology, vol. 7, no. 2, p. 828-842. http://dx.doi.org/10.1002/eco.1406.
» http://dx.doi.org/10.1002/eco.1406 - Van Den Berg, E. and Oliveira-Filho, AT., 2000. Composição florística e estrutura fitossociológica de uma floresta ripária em Itutinga, MG, e comparação com outras áreas. Revista Brasileira de Botânica, vol. 23, no. 3, p. 231-253.
Publication Dates
-
Publication in this collection
Jan-Mar 2015
History
-
Received
11 June 2013 -
Accepted
07 Oct 2013