The Campo River basin is located on the third plateau of the Paraná State or trap plateau of Paraná, at the middle portion between the rivers Ivaí and Piquiri, southern Brazil, between the coordinates 23° 53 and 24° 10’ South Latitude and 52° 15’ and 52° 31’ West Longitude. The basin has 384 Km² area, being 247 km2 in the municipality of Campo Mourão and 137 km2 in the municipality of Peabiru, in Paraná State. The Campo River is a left bank tributary of the Mourão River, which flows into the Ivaí River. The objective of this study was to monitor water quality in the Km 119 River and the Campo River, tributaries of the Mourão River, with monthly collection of water samples to determine pH, temperature, turbidity, biochemical oxygen demand, dissolved oxygen, fecal coliforms, total solids, total nitrogen, ammoniacal nitrogen, nitrite, nitrate and total phosphorus. The results obtained were compared with the indices established by the environmental legislation and applied in the determination of the Water Quality Index (WQI) used by the Water Institute of Paraná State, regulating environmental agency. Poor water quality in these rivers presents a worrying scenario for the region, since this river is the main source of water supply for the public system. Results of organic matter, fecal coliforms and total phosphorus were higher than the limits established by Resolution CONAMA 357/2005 to river class 2, specially at downstream of the Km 119 River and the Campo River, due to the significant influence of the urban anthropic activity by the lack of tertiary treatment and also rural by the lack of basic sanitation in this area. Results of WQI of Km 119 River and do Campo River indicated that water quality can be classified as average in 71% and good in 29% of the sites evaluated.
water quality; water resources; Anova; Tukey
Resumo
A Bacia Hidrográfica Rio do Campo está situada no terceiro planalto paranaense, na porção média entre os rios Ivaí e Piquiri, Sul do Brasil, entre as coordenadas 23° 53’ e 24°10’ de Latitude Sul e 52°15’ e 52°31’ de Longitude Oeste. A bacia ocupa área de 384 Km2, sendo 247 km2 no município de Campo Mourão e 137 km2 no município de Peabiru, no estado do Paraná. O Rio do Campo é um afluente da margem esquerda do Rio Mourão, que deságua no Rio Ivaí. O objetivo deste trabalho foi monitorar a qualidade da água do rio Km 119 e rio do Campo, afluentes do Rio Mourão, com coletas mensais de amostras de água para determinação do pH, temperatura, turbidez, demanda bioquímica de oxigênio, oxigênio dissolvido, coliformes fecais, sólidos totais, nitrogênio total, nitrogênio amoniacal, nitrito, nitrato e fósforo total. Os resultados obtidos foram comparados aos limites estabelecidos na legislação ambiental vigente para poluentes na água e aplicados na determinação do Índice de Qualidade das Águas (IQA) usado pelo Instituto das Águas do Paraná, órgão ambiental fiscalizador. A má qualidade observada nestes rios é preocupante para a região que usufruiu destas águas como principal fonte de abastecimento público. Resultados de matéria orgânica, coliformes totais e fósforo total extrapolaram os padrões estabelecidos na Resolução CONAMA 357/2005 para rio classe 2, especialmente à jusante do rio Km 119 e do Rio do Campo, devido à influência significativa da atividade antrópica urbana pela falta de tratamento terciário e rural pela falta de saneamento básico nesta área. Os resultados do IQA do Rio Km 119 e Rio do Campo indicam que as águas podem ser classificadas com qualidade média em 71% e boa em 29% nos pontos avaliados.
qualidade das águas; recursos hídricos; Anova; Tukey
1 Introduction
The quality of life is directly related to availability and quality of water consumed. Population growth, industrial development and disordered land occupation has contributed to the worsening of the contamination and consequently the lack of preservation of surface and groundwater sources (Demirak et al., 2006Demirak, A., Yilmaz, F., Tuna, A.L. and Ozdemir, N., 2006. Heavy metals in water, sediment and tissues of . Leuciscus cephalus from a stream in Southwestern TurkeyChemosphere, vol. 63, no. 9, pp. 1451-1458. http://dx.doi.org/10.1016/j.chemosphere.2005.09.033. PMid:16325225.
http://dx.doi.org/10.1016/j.chemosphere....
).
The relationship between land use and changes in water courses may be influenced by organic, physical, chemical and bacteriological pollution caused by urban and industrial supply, discharge of sewage and industrial effluents, and runoff in urban areas. In rural areas, these changes can result from the consumptive use of water for crop irrigation, use of pesticides and fertilizers, animal waste, deforestation, fires, and inappropriate use of techniques and procedures for management that cause soil erosion, and drainage water from rural roads (Goldstein et al., 2007Goldstein, R.M., Carlisle, D.M., Meador, M.R. and Short, T.M., 2007. Can basin land use effects on physical characteristics of streams be determined broad geographic scales? Environmental Monitoring and Assessment, vol. 130, no. 1-3, pp. 495-510. http://dx.doi.org/10.1007/s10661-006-9439-7. PMid:17106774.
http://dx.doi.org/10.1007/s10661-006-943...
).
Beyond pollution of water bodies, these factors can cause damage to biota and humans (Margalef, 1991Margalef, R., 1991. Teoria de los sistemas ecologicos. 2nd ed. Barcelona: Universitat de Barcelona, p. 290.; Villela et al., 2007Villela, I.V., Oliveira, I.M., Silveira, J.C., Dias, J.F., Henriques, J.A.P. and Silva, J., 2007. Assessment of environmental stress by the micronucleus and comet assays on . Limnoperna fortunei exposed to Guaíba hydrographic region samples (Brazil) under laboratory conditionsMutation Research/Genetic Toxicology and Environmental Mutagenesis, vol. 628, no. 2, pp. 76-86. http://dx.doi.org/10.1016/j.mrgentox.2006.12.001. PMid:17267262.
http://dx.doi.org/10.1016/j.mrgentox.200...
).
In recent decades, the disordered occupation of the Campo River basin has contributed to contamination of water and soil, degradation of fauna and flora, due to agricultural, urban and industrial uses, poorly maintained rural roads, power generation (Mourão Hydroelectric Power Plant) and water supply (Water Treatment Plants of Km 119 and Campo).
Water quality study in this basin is relevant for the population of the region, since about 80% of Campo Mourão municipality water supplying comes from the Campo River. The Km 119 and Campo rivers are tributaries of the Mourão River that flows into the Ivaí River, main river of the Ivaí River basin, with total length of approximately 671 km and drainage area of 36,587 km2.
The monitoring of water quality through physical, chemical and microbiological parameters of the main river and its tributaries in a watershed enables to obtain important information for watershed management, with current diagnosis and prediction of the future (Huntsaker and Levine, 1995Huntsaker, C.T. and Levine, D.A., 1995. Hierarchical approaches to the study of water quality in rivers: spatial scale and terrestrial processes are important in developing models to translate research results to management practices. Bioscience, vol. 45, no. 3, pp. 195-203.; Moreno and Callisto, 2004Moreno, P. and Callisto, M., 2004. Bioindicadores de qualidade de água ao longo da bacia do Rio das Velhas (MG). In: V. L. FERRACINI, S.C.N. QUEIROZ and M.P. SILVEIRA, eds. Bioindicadores de qualidade da água. Jaguariúna: Embrapa, pp. 95-116.; Ioris et al., 2008Ioris, A.A.R., Hunter, C. and Walker, S., 2008. The development and application of water management sustainability indicators in Brazil and Scotland. Journal of Environmental Management, vol. 88, no. 4, pp. 1190-1201. http://dx.doi.org/10.1016/j.jenvman.2007.06.007. PMid:17681672.
http://dx.doi.org/10.1016/j.jenvman.2007...
).
The Brazilian classification of surface waters according to the quality required for main purposes is based on the Conama Resolution 357 from 2005 (Brasil, 2005BRASIL. Ministério do Meio Ambiente, 2005. Resolução n° 357, de 17 de março de 2005. Dispõe sobre a classificação dos corpos de água e diretrizes ambientais para o seu enquadramento, bem como estabelece as condições e padrões de lançamento de efluentes, e dá outras providências. Diário Oficial da República Federativa do Brasil, Brasília, 18 mar. Seção 1, pp. 58-63.). Water courses belonging to the Ivaí River basin were classified as class 2 in the SUREHMA Ordinance 19, from May 12nd, 1992 (Paraná, 1992PARANÁ. Superintendência de Desenvolvimento de Recursos Hídricos e Saneamento Ambiental, 1992. Portaria n° 19, de 12 de maio de 1992. Dispõe sobre o enquadramento dos cursos d’água da bacia do Rio Ivaí. Diário Oficial do Estado do Paraná, Curitiba, 28 maio. Seção 1, pp. 1-2.). According to Conama 357/05 (Brasil, 2005BRASIL. Ministério do Meio Ambiente, 2005. Resolução n° 357, de 17 de março de 2005. Dispõe sobre a classificação dos corpos de água e diretrizes ambientais para o seu enquadramento, bem como estabelece as condições e padrões de lançamento de efluentes, e dá outras providências. Diário Oficial da República Federativa do Brasil, Brasília, 18 mar. Seção 1, pp. 58-63.), the class 2 refers to waters for human supply after conventional treatment, irrigation of vegetables and fruit plants, among other uses of direct contact with the public.
In Brazil, the Water Quality Index (WQI) was firstly used from 1975 (ANA, 2009AGÊNCIA NACIONAL DE ÁGUAS – ANA, 2009 [viewed 12 April 2013]. Indicadores de qualidade – índice de qualidade das águas [online]. Available from: http://pnqa.ana.gov.br/IndicadoresQA/IndiceQA.aspx>Access.
http://pnqa.ana.gov.br/IndicadoresQA/Ind...
). The WQI was created by the National Sanitation Foundation in 1970 in the United States, and represents a tool for analysis of quality of water bodies, gathering diverse information into a single numerical result (Almeida and Schwarzbold, 2003Almeida, M.A.B. and Schwarzbold, A., 2003. Avaliação sazonal da qualidade das águas do Arroio da Cria Montenegro, RS com aplicação de um Índice de Qualidade de Água (IQA). Revista Brasileira de Recursos Hídricos, vol. 8, no. 1, pp. 81-97.).
The present study sought to perform a diagnosis of water quality in river Km 119 and Campo to compare the results obtained with the indexes established by the environmental legislation and also determine the Water Quality Index (WQI).
2 Material and Methods
2.1 Study area
The Campo River basin is on the third plateau of the Paraná State or trap plateau of Paraná, at the middle portion between the rivers Ivaí and Piquiri, southern Brazil (Maack, 2002Maack, R., 2002. Geografia física do estado do Paraná. 3rd ed. Curitiba: Imprensa Oficial, pp. 350.), between the coordinates 23°53 and 24°10’ South Latitude and 52°15’ and 52°31’ West Longitude (Figure 1). The basin has 384 Km2 area, being 247 km2 in the municipality of Campo Mourão and 137 km2 in the municipality of Peabiru. The Campo River is a left bank tributary of the Mourão River, which flows into the Ivaí River (Crispim et al., 2012Crispim, J.Q., Malysz, S.T., Cardoso, O. and PAGLIARINI JUNIOR, S.N., 2012. Conservação e proteção de nascentes por meio do solo cimento em pequenas propriedades agrícolas na bacia hidrográfica Rio do Campo no município de Campo Mourão – PR. Revista Geonorte, vol. 3, no. 4, pp. 781-790. Edição Especial.).

Location of Mourão River basin, in Paraná State, Brazil and sampling sites (P1, P2, P3 and P4) in the area of study.
The Campo River basin has a great importance for the population of the municipality of Campo Mourão (87,194 inhabitants), with population density of approximately 144.12 inhab/km2, once about 80% of public water supply comes from the Campo River (IBGE, 2010INSTITUTO BRASILEIRO DE GEOGRAFIA E ESTATÍSTICA – IBGE [online], 2010. [viewed 10 January 2014]. Available from: http://www.ibge.gov.br
http://www.ibge.gov.br...
). The catchment area is used for urban and rural purposes, mainly soybean production, which has intensified in recent years, according to Colavite (2008)Colavite, A. P., 2008. Cartografia aplicada à análise ambiental da Bacia Hidrográfica do Rio do Campo - PR. Maringá: Universidade Estadual de Maringá, 80 p. Monografia de Especialização em Planejamento e Gerenciamento Urbano e Rural., Crispim et al. (2012)Crispim, J.Q., Malysz, S.T., Cardoso, O. and PAGLIARINI JUNIOR, S.N., 2012. Conservação e proteção de nascentes por meio do solo cimento em pequenas propriedades agrícolas na bacia hidrográfica Rio do Campo no município de Campo Mourão – PR. Revista Geonorte, vol. 3, no. 4, pp. 781-790. Edição Especial. and Villwock et al. (2013)Villwock, F.H., Crispim, J.Q. and Rocha, J.A., 2013. Levantamentos de parâmetros limnológicos na Bacia Hidrográfica do Rio do Campo – PR. In: Anais do VII Encontro de Produção Científica e Tecnológica, 2013, Campo Mourão. Campo Mourão: UNESPAR/FECILCAM, pp. 9..
Soils of the basin have volcanic origin, with a portion on the outcropping area of sandstone of the Caiuá Formation. Red latosol and red argisol are the soil types in the area occupied by the basin. The climate of the region is Cfa: mesothermal humid subtropical, with hot summer and infrequent frosts, rainfall concentrated in summer months, without well-defined dry season (Köeppen, 1948Köeppen, W., 1948. Climatologia: con um estúdio de los climas de la Tierra. México: Fondo de Cultura Economica, pp. 478.). The temperature of the coldest month ranges from + 18 °C to –3 °C and the mean of the warmest month is 22 °C. On average, rainfall indices are 1,400 mm to 1,500 mm per year (Maack, 2002Maack, R., 2002. Geografia física do estado do Paraná. 3rd ed. Curitiba: Imprensa Oficial, pp. 350.).
2.2 Sampling sites
Four sites were chosen for water sampling in the Mourão River basin - P1 and P3 – Km 119 River; P2 and P4 – Campo River, based on mapping and field researches, near urban and rural areas, covering the rivers Km 119 and Campo (Figure 1). Sites for sample collection, their respective geographical coordinates and locations on the Campo River basin are shown in Table 1.
Monthly samplings were performed from November 2012 to November 2013, totaling 12 collections. Water samples were collected about 10 cm below the surface, by the morning, and kept on ice until laboratory analysis at the Environmental Engineering Research Center, the Federal Technological University of Paraná, according to procedures in ABNT (1987)ASSOCIAÇÃO BRASILEIRA DE NORMAS TÉCNICAS – ABNT. NBR 9898: preservação e técnicas de amostragem de efluentes líquidos e corpos receptores. Rio de Janeiro: ABNT, 1987.. The following parameters were determined: pH (4500-H+), water temperature (2550), dissolved oxygen (DO, 4500-O), biochemical oxygen demand (BOD5,20, 5210), total nitrogen (TN, 4500-N), ammoniacal nitrogen (4500-NH3), nitrite (4500-NO2-), nitrate (4500-NO3-), total phosphorus (4500-P), turbidity (T, 2310), total solids (TS, 2540B) and fecal coliforms (FC, 9221) according to Eaton et al. (2005)Eaton, A.D., Clesceri, L.S., Rice, E.W. and Greenberg, A.E., eds, 2005. Standard methods for the examination of water and wastewater. 21st ed. Washington: American Public Health Association/American Water Works Association/Water Pollution Control Federation., in triplicate.
The Water Quality Index (WQI) was calculated considering the parameters pH, temperature, T, DO, BOD5,20, TN, P, TS and TC, since it is used for monitoring water quality of watersheds in the Paraná State by the Water Institute. This index is expressed as a value ranging from zero (0) to one hundred (100), classifying water samples into excellent (91-100); good (71-90), average (51-70), poor (26-50) and very poor (0-25) (Sperling, 2007Sperling, M.V., 2007. Estudos e modelagem da qualidade da água de rios. Belo Horizonte: UFMG, vol. 1, pp. 588.; Mophin-Kania and Murugesan, 2011Mophin-Kania, K. and Murugesan, A.G., 2011. Evaluation and classification of water quality of perennial River Tamirabarani through aggregation of water quality index. International Journal of Environment and Pollution, vol. 1, no. 5, pp. 24-33.) (Equation 1).
Where:
WQI = Water Quality Index (value between 0 and 100);
qi = sub index score of ith parameter, a value between 0 and 100 obtained from its average curve of quality change according to its concentration or measurement;
wi = relative weight (weight factor) of the ith parameter, a value between 0 and 100, assigned according to its importance to the overall quality;
i = number of the parameter, ranging from 1 to 9 (n = 9, i.e., the number of parameters that compose the WQI is 9).
The results of monitoring the water quality parameters in the rivers Km 119 and Campo were compared to limits set by the Conama Resolution 357/2005 (Brasil, 2005BRASIL. Ministério do Meio Ambiente, 2005. Resolução n° 357, de 17 de março de 2005. Dispõe sobre a classificação dos corpos de água e diretrizes ambientais para o seu enquadramento, bem como estabelece as condições e padrões de lançamento de efluentes, e dá outras providências. Diário Oficial da República Federativa do Brasil, Brasília, 18 mar. Seção 1, pp. 58-63.) for Class 2 in which the Ivaí River basin is classified, according to the Ordinance 19 of SUREHMA (Paraná, 1992PARANÁ. Superintendência de Desenvolvimento de Recursos Hídricos e Saneamento Ambiental, 1992. Portaria n° 19, de 12 de maio de 1992. Dispõe sobre o enquadramento dos cursos d’água da bacia do Rio Ivaí. Diário Oficial do Estado do Paraná, Curitiba, 28 maio. Seção 1, pp. 1-2.).
2.3 Data analysis
Data collected were analyzed with descriptive statistics, comparing measures of central tendency and dispersion, using statistical inference and a significance level of 5%. Statistical inference was carried out by parametric ANOVA. Tukey’s post hoc test was used to compare the means. Data of monitoring are presented in line charts and WQI results with box plots, which allow observing the central tendency and variability of the sample data. In this, it was included the median (50% percentile), the lower (25% percentile) and upper (75% percentile) quartiles and the measurement of the dispersion of the data, as the minimum and maximum values.
3 Results and Discussion
In general, values of physical-chemical parameters increased from upstream (P1 and P2) towards downstream (P3 and P4) sites of the rivers Km 119 and Campo, respectively. ANOVA revealed no difference for the mean results of pH (p-value 0.8393) and temperature (p-value 0.8393) between collected samples. The smallest variation was 0.3 (7.2-6.9) in the mean pH value between P4 and P2 and 0.1 (22-21 °C) in the mean temperature between P1 and P3 and P2 and P4. Maximum values were 9.0 at P2 and 8.4 at P4 (var. 0.6), and 26 oC at P2 (var. 2 °C) and 24 °C at P4. However, maximum pH values at sites of the Campo River are within the range (6.0-9.0) set forth by the Conama Resolution 357/2005 (Brasil, 2005BRASIL. Ministério do Meio Ambiente, 2005. Resolução n° 357, de 17 de março de 2005. Dispõe sobre a classificação dos corpos de água e diretrizes ambientais para o seu enquadramento, bem como estabelece as condições e padrões de lançamento de efluentes, e dá outras providências. Diário Oficial da República Federativa do Brasil, Brasília, 18 mar. Seção 1, pp. 58-63.) for Class 2.
The minimum pH was 5.4 at P3, which may indicate insufficient buffering capacity to maintain the environment in balance due to disposal of industrial effluents and sewage downstream of Campo Mourão municipality into the Km 119 River. The trend to acidity was associated with organic matter decay by Blume et al. (2010)Blume, K.K., Macedo, J.C., Meneguzzi, A., Silva, L.B., Quevedo, D.M. and Rodrigues, M.A.S., 2010. Water quality assessment of the Sinos River, Southern Brazil. Brazilian Journal of Biology = Revista Brasileira de Biologia, vol. 70, no. 4, (suppl.), pp. 1185-1193. http://dx.doi.org/10.1590/S1519-69842010000600008. PMid:21225160.
http://dx.doi.org/10.1590/S1519-69842010...
(6.8-7.3) in the Sinos River basin (Rio Grande do Sul State); Siqueira et al. (2012)Siqueira, G.W., Aprile, F. and Miguéis, A.M., 2012. Diagnóstico da qualidade da água do rio Parauapebas (Pará - Brasil ).Acta Amazonica, vol. 42, no. 3, pp. 413-422. http://dx.doi.org/10.1590/S0044-59672012000300014.
http://dx.doi.org/10.1590/S0044-59672012...
in the Parauapebas River basin (Tocantins State); Tarossi et al. (2006)TAROSSI, B.F., SIMÕES, R.P., OSHIRO, M.S.R., MEDEIROS, G.A. and HUSSAR, G.J., 2006. Poluição hídrica do rio Jaguari Mirim em São João da Boa Vista - SP. In: Anais do V Simpósio Brasileiro de Engenharia Ambiental, 2006, Curitiba. Curitiba: PUC PR, 2006. vol. 1, pp. 151. (6.9-7.1) and Lima et al. (2005)Lima, C.A.N.V., Beraldo, M.M., Medeiros, G.A. and Picinato, R., 2005. Caracterização ambiental do córrego São João em São João da Boa Vista - SP. In: Anais do Simpósio Brasileiro de Engenharia Ambiental, 2005, Ribeirão Preto. Ribeirão Preto: Faculdades COC, vol. 1, pp. 1-4. (5.5-7.0) in the Jaguari Mirim River basin (São Paulo State). Figure 2 shows the turbidity values of water samples from the sites P1, P2, P3 and P4.

Variation in turbidity (NTU) of water samples from the Km 119 River (P1 and P3) and Campo River (P2 and P4).
Higher values of turbidity at P2 (91.4 NTU) and P4 (95.5 NTU) on March 22nd, 2013 correspond to rainy days, with consequent higher river discharges. In accordance with Crispim et al. (2012)Crispim, J.Q., Malysz, S.T., Cardoso, O. and PAGLIARINI JUNIOR, S.N., 2012. Conservação e proteção de nascentes por meio do solo cimento em pequenas propriedades agrícolas na bacia hidrográfica Rio do Campo no município de Campo Mourão – PR. Revista Geonorte, vol. 3, no. 4, pp. 781-790. Edição Especial., another factor that has contributed to increased turbidity in the Campo River, averaging 30 - 40 NTU, is the transport of sediments from the overflow of retention boxes filled with eroded soil, from compaction and preparation for sowing, towards the slope, and from rill erosion on roadsides by the poor maintenance of rural roads. With the overflow of retention boxes, sediment is no longer retained during rainy periods, leading to increased turbidity in the river water. High turbidity in rivers may raise the cost for water treatment, whether for public supply or other purposes, and affects the aesthetics of rivers (Aprile and Siqueira, 2011Aprile, F.M. and Siqueira, G.W., 2011. Alternative treatment methods of drinking-water for river communities in Central Amazonian. In: C. BILIBIO, O. HENSEL and J. SELBACH, eds. Sustainable water management in the tropics and subtropics – and case studies in Brazil. Jaguarão: Fundação Universidade Federal do Pampa, vol. 1, pp. 1143-1166. ).
In the other sites, turbidity values were below the limit of 100 NTU, recommended by the Conama Resolution 357/2005 (Brasil, 2005BRASIL. Ministério do Meio Ambiente, 2005. Resolução n° 357, de 17 de março de 2005. Dispõe sobre a classificação dos corpos de água e diretrizes ambientais para o seu enquadramento, bem como estabelece as condições e padrões de lançamento de efluentes, e dá outras providências. Diário Oficial da República Federativa do Brasil, Brasília, 18 mar. Seção 1, pp. 58-63.) for Class 2. ANOVA indicated significant differences for mean turbidity (p-value 0.00394), and the post-hoc test identified the difference between P1 and P4, with higher variation, 30.2 NTU (54.8-24.7 NTU). Maximum values exhibited a slightly greater variation of 30.8 NTU, from P4 (95.5 NTU) to P1 (64.7 NTU) (Table 2).
Results of the statistical tests applied to the data obtained in the monitoring of physical-chemical parameters and WQI.
There was an increase in average BOD5,20 from upstream towards downstream, P2 to P4 (3.2 to 3.7 mg/L) in the Campo River, and more pronounced from the P1 to P3 (3.2 to 5.6 mg/L) in the Km 119 River (Figure 3). This increase may be related to contamination of water bodies by the disposal of effluents from sewage treatment plants - Km 119 and Campo, which serve more than 69,000 inhabitants in the urban area of the municipality of Campo Mourão. Higher BOD5,20 values were observed at P3 (downstream) in the Km 119 River, 66% of these results were above the limit of 5.0 mg/L of the Conama Resolution 357/2005 (Brasil, 2005BRASIL. Ministério do Meio Ambiente, 2005. Resolução n° 357, de 17 de março de 2005. Dispõe sobre a classificação dos corpos de água e diretrizes ambientais para o seu enquadramento, bem como estabelece as condições e padrões de lançamento de efluentes, e dá outras providências. Diário Oficial da República Federativa do Brasil, Brasília, 18 mar. Seção 1, pp. 58-63.), indicating a contamination point due to sewage discharge. The other sites remained in compliance with the legislation in 83% of samples.

Profile of biochemical oxygen demand (BOD5,20) concentration at the sampling sites investigated in the Km 119 River (P1 and P3) and Campo River (P2 and P4).
ANOVA detected significant differences for mean values of BOD5,20 between analyzed samples (p-value 0.011) and the post-hoc identified the difference between P1 and P3, i.e., upstream and downstream of the Km 119 River, respectively. The variation in the mean BOD5,20 between P1 and P3 was 2.5 (5.6-3.2 mg/L) (Table 2).
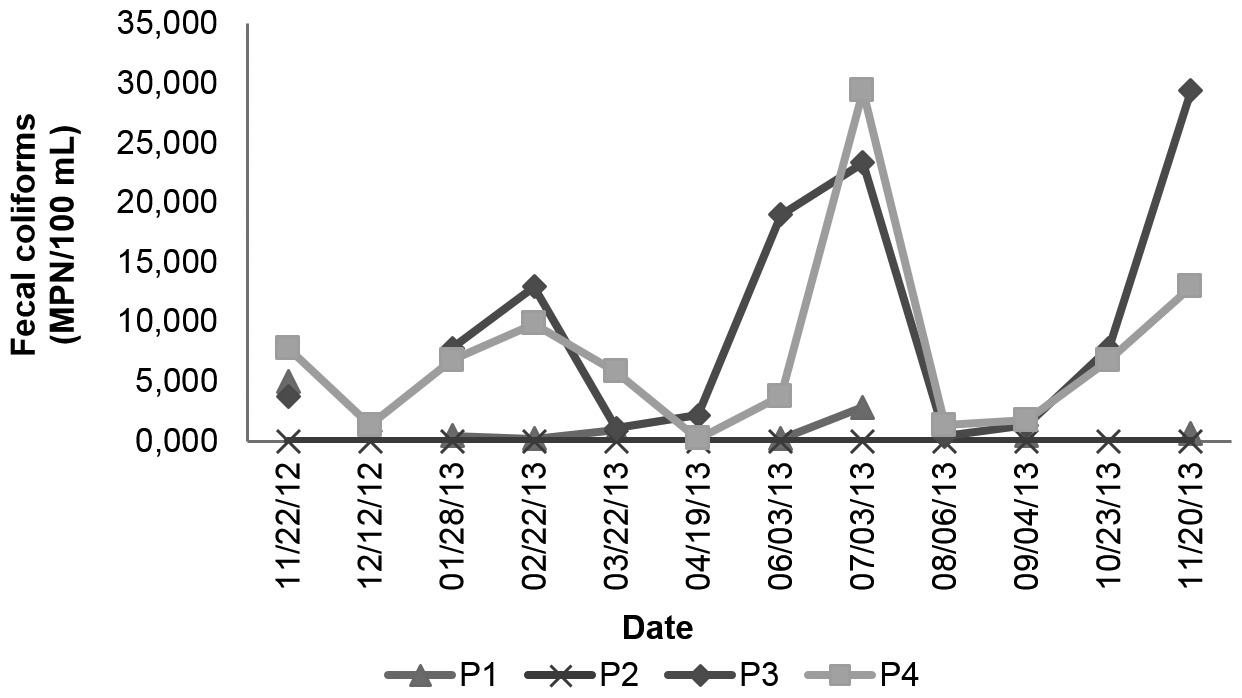
Fecal coliforms in water indicate contamination by warm-blooded animals or sewage. The presence of fecal coliforms was observed in all samples (Figure 4).

Profile of fecal coliforms (MPN/100 mL) at the sampling sites investigated in the Km 119 River (P1 and P3) and Campo River (P2 and P4).
It is important to emphasize the high count of fecal coliforms in samples of P3 (9,920 MPN/100 mL) and P4 (7,326 MPN/100 mL), reflecting the contamination of water of the rivers Km 119 and Campo, respectively, which can be related to the growing urbanization and lack of infrastructure in the region. At these sites, sewage is treated to secondary level, by biological processes, without including disinfection.
Higher values of fecal coliforms were verified on July 3rd, 2013 at P3 (23,000 MPN/100 mL upstream of Km 119 River) and P4 (29,000 MPN/100 mL, upstream of Campo River), which can be directly related to the discharge of sewage and runoff containing fecal material deposited in the drainage area. It is important to highlight a daily rainfall of about 43 mm recorded in the period from February 29th to March 2nd, 2013. At the site P3, turbid visual aspect and unpleasant odor were noticed in the water during the collection of samples.
Regarding the mean values of fecal coliforms, significant differences were evidenced between P1 and P3, according to ANOVA (p-value 0.0086) and post-hoc test, with higher values at P3 (Table 2).
The results of fecal coliforms indicate the poor quality of water in the Km 119 and Campo rivers at the sites evaluated, from 1,348 to 9,920 MPN/100 mL and from 2,413 to 7,326 MPN/100 mL (upstream to downstream). These values were superior in 16.7%, 41.7%, 83.3% and 91.7% at P1, P2, P3 and P4, respectively, relative to the limit of 1,000 MPN/100 mL set by the Conama Resolution 357/2005 (Brasil, 2005BRASIL. Ministério do Meio Ambiente, 2005. Resolução n° 357, de 17 de março de 2005. Dispõe sobre a classificação dos corpos de água e diretrizes ambientais para o seu enquadramento, bem como estabelece as condições e padrões de lançamento de efluentes, e dá outras providências. Diário Oficial da República Federativa do Brasil, Brasília, 18 mar. Seção 1, pp. 58-63.). Likewise, Rocha et al. (2006)ROcha, C.M.B.M., Rodrigues, L.S., COSTA, C.C., OLIVEIRA, P.R., SILVA, I.J., JESUS, E.F.M. and ROLIM, R.G., 2006. Avaliação da qualidade da água e percepção higiênico-sanitária na area rural de Lavras, Minas Gerais, Brasil, 1999-2000. Cadernos de Saúde Pública, vol. 22, no. 9, pp. 1967-1978. found values 63% higher than the standard in a rural area; Siqueira et al. (2012)Siqueira, G.W., Aprile, F. and Miguéis, A.M., 2012. Diagnóstico da qualidade da água do rio Parauapebas (Pará - Brasil ).Acta Amazonica, vol. 42, no. 3, pp. 413-422. http://dx.doi.org/10.1590/S0044-59672012000300014.
http://dx.doi.org/10.1590/S0044-59672012...
recorded values from 200 to 1,300 MPN/100 mL in an urban area.
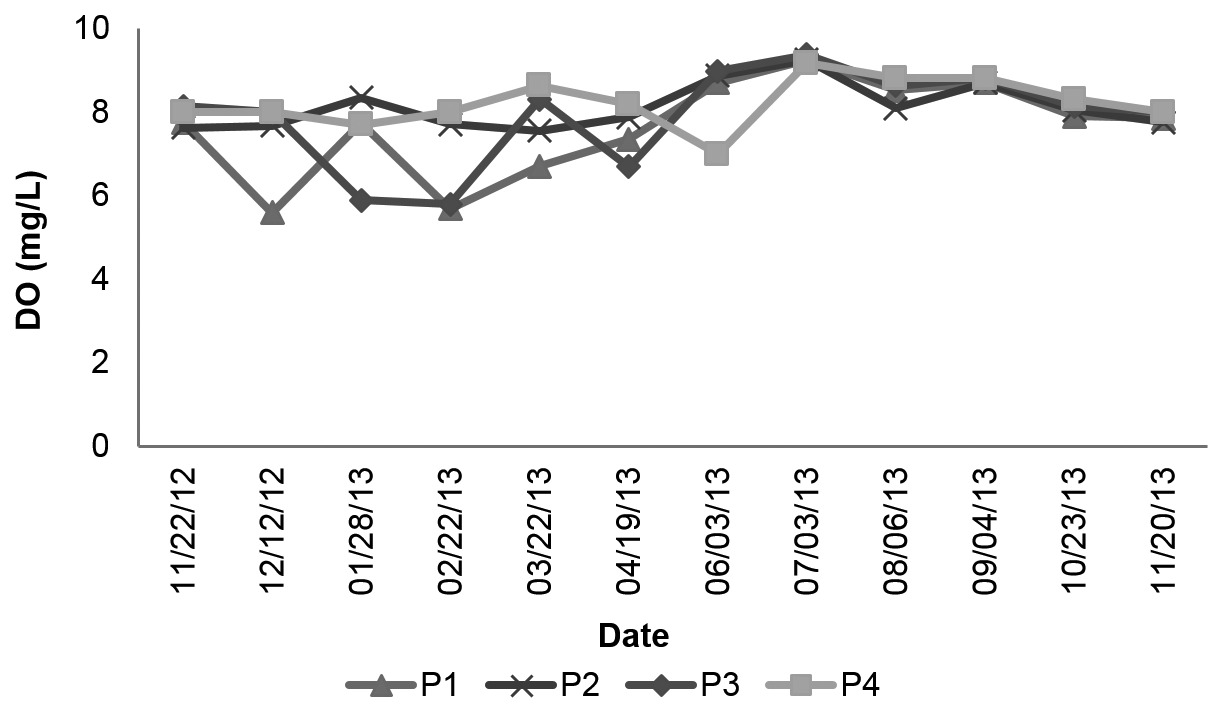
Figure 5 illustrates the temporal variation of dissolved oxygen (DO), from 5.86 to 9.3 mg/L, 7.6 to 9.3 mg/L, 5.8 to 9.4 mg/L and 7.0 to 9.2 mg/L at P1, P2, P3 and P4 sites, respectively, that is, above the limit of 5.0 mg/L of the Conama Resolution 357/2005 for Class 2 (Brasil, 2005BRASIL. Ministério do Meio Ambiente, 2005. Resolução n° 357, de 17 de março de 2005. Dispõe sobre a classificação dos corpos de água e diretrizes ambientais para o seu enquadramento, bem como estabelece as condições e padrões de lançamento de efluentes, e dá outras providências. Diário Oficial da República Federativa do Brasil, Brasília, 18 mar. Seção 1, pp. 58-63.). The high concentration of DO is explained by the rocky bottom of the rivers, which causes greater turbulence and consequent increased transfer of oxygen at the air-water interface. Villwock et al. (2013)Villwock, F.H., Crispim, J.Q. and Rocha, J.A., 2013. Levantamentos de parâmetros limnológicos na Bacia Hidrográfica do Rio do Campo – PR. In: Anais do VII Encontro de Produção Científica e Tecnológica, 2013, Campo Mourão. Campo Mourão: UNESPAR/FECILCAM, pp. 9. ascribed the high values to the lentic period (low water flow) of the water body in the Campo River basin, and to the mean temperature of 22oC. The results are similar to those registered by Silveira et al. (2003)Silveira, G.L., Silva, C.E., Irion, C.A.O., Cruz, I.C. and Retz, E.F., 2003. Balanço de cargas poluidoras pelo monitoramento quali-quantitativo dos recursos hídricos em pequena bacia hidrográfica. Revista Brasileira de Recursos Hídricos, vol. 8, no. 1, pp. 5-11. of 5.54 mg/L, Brites and Gastaldini (2007)Brites, A.P.Z. and Gastaldini, M.C.C., 2007. Avaliação da carga poluente no sistema de drenagem de duas bacias hidrográficas urbanas. Revista Brasileira de Recursos Hídricos, vol. 12, no. 4, pp. 211-221. and Lima and Medeiros (2008)Lima, C.A. and Medeiros, G.A., 2008. Diagnóstico da qualidade da água do rio Jaguari-Mirim no Município de São João da Boa Vista - SP. Engenharia Ambiental, vol. 5, no. 2, pp. 125-138. of 5.0 to 8.2 mg/L in urban and rural micro basins.

Temporal variation of dissolved oxygen (mg/L) of water samples from the Km 119 River (P1 and P3) and Campo River (P2 and P4).
The mean variation between P1 and P3 was 3.1% in the Km 119 River and 1.11% between P2 and P4 in the Campo River, with upstream values lower than those in downstream.
Maximum values of nitrite were below 1.0 mg/L recommended in the Conama Resolution 357/2005 for Class 2 (Brasil, 2005BRASIL. Ministério do Meio Ambiente, 2005. Resolução n° 357, de 17 de março de 2005. Dispõe sobre a classificação dos corpos de água e diretrizes ambientais para o seu enquadramento, bem como estabelece as condições e padrões de lançamento de efluentes, e dá outras providências. Diário Oficial da República Federativa do Brasil, Brasília, 18 mar. Seção 1, pp. 58-63.) at the sites P1 and P2 (upstream) in the rivers Km 119 (0.4 mg/L) and Campo (0.5 mg/L), respectively (Figure 6). Blume et al. (2010)Blume, K.K., Macedo, J.C., Meneguzzi, A., Silva, L.B., Quevedo, D.M. and Rodrigues, M.A.S., 2010. Water quality assessment of the Sinos River, Southern Brazil. Brazilian Journal of Biology = Revista Brasileira de Biologia, vol. 70, no. 4, (suppl.), pp. 1185-1193. http://dx.doi.org/10.1590/S1519-69842010000600008. PMid:21225160.
http://dx.doi.org/10.1590/S1519-69842010...
observed similar concentrations in an urban basin. The value of 1.0 mg/L is also recommended as maximum allowed by the Ordinance 2914/2011 of the Ministry of Health (Brasil, 2011BRASIL. Ministério da Saúde, 2011. Portaria n° 2.914, de 12 de dezembro de 2011. Dispõe sobre os procedimentos de controle e de vigilância da qualidade da água para consumo humano e seu padrão de potabilidade. Diário Oficial da República Federativa do Brasil, Brasília, 14 dez. Seção 1, pp. 39-46.).

Temporal variation of total nitrogen, ammoniacal nitrogen, nitrite and nitrate (mg/L) of water samples from the Km 119 River (P1, upstream).
There was an increase in nitrite concentrations at P3 and P3, downstream of the rivers, to maximum values of 1.2 mg/L and 5.3 mg/L, respectively, suggestive of partial decomposition of organic matter, excessive discharge from water treatment plant or industrial pollution. Nitrite in polluted waters may indicate the presence of nitrate reducing bacteria, under anaerobic conditions (Galdino and Trombini, 1985Galdino, N. S. and Trombini, R. B., 1985. Análise físico-química da água do Córrego Japira, localizado na cidade de Apucarana-PR. Revista Terra e Cultura: Cadernos de Ensino e Pesquisa, vol. 1, no. 1, pp. 16.).
The highest value of nitrate was 0.7 mg/L at P3 (downstream) in the Km 119 River, followed by 0.6 mg/L, 0.6 mg/L and 0.5 mg/L at P1, P2 and P4, respectively (Figure 7), that is, inferior to 10.0 mg/L, standard of the Conama Resolution 357/2005 for Class 2 (Brasil, 2005BRASIL. Ministério do Meio Ambiente, 2005. Resolução n° 357, de 17 de março de 2005. Dispõe sobre a classificação dos corpos de água e diretrizes ambientais para o seu enquadramento, bem como estabelece as condições e padrões de lançamento de efluentes, e dá outras providências. Diário Oficial da República Federativa do Brasil, Brasília, 18 mar. Seção 1, pp. 58-63.) and in the Ordinance 2914/2011 of the Ministry of Health (Brasil, 2011BRASIL. Ministério da Saúde, 2011. Portaria n° 2.914, de 12 de dezembro de 2011. Dispõe sobre os procedimentos de controle e de vigilância da qualidade da água para consumo humano e seu padrão de potabilidade. Diário Oficial da República Federativa do Brasil, Brasília, 14 dez. Seção 1, pp. 39-46.). Similar results were observed by Madruga et al. (2008)Madruga, F.V., Reis, F.A.G.V., Medeiros, G.A. and Giordano, L.C., 2008. Avaliação da influência do Córrego dos Macacos na qualidade da água do rio Mogi Guaçu, no Município de Mogi Guaçu – SP. Engenharia Ambiental, vol. 5, no. 2, pp. 152-168. from 1.89 to 4.21 mg/L, Romitelli and Paterniani (2007)ROMITELLI, L. and PATERNIANI, J.E.S., 2007. Diagnóstico ambiental de um trecho do Córrego Bonifácio, APA Jundiaí - SP. Engenharia Ambiental, vol. 4, no. 2, pp. 14-25. from 7.5 to 15 mg/L and Medeiros et al. (2008)Medeiros, G.A., Lima, C.A.V. and Hussar, G.J., 2008. Diagnóstico ambiental do rio Jaguari-Mirim no município de São João da Boa Vista – SP. In: Anais do VI Simpósio Brasileiro de Engenharia Ambiental, 2008, Serra Negra. Serra Negra: ASBEA, pp. 1-10. CD- ROM. from 0.1 to 1.0 mg/L in urban and rural micro basins.

Temporal variation of total nitrogen, ammoniacal nitrogen, nitrite and nitrate (mg/L) of water samples from the Campo River (P2, upstream).
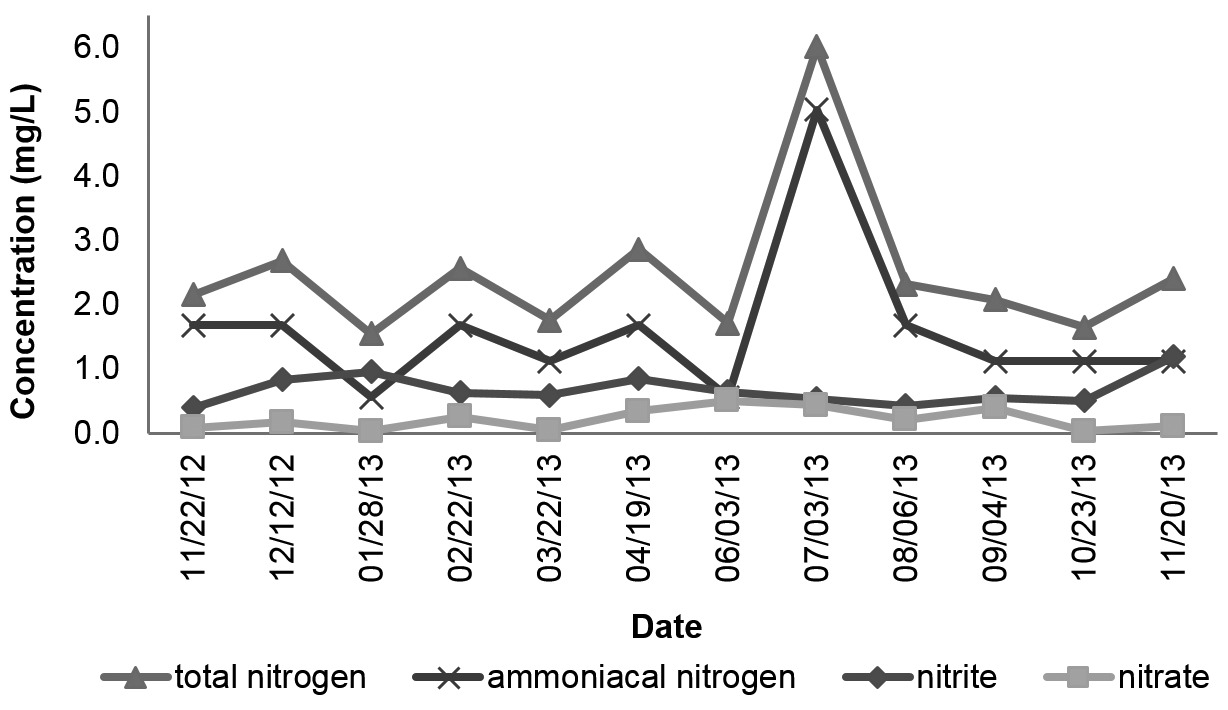
Water samples from the site P3 (upstream) in the Km 119 River showed the highest values of ammoniacal nitrogen (Figure 8) and total nitrogen (9.0 mg/L and 10.6 mg/L on July 3rd, 2013, respectively, Figure 9). pH values of the samples collected on this day was 7.28 for P3 and ammoniacal nitrogen exceeded the maximum value of 3.7 mg/L for pH ≤ 7.5 of the Conama Resolution 357/2005 for Class 2 (Brasil, 2005BRASIL. Ministério do Meio Ambiente, 2005. Resolução n° 357, de 17 de março de 2005. Dispõe sobre a classificação dos corpos de água e diretrizes ambientais para o seu enquadramento, bem como estabelece as condições e padrões de lançamento de efluentes, e dá outras providências. Diário Oficial da República Federativa do Brasil, Brasília, 18 mar. Seção 1, pp. 58-63.) and of 1.5 mg/L of the Ordinance 2914/2011 of the Ministry of Health (Brasil, 2011BRASIL. Ministério da Saúde, 2011. Portaria n° 2.914, de 12 de dezembro de 2011. Dispõe sobre os procedimentos de controle e de vigilância da qualidade da água para consumo humano e seu padrão de potabilidade. Diário Oficial da República Federativa do Brasil, Brasília, 14 dez. Seção 1, pp. 39-46.). The presence of ammoniacal nitrogen may be related to raw sewage, recent pollution and intermediate stage of pollution (Sperling, 2005Sperling, M., 2005. Introdução à qualidade das águas e ao tratamento de esgotos. 3rd ed. Belo Horizonte: UFMG, vol. 1, pp. 243.).

Temporal variation of total nitrogen, ammoniacal nitrogen, nitrite and nitrate (mg/L) of water samples from the Km 119 River (P3, downstream).

Temporal variation of total nitrogen, ammoniacal nitrogen, nitrite and nitrate (mg/L) of water samples from the Campo River (P4, downstream).
The results of ammoniacal nitrogen observed herein are higher than those found by Romitelli and Paterniani (2007)ROMITELLI, L. and PATERNIANI, J.E.S., 2007. Diagnóstico ambiental de um trecho do Córrego Bonifácio, APA Jundiaí - SP. Engenharia Ambiental, vol. 4, no. 2, pp. 14-25. of 0.0001-4.0 mg/L, Medeiros et al. (2008)Medeiros, G.A., Lima, C.A.V. and Hussar, G.J., 2008. Diagnóstico ambiental do rio Jaguari-Mirim no município de São João da Boa Vista – SP. In: Anais do VI Simpósio Brasileiro de Engenharia Ambiental, 2008, Serra Negra. Serra Negra: ASBEA, pp. 1-10. CD- ROM. of 0.08-0.2 mg/L and similar to those of Lima and Medeiros (2008)Lima, C.A. and Medeiros, G.A., 2008. Diagnóstico da qualidade da água do rio Jaguari-Mirim no Município de São João da Boa Vista - SP. Engenharia Ambiental, vol. 5, no. 2, pp. 125-138. of 2.0-5.0 mg/L in urban and rural micro basins. Values of total nitrogen were higher than those registered by Siqueira et al. (2012)Siqueira, G.W., Aprile, F. and Miguéis, A.M., 2012. Diagnóstico da qualidade da água do rio Parauapebas (Pará - Brasil ).Acta Amazonica, vol. 42, no. 3, pp. 413-422. http://dx.doi.org/10.1590/S0044-59672012000300014.
http://dx.doi.org/10.1590/S0044-59672012...
(0.12 and 0.33 mg/L).
There is no limit set for total nitrogen in the Conama Resolution 357/2005 for Class 2 (Brasil, 2005BRASIL. Ministério do Meio Ambiente, 2005. Resolução n° 357, de 17 de março de 2005. Dispõe sobre a classificação dos corpos de água e diretrizes ambientais para o seu enquadramento, bem como estabelece as condições e padrões de lançamento de efluentes, e dá outras providências. Diário Oficial da República Federativa do Brasil, Brasília, 18 mar. Seção 1, pp. 58-63.), but the § 3 of Article 10 describes that the value of total nitrogen (after oxidation) should not exceed 2.18 mg/L for lotic environments in the reference flow in Class 2, when nitrogen is limiting for eutrophication under the conditions set by the environmental agency.
According to ANOVA, there were no significant differences for mean nitrate (p-value 0.6542), but rather for total nitrogen (p-value 0.0001), ammoniacal nitrogen (p-value 0.00031) and nitrite (p-value 4.01E-06). For total nitrogen, the post-hoc test indicated that the mean difference of 4.0 mg/L occurred between P1, P2 and P4 in relation to P3 with greater variation (6.0-2.0 mg/L) (Table 2). Maximum values showed a greater variation of 5.0 mg/L from P3 (11.0 mg/L) to P1, P2 and P4 (4.0, 4.0 and 6.0 mg/L, respectively). In relation to ammoniacal nitrogen, the post-hoc test identified a mean difference of 2.4 mg/L between P1, P2 and P4 relative t P3, with greater variation (3.5-1.1 mg/L) (Table 2). Maximum values showed a greater variation of 5.6 mg/L from P3 (9.0 mg/L) to P1, P2 and P4 (3.4, 3.4 and 5.0 mg/L, respectively). Considering the nitrite, the post-hoc indicated that the mean difference of 1.8 mg/L occurred between P1 and P3 with greater variation (2.0-0.2 mg/L) (Table 2). Maximum values exhibited a greater variation of 4.9 mg/L from P3 (5.3 mg/L) to P1 (0.4 mg/L).
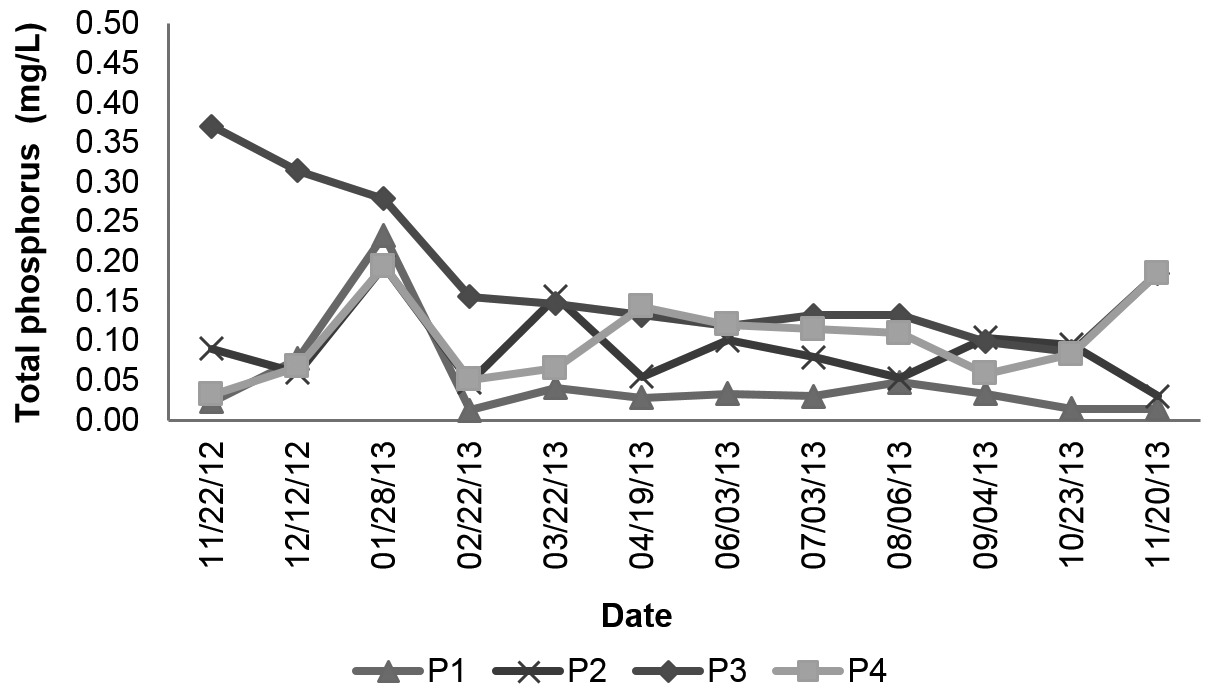
Moreover, in Figure 10 it can be seen an increase in mean concentration of total phosphorus from upstream towards downstream, from P2 to P4 (0.09 to 0.10 mg/L) in the Campo River, and more sharply from P1 to P3 (0.05 to 0.18 mg/L) in the Km 119 River. Approximately 83% of these results were higher than the limit of 0.1 mg/L of the Conama Resolution 357/2005 (Brasil, 2005BRASIL. Ministério do Meio Ambiente, 2005. Resolução n° 357, de 17 de março de 2005. Dispõe sobre a classificação dos corpos de água e diretrizes ambientais para o seu enquadramento, bem como estabelece as condições e padrões de lançamento de efluentes, e dá outras providências. Diário Oficial da República Federativa do Brasil, Brasília, 18 mar. Seção 1, pp. 58-63.) for Class 2 in lotic environment. The results indicate points of contamination, probably due to the disposal of effluents of sewage treatment plants, Km 119 and Campo wastewater treatment plants, in the urban area of the municipality of Campo Mourão and fertilizers used in agricultural activities in the rural area of the basin.

Temporal variation of total phosphorus (mg/L) of water samples from the Km 119 River (P1 and P3) and Campo River (P2 and P4).
The input of phosphorus in aquatic environments occurs mainly by erosion, punctual discharges of effluents contaminated with these elements, leaching of primary minerals, dissolution of soil compounds and organic matter decay. Moreover, the presence of dumps may be the origin of this element in excess in waters (Sperling, 2005Sperling, M., 2005. Introdução à qualidade das águas e ao tratamento de esgotos. 3rd ed. Belo Horizonte: UFMG, vol. 1, pp. 243.). Rainfall may increase the phosphorus concentration in the water body via runoff and leaching, but also cause dilution and consequent decrease due to increased flow (Ellison and Brett, 2006Ellison, M.E. and Brett, M.T., 2006. Particulate phosphorus bioavailability as a function of stream flow and land cover. Water Research, vol. 40, no. 6, pp. 1258-1268. PMid:16515802.). The decrease in phosphorus concentration was not observed as a function of rainfall, once phosphorus concentrations varied in the sampling days with such event.
At the P1, upstream of P3, the non-attendance of the regulation resulted in 8%, corroborating the greater contamination downstream of this site in the 119 km River, followed by 8% at P2 and 50% at P4 in the Campo River. In Table 2, ANOVA revealed significant differences for total phosphorus (p-value 0.0003) and the post-hoc test indicated difference between P1 and P3 with greater variation of 0.13 mg/L (0.18-0.05 mg/L). Maximum values exhibited a greater variation of 0.18 mg/L from P3 (0.37 mg/L) to P1 (0.19 mg/L). Madruga et al. (2008)Madruga, F.V., Reis, F.A.G.V., Medeiros, G.A. and Giordano, L.C., 2008. Avaliação da influência do Córrego dos Macacos na qualidade da água do rio Mogi Guaçu, no Município de Mogi Guaçu – SP. Engenharia Ambiental, vol. 5, no. 2, pp. 152-168. reported mean values of total phosphorus of 0.01-0.11 mg/L upstream, and 0.02-0.19 mg/L; Borges et al. (2003)Borges, M.J., GalbiaTti, J.A. and Ferraudo, A.S., 2003. Monitoramento da qualidade hídrica e eficiência de interceptores de esgoto em cursos d ́água urbanos da bacia hidrográfica do córrego Jaboticabal. Revista Brasileira de Recursos Hídricos, vol. 8, no. 2, pp. 161-171. of 0.01-0.07 mg/L; Medeiros et al. (2008)Medeiros, G.A., Lima, C.A.V. and Hussar, G.J., 2008. Diagnóstico ambiental do rio Jaguari-Mirim no município de São João da Boa Vista – SP. In: Anais do VI Simpósio Brasileiro de Engenharia Ambiental, 2008, Serra Negra. Serra Negra: ASBEA, pp. 1-10. CD- ROM. of 0.1-1.0 mg/L in urban basins.
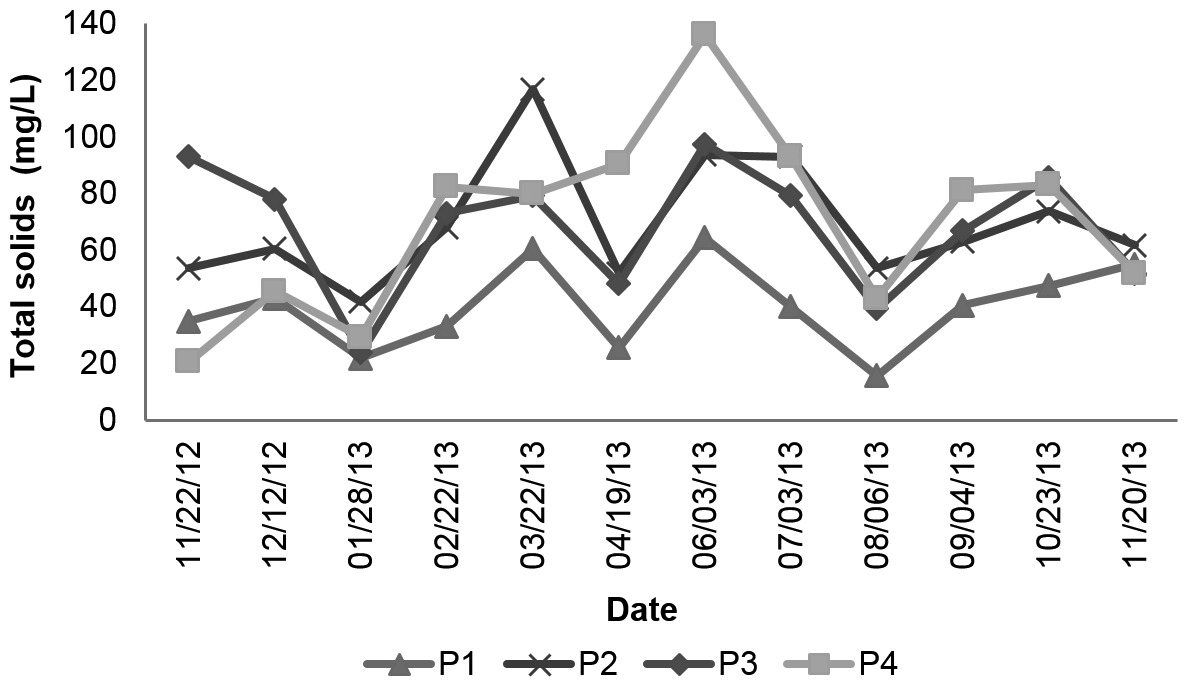
Regarding total solids, higher values were verified at P2 (117 mg/L) on June 3rd, 2013 and P4 (136 mg/L) on March 22nd, 2013, corresponding to rainy days with higher river discharges, compared to the other days (Figure 11). As previously emphasized, the presence of sediments from the overflow of retention boxes and from rill erosion on roadsides by the poor maintenance of rural roads leads to increased concentration of total solids in the river water in rainy days (Crispim et al., 2012Crispim, J.Q., Malysz, S.T., Cardoso, O. and PAGLIARINI JUNIOR, S.N., 2012. Conservação e proteção de nascentes por meio do solo cimento em pequenas propriedades agrícolas na bacia hidrográfica Rio do Campo no município de Campo Mourão – PR. Revista Geonorte, vol. 3, no. 4, pp. 781-790. Edição Especial.). Besides that total volatile solids (TVS) predominated in 56%, 60%, 56% and 64% and total fixed solids (TFS) in 44%, 40%, 44% and 36% of the samples. This behavior is associated with the occurrence of organic matter in rivers. Bregunce et al. (2011)Bregunce, D.T., Jordan, E.N., Dziedzic, M., Maranho, L.T. and Cubas, S.A., 2011. Avaliação da qualidade da água do Ribeirão dos Müller, Curitiba-PR. Revista Brasileira de Recursos Hídricos, vol. 16, no. 3, pp. 39-47. and Machado et al. (2007)Machado, L.P., Garção, H.F., Fontana, G.H. and Oliveira, M.D., 2007. Avaliação da qualidade da água da zona estuarina do Rio dos Magos. In: Anais do XXIV Congresso Brasileiro de Engenharia Sanitária e Ambiental, 2007, Belo Horizonte. Belo Horizonte: ABES, pp. 1-10. CD- ROM. found similar results when evaluated water quality in urban basins.

Temporal variation of total solids (mg/L) of water samples from the Km 119 River (P1 and P3) and Campo River (P2 and P4).
In Table 2 are listed the results of ANOVA that indicated significant differences in results of total solids (p-value 0.0086). The post-hoc test identified the difference between P1 and P3, with greater variation of 28 mg/L (68-40 mg/L). Maximum values exhibited a greater variation of 72 mg/L from P4 (136 mg/L) to P1 (64 mg/L).
Figure 12 shows the reduction in mean values of WQI in the Km 119 River, from 74 to 60 (P1 and P3), and in the Campo River, from 68 to 60 (P2 and P4), confirming what was previously discussed for each parameter given the influence of urban (sewage and industrial effluents) and rural (leaching, erosion, runoff) contributions, from upstream towards downstream. The median ranged from 61 to 71, with minimum of 51 at P3 and P4, and maximum of 88 at P1; in other words, the water quality of the rivers varied between average and good, according to WQI classification.

Variation of WQI of water samples of the Km 119 River (P1 and P3) and Campo River (P2 and P4).
Upstream in the Km 119 River, the WQI resulted in 75% of samples below 83 (3rd quartile); 25% of samples above 67 (1st quartile) and 50% of samples in the range 67-83 (P1); and downstream, at the site P3, resulted in 75% of samples below 65 (3rd quartile); 25% of samples above 55 (1st quartile) and 50% samples in the range 55-65. The values classified the waters of this river as average.
The same classification was observed in the Campo River, with 75% of samples below 71 (3rd quartile); 25% of samples above 62 (1st quartile) and 50% samples in the range 62-71, at the site P2 (upstream); and 75% of samples below 61 (3rd quartile); 25% of samples above 67 (1st quartile) and 50% of samples in the range 58-61 at the site P4 (downstream).
Significant differences were verified for WQI (p-value 0.0001) by ANOVA (Table 2), with differences between P1 and P3, and greater variation of 14 (74-60) by the Tukey’s post-hoc test. Maximum values showed a slightly greater variation of 21 from P1 (88) to P3 (67).
4 Conclusions
The behavior of the parameters revealed a higher degree of deterioration in water samples from the sites downstream in the 119 km and Campo Rivers in the Campo River basin, mainly due to the significant influence of rural and urban human activity in this area.
High concentrations of organic matter, fecal coliforms and total phosphorus indicate a deficit of sanitation in the basin, probably due to lack of tertiary treatment for removal of these pollutants in urban areas, and basic sanitation in rural areas.
The results of the Water Quality Index for the rivers Km 119 and Campo indicate that their waters can be classified as of average quality, in 71%, and good quality in 29% of the evaluated sites. The reduction in water quality may be associated with pollution by sewage and agro-industrial effluents, according to the greater influence of the parameters aforementioned.
The assessment of water quality on the basis of monitored parameters and WQI demonstrates the need to implement measures of urban and rural planning in the region to improve environmental preservation.
Acknowledgements
Authors acknowledge FINEP by the grants received to the implementation of this research (Edital CT-Hidro-MCT-FINEP 01-2010).
References
- AGÊNCIA NACIONAL DE ÁGUAS – ANA, 2009 [viewed 12 April 2013]. Indicadores de qualidade – índice de qualidade das águas [online]. Available from: http://pnqa.ana.gov.br/IndicadoresQA/IndiceQA.aspx>Access.
» http://pnqa.ana.gov.br/IndicadoresQA/IndiceQA.aspx>Access - Almeida, M.A.B. and Schwarzbold, A., 2003. Avaliação sazonal da qualidade das águas do Arroio da Cria Montenegro, RS com aplicação de um Índice de Qualidade de Água (IQA). Revista Brasileira de Recursos Hídricos, vol. 8, no. 1, pp. 81-97.
- Aprile, F.M. and Siqueira, G.W., 2011. Alternative treatment methods of drinking-water for river communities in Central Amazonian. In: C. BILIBIO, O. HENSEL and J. SELBACH, eds. Sustainable water management in the tropics and subtropics – and case studies in Brazil. Jaguarão: Fundação Universidade Federal do Pampa, vol. 1, pp. 1143-1166.
- ASSOCIAÇÃO BRASILEIRA DE NORMAS TÉCNICAS – ABNT. NBR 9898: preservação e técnicas de amostragem de efluentes líquidos e corpos receptores. Rio de Janeiro: ABNT, 1987.
- Blume, K.K., Macedo, J.C., Meneguzzi, A., Silva, L.B., Quevedo, D.M. and Rodrigues, M.A.S., 2010. Water quality assessment of the Sinos River, Southern Brazil. Brazilian Journal of Biology = Revista Brasileira de Biologia, vol. 70, no. 4, (suppl.), pp. 1185-1193. http://dx.doi.org/10.1590/S1519-69842010000600008. PMid:21225160.
» http://dx.doi.org/10.1590/S1519-69842010000600008 - Borges, M.J., GalbiaTti, J.A. and Ferraudo, A.S., 2003. Monitoramento da qualidade hídrica e eficiência de interceptores de esgoto em cursos d ́água urbanos da bacia hidrográfica do córrego Jaboticabal. Revista Brasileira de Recursos Hídricos, vol. 8, no. 2, pp. 161-171.
- BRASIL. Ministério do Meio Ambiente, 2005. Resolução n° 357, de 17 de março de 2005. Dispõe sobre a classificação dos corpos de água e diretrizes ambientais para o seu enquadramento, bem como estabelece as condições e padrões de lançamento de efluentes, e dá outras providências. Diário Oficial da República Federativa do Brasil, Brasília, 18 mar. Seção 1, pp. 58-63.
- BRASIL. Ministério da Saúde, 2011. Portaria n° 2.914, de 12 de dezembro de 2011. Dispõe sobre os procedimentos de controle e de vigilância da qualidade da água para consumo humano e seu padrão de potabilidade. Diário Oficial da República Federativa do Brasil, Brasília, 14 dez. Seção 1, pp. 39-46.
- Bregunce, D.T., Jordan, E.N., Dziedzic, M., Maranho, L.T. and Cubas, S.A., 2011. Avaliação da qualidade da água do Ribeirão dos Müller, Curitiba-PR. Revista Brasileira de Recursos Hídricos, vol. 16, no. 3, pp. 39-47.
- Brites, A.P.Z. and Gastaldini, M.C.C., 2007. Avaliação da carga poluente no sistema de drenagem de duas bacias hidrográficas urbanas. Revista Brasileira de Recursos Hídricos, vol. 12, no. 4, pp. 211-221.
- Colavite, A. P., 2008. Cartografia aplicada à análise ambiental da Bacia Hidrográfica do Rio do Campo - PR. Maringá: Universidade Estadual de Maringá, 80 p. Monografia de Especialização em Planejamento e Gerenciamento Urbano e Rural.
- Crispim, J.Q., Malysz, S.T., Cardoso, O. and PAGLIARINI JUNIOR, S.N., 2012. Conservação e proteção de nascentes por meio do solo cimento em pequenas propriedades agrícolas na bacia hidrográfica Rio do Campo no município de Campo Mourão – PR. Revista Geonorte, vol. 3, no. 4, pp. 781-790. Edição Especial.
- Demirak, A., Yilmaz, F., Tuna, A.L. and Ozdemir, N., 2006. Heavy metals in water, sediment and tissues of . Leuciscus cephalus from a stream in Southwestern TurkeyChemosphere, vol. 63, no. 9, pp. 1451-1458. http://dx.doi.org/10.1016/j.chemosphere.2005.09.033. PMid:16325225.
» http://dx.doi.org/10.1016/j.chemosphere.2005.09.033 - Eaton, A.D., Clesceri, L.S., Rice, E.W. and Greenberg, A.E., eds, 2005. Standard methods for the examination of water and wastewater. 21st ed. Washington: American Public Health Association/American Water Works Association/Water Pollution Control Federation.
- Ellison, M.E. and Brett, M.T., 2006. Particulate phosphorus bioavailability as a function of stream flow and land cover. Water Research, vol. 40, no. 6, pp. 1258-1268. PMid:16515802.
- Galdino, N. S. and Trombini, R. B., 1985. Análise físico-química da água do Córrego Japira, localizado na cidade de Apucarana-PR. Revista Terra e Cultura: Cadernos de Ensino e Pesquisa, vol. 1, no. 1, pp. 16.
- Goldstein, R.M., Carlisle, D.M., Meador, M.R. and Short, T.M., 2007. Can basin land use effects on physical characteristics of streams be determined broad geographic scales? Environmental Monitoring and Assessment, vol. 130, no. 1-3, pp. 495-510. http://dx.doi.org/10.1007/s10661-006-9439-7. PMid:17106774.
» http://dx.doi.org/10.1007/s10661-006-9439-7 - Huntsaker, C.T. and Levine, D.A., 1995. Hierarchical approaches to the study of water quality in rivers: spatial scale and terrestrial processes are important in developing models to translate research results to management practices. Bioscience, vol. 45, no. 3, pp. 195-203.
- INSTITUTO BRASILEIRO DE GEOGRAFIA E ESTATÍSTICA – IBGE [online], 2010. [viewed 10 January 2014]. Available from: http://www.ibge.gov.br
» http://www.ibge.gov.br - Ioris, A.A.R., Hunter, C. and Walker, S., 2008. The development and application of water management sustainability indicators in Brazil and Scotland. Journal of Environmental Management, vol. 88, no. 4, pp. 1190-1201. http://dx.doi.org/10.1016/j.jenvman.2007.06.007. PMid:17681672.
» http://dx.doi.org/10.1016/j.jenvman.2007.06.007 - Köeppen, W., 1948. Climatologia: con um estúdio de los climas de la Tierra. México: Fondo de Cultura Economica, pp. 478.
- Lima, C.A. and Medeiros, G.A., 2008. Diagnóstico da qualidade da água do rio Jaguari-Mirim no Município de São João da Boa Vista - SP. Engenharia Ambiental, vol. 5, no. 2, pp. 125-138.
- Lima, C.A.N.V., Beraldo, M.M., Medeiros, G.A. and Picinato, R., 2005. Caracterização ambiental do córrego São João em São João da Boa Vista - SP. In: Anais do Simpósio Brasileiro de Engenharia Ambiental, 2005, Ribeirão Preto. Ribeirão Preto: Faculdades COC, vol. 1, pp. 1-4.
- Maack, R., 2002. Geografia física do estado do Paraná. 3rd ed. Curitiba: Imprensa Oficial, pp. 350.
- Machado, L.P., Garção, H.F., Fontana, G.H. and Oliveira, M.D., 2007. Avaliação da qualidade da água da zona estuarina do Rio dos Magos. In: Anais do XXIV Congresso Brasileiro de Engenharia Sanitária e Ambiental, 2007, Belo Horizonte. Belo Horizonte: ABES, pp. 1-10. CD- ROM.
- Madruga, F.V., Reis, F.A.G.V., Medeiros, G.A. and Giordano, L.C., 2008. Avaliação da influência do Córrego dos Macacos na qualidade da água do rio Mogi Guaçu, no Município de Mogi Guaçu – SP. Engenharia Ambiental, vol. 5, no. 2, pp. 152-168.
- Margalef, R., 1991. Teoria de los sistemas ecologicos. 2nd ed. Barcelona: Universitat de Barcelona, p. 290.
- Medeiros, G.A., Lima, C.A.V. and Hussar, G.J., 2008. Diagnóstico ambiental do rio Jaguari-Mirim no município de São João da Boa Vista – SP. In: Anais do VI Simpósio Brasileiro de Engenharia Ambiental, 2008, Serra Negra. Serra Negra: ASBEA, pp. 1-10. CD- ROM.
- Mophin-Kania, K. and Murugesan, A.G., 2011. Evaluation and classification of water quality of perennial River Tamirabarani through aggregation of water quality index. International Journal of Environment and Pollution, vol. 1, no. 5, pp. 24-33.
- Moreno, P. and Callisto, M., 2004. Bioindicadores de qualidade de água ao longo da bacia do Rio das Velhas (MG). In: V. L. FERRACINI, S.C.N. QUEIROZ and M.P. SILVEIRA, eds. Bioindicadores de qualidade da água. Jaguariúna: Embrapa, pp. 95-116.
- PARANÁ. Superintendência de Desenvolvimento de Recursos Hídricos e Saneamento Ambiental, 1992. Portaria n° 19, de 12 de maio de 1992. Dispõe sobre o enquadramento dos cursos d’água da bacia do Rio Ivaí. Diário Oficial do Estado do Paraná, Curitiba, 28 maio. Seção 1, pp. 1-2.
- ROcha, C.M.B.M., Rodrigues, L.S., COSTA, C.C., OLIVEIRA, P.R., SILVA, I.J., JESUS, E.F.M. and ROLIM, R.G., 2006. Avaliação da qualidade da água e percepção higiênico-sanitária na area rural de Lavras, Minas Gerais, Brasil, 1999-2000. Cadernos de Saúde Pública, vol. 22, no. 9, pp. 1967-1978.
- ROMITELLI, L. and PATERNIANI, J.E.S., 2007. Diagnóstico ambiental de um trecho do Córrego Bonifácio, APA Jundiaí - SP. Engenharia Ambiental, vol. 4, no. 2, pp. 14-25.
- Silveira, G.L., Silva, C.E., Irion, C.A.O., Cruz, I.C. and Retz, E.F., 2003. Balanço de cargas poluidoras pelo monitoramento quali-quantitativo dos recursos hídricos em pequena bacia hidrográfica. Revista Brasileira de Recursos Hídricos, vol. 8, no. 1, pp. 5-11.
- Siqueira, G.W., Aprile, F. and Miguéis, A.M., 2012. Diagnóstico da qualidade da água do rio Parauapebas (Pará - Brasil ).Acta Amazonica, vol. 42, no. 3, pp. 413-422. http://dx.doi.org/10.1590/S0044-59672012000300014.
» http://dx.doi.org/10.1590/S0044-59672012000300014 - Sperling, M., 2005. Introdução à qualidade das águas e ao tratamento de esgotos. 3rd ed. Belo Horizonte: UFMG, vol. 1, pp. 243.
- Sperling, M.V., 2007. Estudos e modelagem da qualidade da água de rios. Belo Horizonte: UFMG, vol. 1, pp. 588.
- TAROSSI, B.F., SIMÕES, R.P., OSHIRO, M.S.R., MEDEIROS, G.A. and HUSSAR, G.J., 2006. Poluição hídrica do rio Jaguari Mirim em São João da Boa Vista - SP. In: Anais do V Simpósio Brasileiro de Engenharia Ambiental, 2006, Curitiba. Curitiba: PUC PR, 2006. vol. 1, pp. 151.
- Villela, I.V., Oliveira, I.M., Silveira, J.C., Dias, J.F., Henriques, J.A.P. and Silva, J., 2007. Assessment of environmental stress by the micronucleus and comet assays on . Limnoperna fortunei exposed to Guaíba hydrographic region samples (Brazil) under laboratory conditionsMutation Research/Genetic Toxicology and Environmental Mutagenesis, vol. 628, no. 2, pp. 76-86. http://dx.doi.org/10.1016/j.mrgentox.2006.12.001. PMid:17267262.
» http://dx.doi.org/10.1016/j.mrgentox.2006.12.001 - Villwock, F.H., Crispim, J.Q. and Rocha, J.A., 2013. Levantamentos de parâmetros limnológicos na Bacia Hidrográfica do Rio do Campo – PR. In: Anais do VII Encontro de Produção Científica e Tecnológica, 2013, Campo Mourão. Campo Mourão: UNESPAR/FECILCAM, pp. 9.
-
(With 12 Figures)
Publication Dates
-
Publication in this collection
27 Nov 2015 -
Date of issue
Dec 2015
History
-
Received
17 Jan 2015 -
Accepted
20 May 2015