Abstract
Satellite images are an effective tool for the detection of phytoplankton blooms, since they cause striking changes in water color. Bloom intensity can be expressed in terms of chlorophyll-a concentration. Previous studies suggest the use of Landsat TM4/TM3 reflectance ratio to retrieve surface chlorophyll-a concentration from aquatic systems. In this study we assumed that a remote sensing trophic state index can be applied to investigate how changes in HRT along the hydrologic year affect the spatial distribution of the phytoplankton blooms at Ibitinga’s reservoir surface. For that, we formulated two objectives: (1) apply a semi-empirical model which uses this reflectance ratio to map chlorophyll-a concentration at Ibitinga reservoir along the 2005 hydrologic year and (2) assess how changes in hydraulic residence time (HRT) affect the spatial distribution of phytoplankton blooms at Ibitinga Reservoir. The study site was chosen because previous studies reported seasonal changes in the reservoir limnology which might be related to the reservoir seasonality and hydrodynamics. Six Landsat/TM images were acquired over Ibitinga reservoir during 2005 and water flow measurements provided by the Brazilian Electric System National Operator - ONS were used to compute the reservoir´s residence time, which varied from 5.37 to 52.39 days during 2005. The HRT in the date of image acquisition was then compared to the distribution of chlorophyll-a in the reservoir. The results showed that the HRT increasing implies the increasing of the reservoir surface occupied by phytoplankton blooms.
Keywords:
Landsat TM4/TM3 band ratios; chlorophyll-a; phytoplankton bloom; hydraulic residence time
Resumo
As imagens de satélite são frequentemente usadas para a identificação de florações de fitoplâncton porque sua presença causa mudanças significativas na cor da água. A abundância das florações pode ser quantificada por medidas de concentração de clorofila-a. Diversos estudos sugerem o uso da razão de reflectância das bandas TM4/TM3 Landsat, para determinar as concentrações de clorofila-a em sistemas aquáticos. Este trabalho tem como objetivos: (1) aplicar um modelo semi-empírico que usa essa razão para mapear a concentração de clorofila-a no reservatório de Ibitinga ao longo do ano hidrológico de 2005; (2) avaliar como as mudanças no tempo de residência hidráulica afetaram a distribuição de florações na superfície do reservatório. O reservatório de Ibitinga foi selecionado porque estudos prévios indicavam mudanças sazonais nas propriedades limnológicas do reservatório, as quais poderiam estar relacionadas à sazonalidade e à hidrodinâmica. Seis imagens TM/Landsat foram adquiridas sobre o reservatório de Ibitinga durante o ano de 2005. Foi então usada uma tabela associando intervalos de razão de banda a intervalos de concentração de clorofila-a. Medidas de vazão fornecidas pelo Operador Nacional do Sistema Elétrico – ONS foram utilizadas para calcular o tempo de residência hidráulica do reservatório, que variou entre 5,37 e 52,39 dias durante 2005. O tempo de residência hidráulica em cada data de aquisição da imagem foi então comparado com a área ocupada pelas florações de fitoplancton. Os resultados indicaram uma forte relação entre o tempo de residência hidráulica e a área ocupada por florações. Em junho de 2005, quando o reservatório atingiu seu menor tempo de residência hidráulica, apenas 20% de sua área estiveram ocupadas por florações. Em setembro e outubro, quando a residência hidráulica atinge o seu máximo, mais que 80% da superfície do reservatório foram ocupadas por florações de fitoplancton.
Palavras-chave:
razões entre bandas TM4/TM3; clorofila-a; florações de fitoplancton; residência hidráulica
1 Introduction
The assessment of water quality has become critical in São Paulo State as water demand has intensified in the last decades (Tundisi, 2003Tundisi, J.G., 2003. Água no século XXI: enfrentando a escassez. São Carlos: RiMA, IIE. 248 p.; Tundisi et al., 1991Tundisi, J.G., Matsumura-Tundisi, T., Calijuri, M.C. and Novo, E.M.L., 1991. Comparative limnology of five reservoirs in the middle Tietê River, S. Paulo State. Verhandlungen des Internationalen Verein Limnologie, vol. 24, pp. 1489-1496., 2008Tundisi, J.G., Matsumura-Tundisi, T., Pareschi, D.C., Luzia, A.P., Von Haeling, P.H. and Frollini, E.H., 2008. A bacia hidrográfica do Tietê/Jacaré: estudo de caso em pesquisa e gerenciamento. Estudos Avançados, vol. 22, no. 63, pp. 159-172. http://dx.doi.org/10.1590/S0103-40142008000200010.
http://dx.doi.org/10.1590/S0103-40142008...
; São Paulo, 2011SÃO PAULO. Secretaria de Saneamento e Recursos Hídricos. Coordenadoria de Recursos Hídricos, 2011. Relatório de Situação dos Recursos Hídricos do Estado de São Paulo. São Paulo. 208 p.). Government information on water quality of São Paulo State, provided by CETESB (Sao Paulo State Environmental Company), reports that from 2007 to 2009: i) water availability per capita decreased in the entire state due to population growth; ii) there was an unbalance between surface water availability and consumption in most of the drainage basins ; iii) the Tietê River Basin displayed a 16% increase in water demand for urban uses; iv) the amount of collected and treated domestic sewage remained below 50%; v) the raw water quality for public supply underwent severe degradation with 78% of the samples assigned to quality classes ranging from Regular to Very Bad.; vi) degradation of ecological aspects of water with 70% of the samples assigned to classes ranging from Bad to Very Bad; vii) deterioration in the trophic state with 50% of the samples assigned to classes ranging from eutrophic to hypereutrophic in 2009 (São Paulo, 2011SÃO PAULO. Secretaria de Saneamento e Recursos Hídricos. Coordenadoria de Recursos Hídricos, 2011. Relatório de Situação dos Recursos Hídricos do Estado de São Paulo. São Paulo. 208 p.).
In hydroelectric reservoirs the residence time is manipulated to balance the need of water storage during the dry season and water renewal for maintaining quality requirements. Hydraulic residence time (HRT) is the theoretical amount of time required for a given flow to pass through an aquatic system. According to Straškraba (1999)Straškraba, M., 1999. Retention time as a key variable of reservoir limnology. In: J.G. TUNDISI and M. STRAŠKRABA, eds. Theoretical reservoir ecology and its applications. São Carlos: International Institute of Ecology, Brazilian Academy of Sciences, Backhuys Publishers, cap. 16, pp. 385-410. the HRT is a determinant factor in stratification processes and nutrient availability, affecting phytoplankton development. Therefore, it might explain the time and space changes in the chlorophyll concentration at reservoir surface (Straškraba, 1999Straškraba, M., 1999. Retention time as a key variable of reservoir limnology. In: J.G. TUNDISI and M. STRAŠKRABA, eds. Theoretical reservoir ecology and its applications. São Carlos: International Institute of Ecology, Brazilian Academy of Sciences, Backhuys Publishers, cap. 16, pp. 385-410.).
The energy demand is an indirect factor affecting water quality, considering that the energy production process controls at certain extent the reservoir’s HTR. To overcome phytoplankton blooms during periods of high HRT, the outflow rate can be manipulated by periodic and quick alternation between flow regimes (hydropeaking). Decreases in HRT are usually related to phytoplankton biomass losses through hydraulic washing and mechanical shock, whereas increases promote phytoplankton development as a consequence of nutrients concentration and water column stability.
The impact of HRT manipulation, however, may not be constant on the entire reservoir. In general, the regions near the dam are more affected by those actions whereas reservoir inlets far from the turbines may remain protected from mechanical shock and hydraulic washing.
According to Bennion et al. (2005)Bennion, H., Hilton, J., Hughes, M., Clark, J., Hornby, D., Fozzard, I., Phillips, G. and Reynolds, C., 2005. The use of a GIS-based inventory to provide a national assessment of standing waters at risk from eutrophication in Great Britain. The Science of the Total Environment, vol. 344, no. 1-3, pp. 259-273. http://dx.doi.org/10.1016/j.scitotenv.2005.02.016. PMid:15907521.
http://dx.doi.org/10.1016/j.scitotenv.20...
, aquatic ecosystems with high hydraulic retention time (larger than 30 days) are very sensitive to enrichment, which means, more prone to eutrophication. Shallow and completely mixed systems have very low potential of recovery.
As pointed out by Smith (2007)Smith, V.H., 2007. Using primary productivity as an index of coastal eutrophication: the units of measurement matter. Journal of Plankton Research, vol. 29, no. 1, pp. 1-6. http://dx.doi.org/10.1093/plankt/fbl061.
http://dx.doi.org/10.1093/plankt/fbl061...
, since the 1950’s research results reveal strong links between nutrient availability and phytoplankton production, based on the relationship between the concentrations of phosphorus and phytoplankton biomass - measured as chlorophyll α (Chla). Those links were first demonstrated in seawater samples representing a broad eutrophication gradient from oligotrophic coastal and open ocean sites to polluted estuaries.
Several authors, therefore, define eutrophication as the enrichment of water by nutrients (nitrogen and/or phosphorus) and organic matter, which causes incontrollable growth of algae and higher forms of plant life (macrophytes) producing an undesirable deviation in structure, function and stability of the aquatic ecosystem and as a consequence a deep degradation in water quality, when compared to reference conditions (Vollenweider, 1968Vollenweider, R.A., 1968. Scientific fundamentals of the eutrophication of lakes and flowing waters, with particular reference to nitrogen and phosphorus as factors in eutophication. Paris: UNESCO. OECD Technical Report, DAS/CSI/68.; Carlson, 1974Carlson, R.E., 1974. A trophic state index for lakes. Minneapolis: Limnological Research Center, University of Minnesota. 17 p. Contribution, no. 141.; CETESB, 1974COMPANHIA AMBIENTAL DO ESTADO DE SÃO PAULO – CETESB, 1974. Resultados de análises: reconhecimento das condições atuais sanitárias e ecológicas do Rio Tiete: estudo de eutrofização das represas da bacia do Tietê. São Paulo: CETESB. vol. 3., 2001COMPANHIA AMBIENTAL DO ESTADO DE SÃO PAULO – CETESB, 2001. Relatório de qualidade das águas interiores do estado de São Paulo 2000. São Paulo: CETESB. 214 p. vol. 1., 2012COMPANHIA AMBIENTAL DO ESTADO DE SÃO PAULO – CETESB, 2012 [viewed 30 June 2012]. Índice de qualidade das águas [online]. São Paulo: CETESB. Available from: http://www.cetesb.sp.gov.br/agua/%C3%A1guas-superficiais/108-%C3%ADndices-de-qualidade-das-%C3%A1guas
http://www.cetesb.sp.gov.br/agua/%C3%A1g...
; Dillon, 1974Dillon, P.J., 1974. A critical review of Vollenweider’s nutrient budget model and other related models. Water Resources Bulletin, vol. 10, no. 5, pp. 969-989. http://dx.doi.org/10.1111/j.1752-1688.1974.tb00617.x.
http://dx.doi.org/10.1111/j.1752-1688.19...
, 1975Dillon, P.J., 1975. The phosphorus budget of Cameron Lake: the importance of flushing rate to the degree of eutrophy in lakes.Limnology and Oceonography, vol. 19, no. 1, pp. 28-39. http://dx.doi.org/10.4319/lo.1975.20.1.0028.
http://dx.doi.org/10.4319/lo.1975.20.1.0...
; Dillon and Kirchner, 1975Dillon, P.J. and Kirchner, W.B., 1975. The effects of geology and land use on the export of phosphorus from watersheds. Water Research, vol. 9, no. 2, pp. 135-148. http://dx.doi.org/10.1016/0043-1354(75)90002-0.
http://dx.doi.org/10.1016/0043-1354(75)9...
; EPA, 1978ENVIRONMENTAL PROTECTION AGENCY – EPA, 1978. Summary analysis of the North American (U.S. Portiona) OECD eutrophication project: nutrient loading – lake response relationships and trophic state indices. Corvallis: Environmental Research Laboratory Office of Research and Development. Ecological Research Series, no. EPA-600/3-78-008.; OECD, 1982ORGANIZATION FOR ECONOMIC COOPERATION AND DEVELOPMENT – OECD, 1982. Eutrophication of water: monitoring, assessment and control. Paris.; Toledo Junior, 1990TOLEDO JUNIOR, A. P., 1990. Informe preliminar sobre os estudos para a obtenção de um índice para a avaliação simplificada do estado trófico de reservatórios de regiões quentes tropicais. São Paulo: CETESB. 43 p. Relatório Técnico.; Andersen et al., 2006Andersen, J.H., Schlüter, L. and Ærtebjerg, G., 2006. Coastal eutrophication: recent developments in definitions and implications for monitoring strategies. Journal of Plankton Research, vol. 28, no. 7, pp. 621-628. http://dx.doi.org/10.1093/plankt/fbl001.
http://dx.doi.org/10.1093/plankt/fbl001...
; Smith, 2007Smith, V.H., 2007. Using primary productivity as an index of coastal eutrophication: the units of measurement matter. Journal of Plankton Research, vol. 29, no. 1, pp. 1-6. http://dx.doi.org/10.1093/plankt/fbl061.
http://dx.doi.org/10.1093/plankt/fbl061...
). Smith (2007)Smith, V.H., 2007. Using primary productivity as an index of coastal eutrophication: the units of measurement matter. Journal of Plankton Research, vol. 29, no. 1, pp. 1-6. http://dx.doi.org/10.1093/plankt/fbl061.
http://dx.doi.org/10.1093/plankt/fbl061...
emphasizes the fact that eutrophication causes shifts in phytoplankton species composition, which also impact the function of the aquatic ecosystem and lead to water quality degradation.
Chlorophyll-a concentration, is one of the key variables used to assess aquatic system trophic state. In Brazil, Carlson Trophic State Index (TSI) has been used since the 1970´s by the São Paulo State environmental monitoring agency (CETESB) to assess the water quality status.
CETESB’s trophic status assessment is based on the collection of water samples in selected sites in different seasons. It provides a broad assessment of water status at regional level, but the time and space scales are not appropriate for assessing the impact of HRT on water quality. In this respect, satellite remote sensing techniques can support in situ sampling, as they provide a synoptic view of the aquatic system.
Research in remote sensing applications to aquatic environment proved that the spectrum of remotely sensed reflectance (carried out by in situ, airborne and satellite borne instruments) of productive inland waters is affected in both blue and red regions by absorption of light by photosynthetic pigments in the phytoplankton (Kirk, 2011Kirk, J.T.O., 2011. Light and photosynthesis in aquatic ecosystems. 3rd ed. Cambridge: Cambridge University.). It is also affected by dissolved organic matter in the blue range and by inorganic suspended sediment throughout the 400 to 900 range as the concentration increases. Therefore, Chl-a concentration can be estimated from remotely sensed spectral reflectance data by relating optical changes observed in the reflected light at specific wavelengths to the concentration of chl-a, using both analytical and empirical/ semi-empirical models.
During the 1990’s and the first decade of the 21st century there has been a great deal of theoretical scientific progress regarding the relationship between water spectral reflectance, water inherent optical properties and water composition using in situ radiometric and limnological data (Gitelson et al., 1993Gitelson, A., Garbuzov, G., Szilagyi, F., Mittenzwey, K.H., Karnieli, A. and Kaiser, A., 1993. Quantitative remote sensing methods for real-time monitoring of inland waters quality. International Journal of Remote Sensing, vol. 14, no. 7, pp. 1269-1295. http://dx.doi.org/10.1080/01431169308953956.
http://dx.doi.org/10.1080/01431169308953...
, 1994Gitelson, A., Mayo, M., Yacobi, Y.Z., Parparov, A. and Berman, T., 1994. The use of high-spectral-resolution radiometer data for detection of low chlorophyll concentrations in Lake Kinneret. Journal of Plankton Research, vol. 16, no. 8, pp. 993-1002. http://dx.doi.org/10.1093/plankt/16.8.993.
http://dx.doi.org/10.1093/plankt/16.8.99...
). Some of these findings support the idea that, for inland waters with high levels of inorganic particles (Case 2 water) the magnitude of the scattering peak at 700 nm is highly sensitive to chlorophyll-a concentration (Kirk, 2011Kirk, J.T.O., 2011. Light and photosynthesis in aquatic ecosystems. 3rd ed. Cambridge: Cambridge University.). According to Gitelson et al. (1994)Gitelson, A., Mayo, M., Yacobi, Y.Z., Parparov, A. and Berman, T., 1994. The use of high-spectral-resolution radiometer data for detection of low chlorophyll concentrations in Lake Kinneret. Journal of Plankton Research, vol. 16, no. 8, pp. 993-1002. http://dx.doi.org/10.1093/plankt/16.8.993.
http://dx.doi.org/10.1093/plankt/16.8.99...
it happens due to the relationships between algal pigment absorption near 670 nm and phytoplankton cell scattering signal in the near infrared. The authors reported the use of the developed algorithms in aquatic systems with different seasonality and productivity patterns, but they also recognized that the model coefficients seemed to be site specific.
Several studies (Ruddick et al., 2001Ruddick, K.G., Gons, H.J., Rijkeboer, M. and Tilstone, G., 2001. Optical remote sensing of chlorophyll a in case 2 waters by use of an adaptive two-band algorithm with optimal error properties. Applied Optics, vol. 40, no. 21, pp. 3575-3585. http://dx.doi.org/10.1364/AO.40.003575. PMid:18360387.
http://dx.doi.org/10.1364/AO.40.003575...
; Dall’Olmo and Gitelson, 2005Dall'Olmo, G. and Gitelson, A.A., 2005. Effect of bio-optical parameter variability on the remote estimation of chlorophyll-a concentration in turbid productive waters: experimental results. Applied Optics, vol. 44, no. 3, pp. 412-422. http://dx.doi.org/10.1364/AO.44.000412. PMid:15717831.
http://dx.doi.org/10.1364/AO.44.000412...
; Londe et al., 2011Londe, L.R., Novo, E.M.L.M. and Calijuri, M.C., 2011. Aplicação de técnicas de sensoriamento remoto ao estudo do fitoplâncton de águas interiores. In: E. ALCÂNTARA, E.M.L.M. NOVO and J.L. STECH, eds. Novas tecnologias para o monitoramento e estudo de reservatórios hidrelétricos e grandes lagos. Rio de Janeiro: Parêntese, vol. único, pp. 219-254.) have already demonstrated that red and near infrared (NIR) spectral regions are the most useful for the retrieval of Chlorophyll-a concentration because they are less affected by other optically active components such as Colored Dissolved Organic Matter (CDOM) and Suspended Inorganic Particles. The band ratio TM4/TM3, which includes the Chlorophyll absorption peak in 670 nm and a spectral reflectance peak (fluorescence and phytoplankton cell backscattering) in 700 nm, provided the best performance for mapping chlorophyll-a in eutrophic aquatic systems (Moses et al., 2012Moses, W.J., Gitelson, A.A., Berdnikov, S., Saprygin, V. and Povazhnyi, V., 2012. Operational MERIS-based NIR-red algorithms for estimating chlorophyll-< i> a</i> concentrations in coastal waters—The Azov Sea case study. Remote Sensing of Environment, vol. 121, pp. 118-124. http://dx.doi.org/10.1016/j.rse.2012.01.024.
http://dx.doi.org/10.1016/j.rse.2012.01....
; Duan et al., 2007Duan, H., Zhang, Y., Zhang, B., Song, K. and Wang, Z., 2007. Assessment of chlorophyll-a concentration and trophic state for Lake Chagan using Landsat TM and field spectral data. Environmental Monitoring and Assessment, vol. 129, no. 1-3, pp. 295-308. http://dx.doi.org/10.1007/s10661-006-9362-y. PMid:17057973.
http://dx.doi.org/10.1007/s10661-006-936...
; Zimba and Gitelson, 2006Zimba, P.V. and Gitelson, A., 2006. Remote estimation of chlorophyll concentration in hyper-eutrophic aquatic systems: Model tuning and accuracy . optimizationAquaculture, vol. 256, no. 1, pp. 272-286. http://dx.doi.org/10.1016/j.aquaculture.2006.02.038.
http://dx.doi.org/10.1016/j.aquaculture....
).
Novo et al. (2013)Novo, E.M.L.M., Londe, L.R., Barbosa, C.C.F., Araujo, C.A.S. and Rennó, C.D., 2013. Proposal for a remote sensing trophic state index based upon Thematic Mapper/Landsat images. Revista Ambiente & Água, vol. 8, pp. 65-82. used in situ Bidirectional Reflectance Factor (BRF) data acquired at Ibitinga reservoir to simulate Landsat/TM spectral bands (TM_sim bands). Applying Monte Carlo simulation, they selected the most suitable model relating chlorophyll-α concentration and the simulated bands. TM4/TM3_sim provided the best model, which was then inverted to create look-up-table (LUT) relating ratio intervals to chlorophyll-a concentration. The authors assumed that this LUT could be applied to any Landsat TM/TM4 ratio provided that the images were previously atmospheric corrected and converted to surface reflectance. They applied the LUT to a Landsat TM image acquired over Ibitinga reservoir and, according to them; the model can be used as a quick assessment to infer water trophic state because it is based on the physical interaction between the light field and the phytoplankton optical properties (Kirk, 2011Kirk, J.T.O., 2011. Light and photosynthesis in aquatic ecosystems. 3rd ed. Cambridge: Cambridge University.).
In this study we assumed that the remote sensing trophic state index proposed by Novo et al. (2013)Novo, E.M.L.M., Londe, L.R., Barbosa, C.C.F., Araujo, C.A.S. and Rennó, C.D., 2013. Proposal for a remote sensing trophic state index based upon Thematic Mapper/Landsat images. Revista Ambiente & Água, vol. 8, pp. 65-82. can be applied to investigate how changes in HRT along the hydrologic year affect the spatial distribution of the phytoplankton blooms at Ibitinga´s reservoir surface. For that, we formulated two objectives: first to apply the Novo et al. (2013)Novo, E.M.L.M., Londe, L.R., Barbosa, C.C.F., Araujo, C.A.S. and Rennó, C.D., 2013. Proposal for a remote sensing trophic state index based upon Thematic Mapper/Landsat images. Revista Ambiente & Água, vol. 8, pp. 65-82. model to map chlorophyll-a concentration in the Ibitinga reservoir along the 2005 hydrologic year; second to assess how changes in HRT affect the spatial distribution of phytoplankton blooms.
2 Methods
2.1 Study site
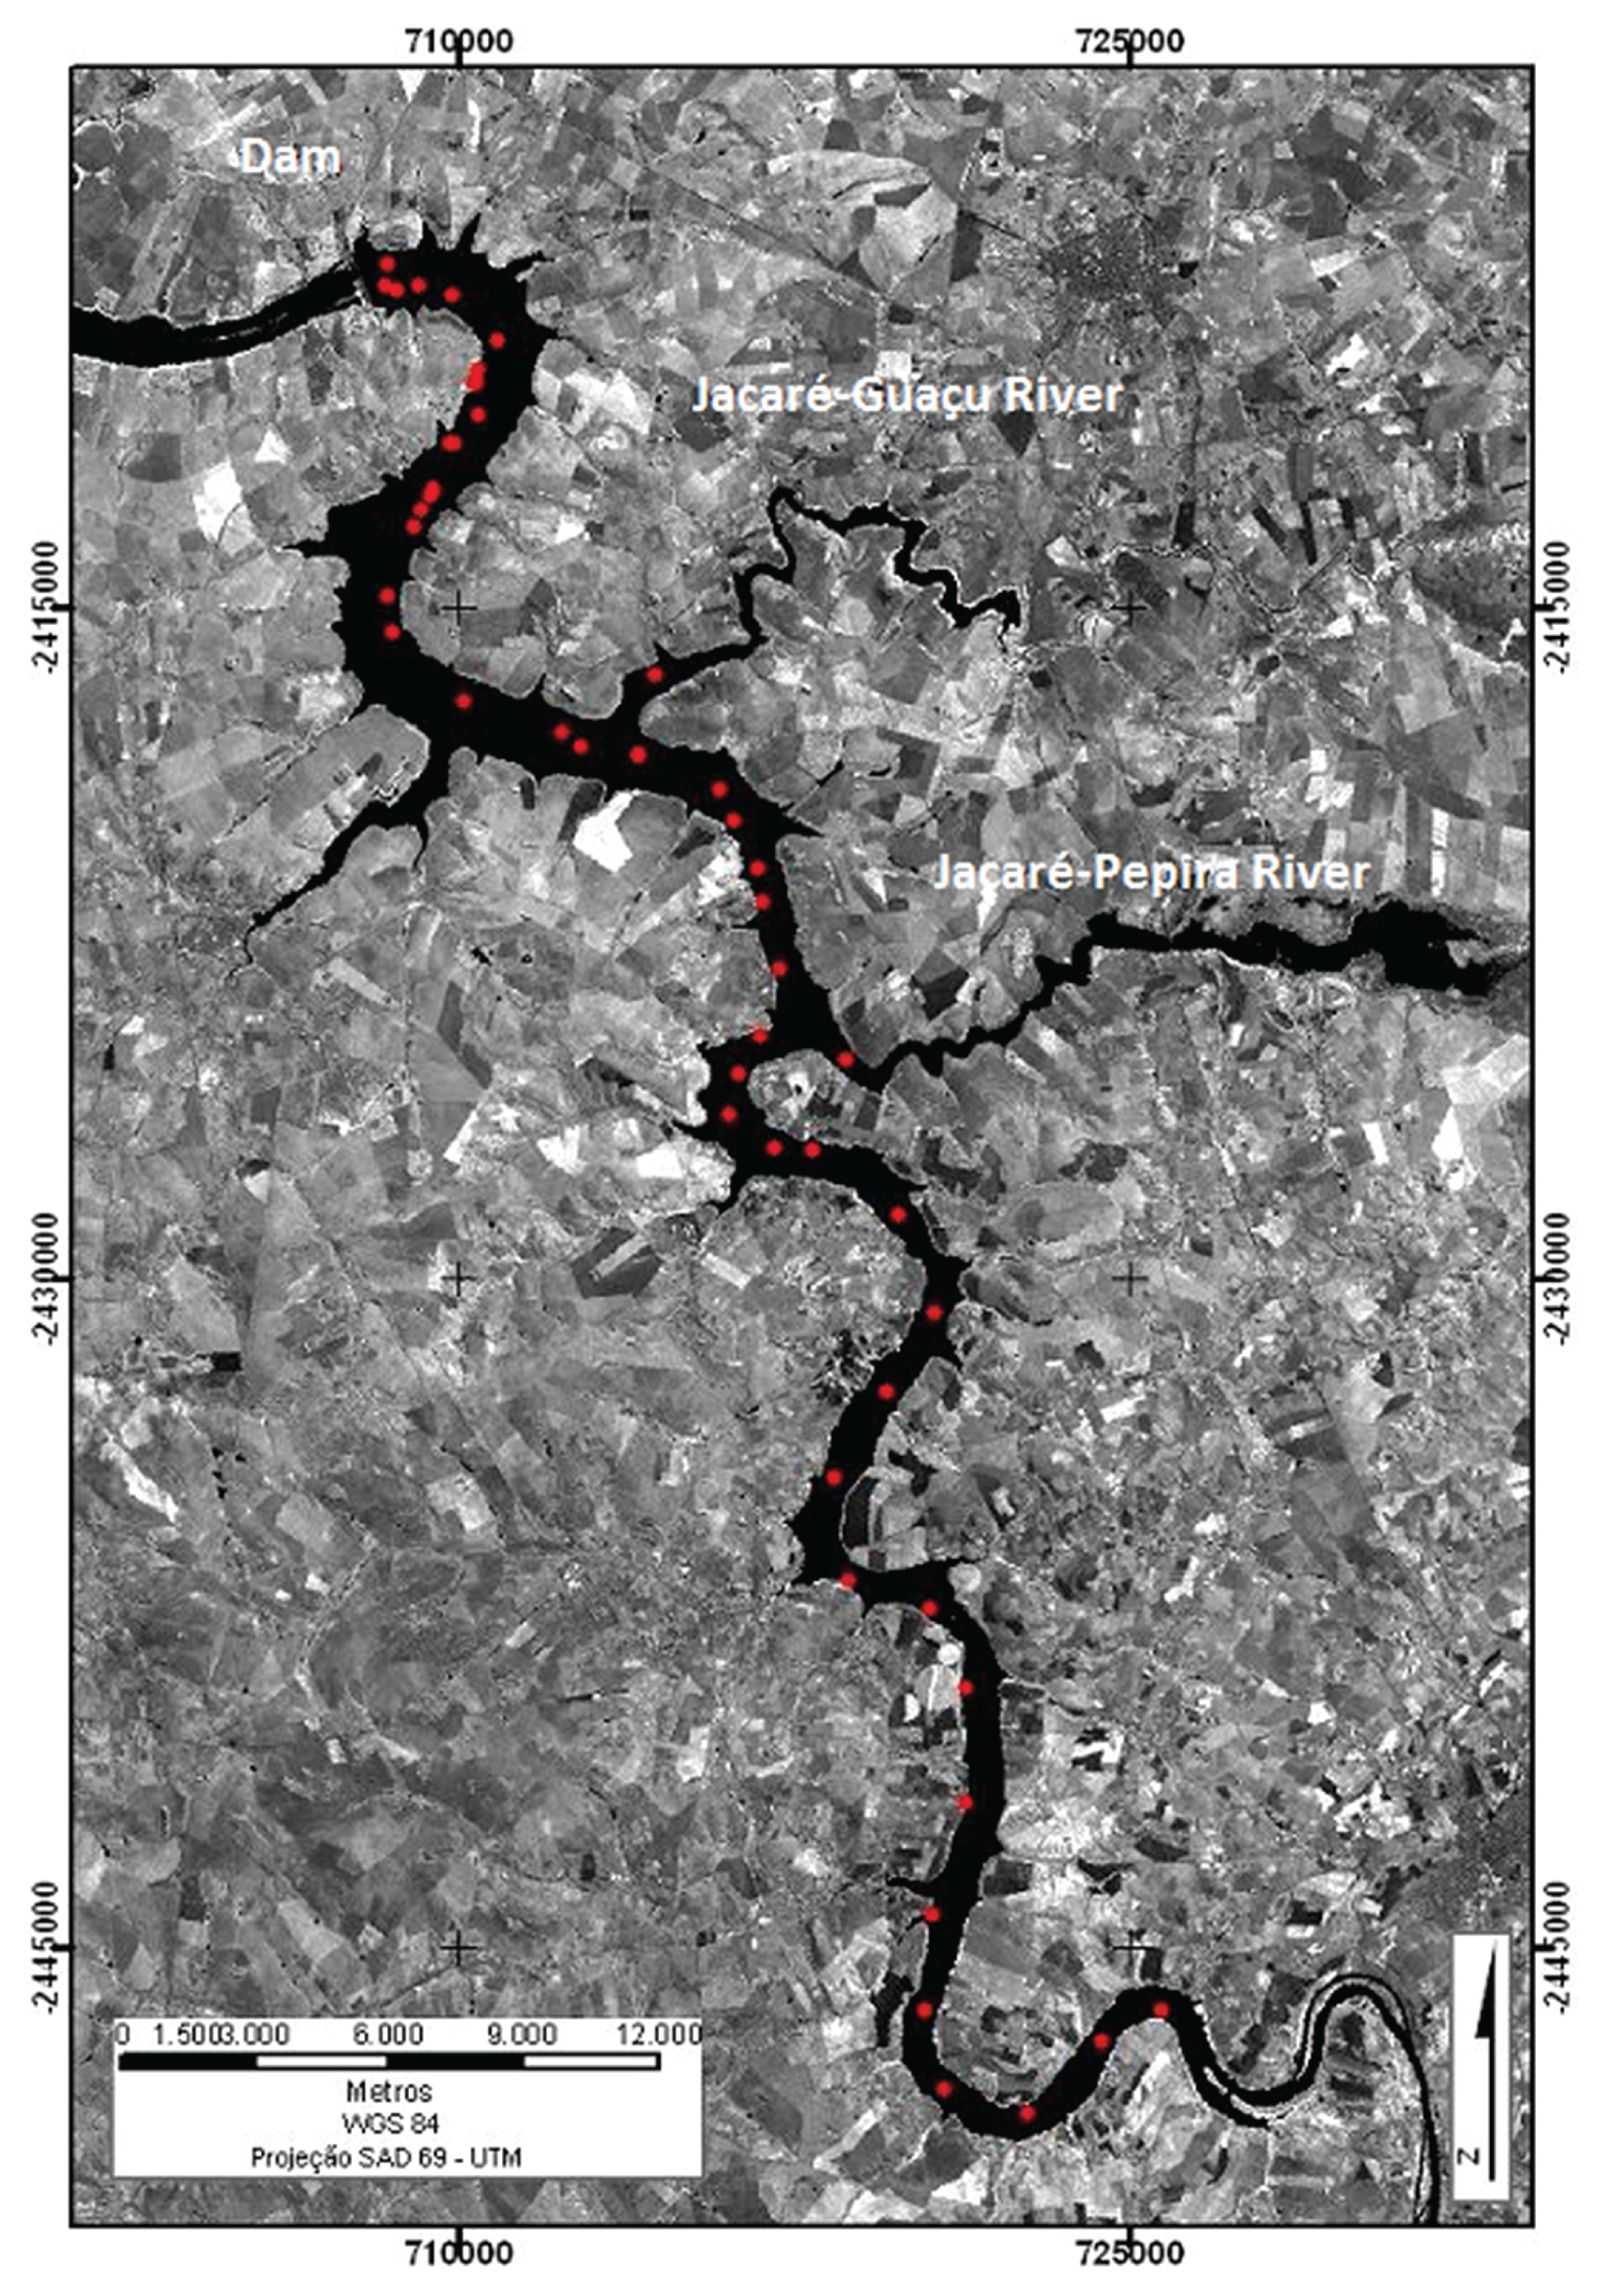
Ibitinga’s Reservoir, in the central region of São Paulo state (Brazil) is part of a cascade system along the Tietê River (Luzia, 2009Luzia, A.P., 2009. Estrutura organizacional do fitoplâncton nos sistemas lóticos e lênticos da bacia do Tietê- Jacaté (UGRHI-Tietê-Jacaré) em relação à qualidade da água e estado trófico. São Carlos: Centro de Ciências Biológicas e Saúde, Universidade Federal de São Carlos, 169 p. PhD Thesis.). The surrounding area is characterized by pasture, reforestation and sugarcane cultivations (Guimarães Júnior et al., 1998GUIMARÃES JÚNIOR, C., LEOPOLDO, R.R., CRUZ, J.A. and FONTANA, S.C., 1998. Aspectos limnológicos do reservatório de Ibitinga-SP. Revista Brasileira de Recursos Hídricos, vol. 3, no. 1, pp. 89-103.; Rudorff and Novo, 2007Rudorff, C.D.M. and Novo, E.M., 2007. Spectral mixture analysis for water quality assessment over the Amazon floodplain using Hyperion/EO-1 images. Ambiente & Água-An Interdisciplinary Journal of Applied Science, vol. 1, no. 2, pp. 65-79. http://dx.doi.org/10.4136/ambi-agua.13.
http://dx.doi.org/10.4136/ambi-agua.13...
).The reservoir is 70 Km long in Tietê River, 25 Km long in Jacaré-Guaçu River and 25 Km long in Jacaré-Pepira River (Figure 1). The main reservoir characteristics are presented in Table 1.

Ibitinga reservoir was chosen as study site because the LUT was developed using chlorophyll-a and remote sensing reflectance in situ data acquired in 2005 (Londe, 2008Londe, L.R., 2008 [viewed 10 May 2012]. Comportamento espectral do fitoplâncton de um reservatório brasileiro eutrofizado – Ibitinga (SP) [online]. São José dos Campos: Instituto Nacional de Pesquisas Espaciais, 223 p. PhD Thesis. Available from: http://urlib.net/sid.inpe.br/mtc-m18@80/2008/08.18.12.14
http://urlib.net/sid.inpe.br/mtc-m18@80/...
), implying that the empirical model was tuned to its environmental conditions. Moreover, previous studies in the reservoir reported that both limnological properties varied seasonally.
2.2 Chlorophyll-α estimation from remote sensing
A total of 06 TM/Landsat images were acquired from the Brazilian National Institute for Space Research. The selected images (February 13th; March 1st; May 4th; June 5th; September 9th; October 11th) consisted of all cloud-free scenes available for 2005. Each image was radiometrically calibrated to sensor radiance (Lsat), using the coefficients provided by Chander et al. (2009)Chander, G., Markham, B.L. and Helder, D.L., 2009. Summary of current radiometric calibration for Landsat MSS, TM, ETM+ and EO-1 ALI sensors. Remote Sensing of Environment, vol. 113, no. 5, pp. 893-903. http://dx.doi.org/10.1016/j.rse.2009.01.007.
http://dx.doi.org/10.1016/j.rse.2009.01....
, and ancillary data (solar elevation angle and acquisition date). Subsequently, atmospheric correction was performed using the “Fast Line-of-sight Atmospheric Analysis of Spectral Hypercubes” algorithm (FLAASH) which runs the MODTRAN (Moderate Spectral Resolution Atmospheric Transmitance Algorithm and computer model). MODTRAN uses image acquisition parameters as input data and requires some information to define the atmospheric model such as type of atmosphere particulates and visibility. Average scene elevation was obtained from reprocessed SRTM global digital elevation models (Valeriano, 2008Valeriano, M.M., 2008 [viewed 23 August 2012]. Topodata: guia de utilização de dados geomorfométricos locais [online]. São José dos Campos: INPE. 72 p. INPE-15318-RPE/818. Available from: http://urlib.net/8JMKD3MGP8W/33EPEBL
http://urlib.net/8JMKD3MGP8W/33EPEBL...
).
Given the limited availability of atmospheric data for model parameterization and sensor details, some tests were conducted to define, among the modeled input datasets, those appropriate for the study site. After several test runs, the Mid Latitude Summer (MLS) model was selected for estimating temperature and water vapor concentration, a Rural model for aerosol. Atmosphere visibility was estimated using dark pixels automatic identification in the scene (Kaufman et al., 1997Kaufman, Y.J., Wald, A.E., Remer, L.A., Gao, B.-C., Li, R.-R. and Flynn, L., 1997. The MODIS 2.1-µm channel-correlation with visible reflectance for use in remote sensing of aerosol. IEEE Transactions on Geoscience and Remote Sensing, vol. 35, no. 5, pp. 1286-1298. http://dx.doi.org/10.1109/36.628795.
http://dx.doi.org/10.1109/36.628795...
).
After both radiometric and atmospheric calibration, Ibitinga´s images corresponded to surface reflectance. The images were then geometrically corrected using an ortorectified image from GeoCover catalogue (Tucker et al., 2004Tucker, J., Grant, D.M. and Dykstra, J.D., 2004. NASA’s global orthorectified Landsat data set. Photogrammetric Engineering and Remote Sensing, vol. 70, no. 3, pp. 313-322. http://dx.doi.org/10.14358/PERS.70.3.313.
http://dx.doi.org/10.14358/PERS.70.3.313...
), with positional accuracy of 50m. For image registering at least 25 control points were selected, with a mean square error (MSE) lower than 0.5 (15 m).
A single-band density slicing was used to create a water mask to delineate the reservoir surface. Density slicing of TM band 5 gave the best visual approximation of the land/water boundary, avoiding the detection of phytoplankton blooms depicted in the near-infrared band. The mask was then overlaid upon the TM time series and submitted to manual/visual editing to remove any inconsistencies (cloud cover, cloud shadow, small differences in the land/water boundary related to water level fluctuations). The mask was then applied to bands TM 3 and TM-4 of the Landsat-5 time series.
There are alternating light and dark lines (stripes) in Landsat-5 TM images caused by changes in the input-output response of the detectors (Bernstein et al., 1984Bernstein, R., Lotspoech, J.B., Myers, H.J., Kolsky, H.G. and Lees, R.D., 1984. Analysis and processing of Landsat-4 sensor data using advanced image processing techniques and technologies. IEEE Transactions on Geoscience and Remote Sensing, vol. 3, pp. 192-221.). This effect is enhanced in uniform dark targets. Normally those stripes can be removed with destriping algorithms. However, TM3 and TM4 bands may present very low signal in scenes with clear water bodies. In this situation, the stripes are enhanced and are not easily removed with conventional destriping algorithms (Algazi and Ford, 1981Algazi, V.R. and Ford, G.E., 1981. Radiometric equalization of non-periodic striping in satellite data. Computer Graphics and Image Processing, vol. 16, no. 3, pp. 287-295. http://dx.doi.org/10.1016/0146-664X(81)90041-1.
http://dx.doi.org/10.1016/0146-664X(81)9...
; Schowengerdt, 2006Schowengerdt, R.A., 2006. Remote sensing: models and methods for image processing. Academic Press.). After testing several combinations of filtering algorithms and window sizes we used in some scenes a low-pass filter and a median filter (Arakawa, 1996Arakawa, K., 1996. Median filter based on fuzzy rules and its application to image restoration. Fuzzy Sets and Systems, vol. 77, no. 1, pp. 3-13. http://dx.doi.org/10.1016/0165-0114(95)00122-0.
http://dx.doi.org/10.1016/0165-0114(95)0...
) with dimensions varying from 3×3 and 5×5 pixel windows till noise was removed without blurring the reservoir borders.
After filtering, the band ratio TM4/TM3 for each date was computed and the LUT from Table 2 was applied. Due to the lack of ground data to assess the suitability of the LUT, we assume that the resulting phytoplankton bloom distribution can be accepted as an approximation.
Intervals for Chlorophyll-a concentration and values of TM4/TM3 ratio based on Novo et al. (2013)Novo, E.M.L.M., Londe, L.R., Barbosa, C.C.F., Araujo, C.A.S. and Rennó, C.D., 2013. Proposal for a remote sensing trophic state index based upon Thematic Mapper/Landsat images. Revista Ambiente & Água, vol. 8, pp. 65-82..
2.3 Hydraulic residence time (HRT)
Outflow data provided by the Brazilian Electric System National Operator (ONS) were used to analyze time changes in Ibitinga Reservoir during 2005. The HRT was computed assuming that the reservoir volume (V) was constant throughout the year. Instead of computing the average HRT for a given period, we computed the daily HRT by dividing V by the outflow (Q) in the date of the satellite overpass. We also computed the average hydraulic residence for the period of 15 days prior to satellite overpass.
3 Results and Discussion
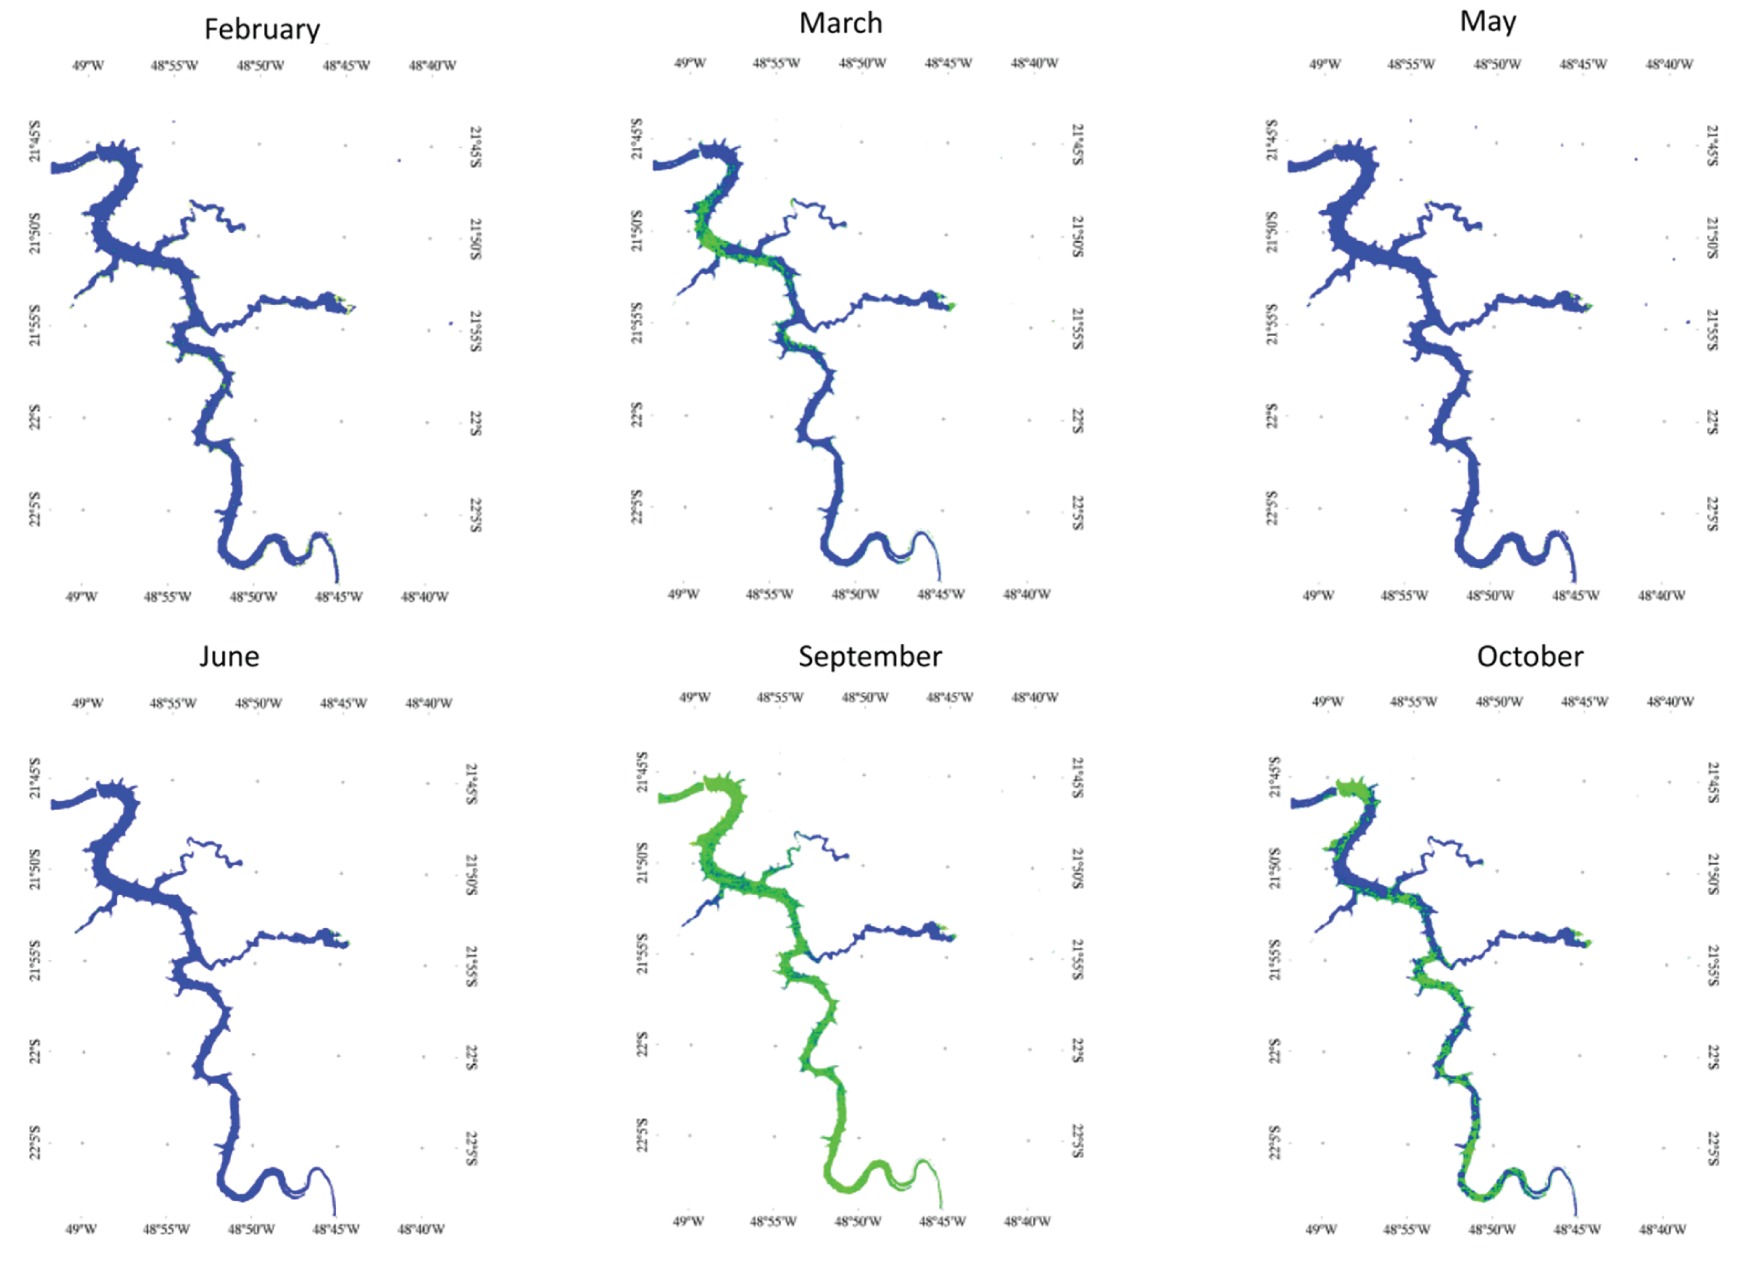
In spite of the fact that the LUT was developed for data acquired in October/2005, the results show that it captured the variability of the Ibitinga reservoir chlorophyll-a distribution in time and space. In February, most of the reservoir surface has chlorophyll-α concentrations smaller than 11.03 μg.L–1. In the following two months (March and May) the chlorophyll-α concentration increased and the middle and lower reaches of the reservoir became dominated by values above 30 μg.L–1, but the upper region and the Jacaré-Pepira and Jacaré-Guaçu Rivers showed concentrations up to 11 μg.L–1. In June, the main body of the reservoir, from up to downstream returns to chlorophyll-α concentration bellow 1.11 μg.L–1. Jacaré Pepira and Jacaré Guaçu inlets, however, keep the concentration levels observed in May. . In September and October, the reservoir displays very high chlorophyll-α concentration, whose values are far above μg.L–1, except for the Jacaré-Pepira and Jacaré-Guaçu inlets (Figure 2).

Spatial distribution of chlorophyll-α concentration classes based on the application of the LUT proposed by Novo et al. (2013)Novo, E.M.L.M., Londe, L.R., Barbosa, C.C.F., Araujo, C.A.S. and Rennó, C.D., 2013. Proposal for a remote sensing trophic state index based upon Thematic Mapper/Landsat images. Revista Ambiente & Água, vol. 8, pp. 65-82. on Landsat TM4/TM3 ratios.
In spite of uncertainties concerning the method used to map the chlorophyll-a concentration and the lack of ground information for their validation, except for October, chlorophyll-α concentration in the reservoir surface water seems to respond to HRT changes.
The hydraulic retention time during 2005 varied between a minimum of five days and a maximum of 52 days, with a modal hydraulic retention of 30 days. Actually during 52% of days in that year, the hydraulic retention time remained above 30 days, which is classified as high retention time.
Table 3 shows the HRT computed for a 15 day period previous to image acquisition (15-day average) and the daily HRT in the day of Landsat image acquisition. Except for June, both indices of HRT show an increase from February to October. This increase is related to the Ibitinga basin climate, characterized by a rainy season from November to March and a dry season from April to October (Figure 3).

30 year standard normal precipitation. Source: INMET (2014)INSTITUTO NACIONAL DE METEOROLOGIA – INMET, 2014 [viewed 18 November 2014]. [online]. Brasília. Available from: http://www.inmet.gov.br/
http://www.inmet.gov.br/... .
From January to March, when the reservoir is full because of high precipitation rates, the excess of water coming from the watershed needs to be spilled downstream, ensuring high outflow, and smaller HRT. As in May the precipitation decreases to almost one fourth of the rainy season, the outflow decreases at the same rate, but keeping spikes which respond either to instantaneous inflows caused by precipitation or to energy and water quality control demands (Tundisi et al., 2007Tundisi, J.G., Matsumura-Tundisi, T. and Abe, D.S., 2007. Climate Monitoring before and during limnological studies: a needed integration. Brazilian Journal of Biology = Revista Brasileira de Biologia, vol. 67, no. 4, pp. 795-796. http://dx.doi.org/10.1590/S1519-69842007000400034. PMid:18278341.
http://dx.doi.org/10.1590/S1519-69842007...
; Tundisi, 2007)Tundisi, J.G., 2007. Exploração do potencial hidrelétrico da Amazônia. Estudos Avançados, vol. 21, no. 59, pp. 109-117. http://dx.doi.org/10.1590/S0103-40142007000100009.
http://dx.doi.org/10.1590/S0103-40142007...
.
To assess the impact of HRT changes on the spatial distribution of phytoplankton blooms the following assumptions were accepted: 1) Given the very high baseline concentrations of chlorophyll -a at Ibitinga reservoir, a threshold of chlorophyll-a concentration above 69.05 μg/L was set to compute phytoplankton bloom area.; 2) this threshold is conservative and prevents from false bloom identification taking into account the methodological uncertainties of remotely sensed chlorophyll-a concentrations (Novo et al., 2013Novo, E.M.L.M., Londe, L.R., Barbosa, C.C.F., Araujo, C.A.S. and Rennó, C.D., 2013. Proposal for a remote sensing trophic state index based upon Thematic Mapper/Landsat images. Revista Ambiente & Água, vol. 8, pp. 65-82.; Novo and Stech, 2011Novo, E.M.L.M. and Stech, J.L., 2011. Novas tecnologias para o monitoramento e estudo de reservatórios hidrelétricos e grandes lagos. Rio de Janeiro: Parêntese, vol. único, pp. 219-254.). This strategy is supported by Reynolds (2006)REYNOLDS, C.S., 2006. The ecology of phytoplankton. New York: Cambridge. 535 p., whose findings indicate that the blooming process is not related to phytoplankton biomass abundance only, but to the abundance relative to a given aquatic system base level. Taking into account that Ibitinga is a eutrophic system, high chlorophyll-a concentrations are expected, independent of bloom occurrence.
Figure 4 shows time changes in the percentage of the reservoir surface occupied by phytoplankton blooms assuming that they occur when chlorophyll concentrations reach values larger than 69.05μg.L–1. The results show that in September and October, when HTR is larger than 30 days (Bennion et al., 2005Bennion, H., Hilton, J., Hughes, M., Clark, J., Hornby, D., Fozzard, I., Phillips, G. and Reynolds, C., 2005. The use of a GIS-based inventory to provide a national assessment of standing waters at risk from eutrophication in Great Britain. The Science of the Total Environment, vol. 344, no. 1-3, pp. 259-273. http://dx.doi.org/10.1016/j.scitotenv.2005.02.016. PMid:15907521.
http://dx.doi.org/10.1016/j.scitotenv.20...
) the reservoir surface is covered by continuous and dense phytoplankton blooms. In May, at the onset of the dry season in spite of the large HTR at the satellite overpass, the percentage of phytoplankton bloom covering Ibitinga surface is very small. Factors controlling phytoplankton growth other than HTR might have affected the development of extended and thick blooms. Among them, one can mention the decrease in Irradiance from January to June (Kirk, 2011Kirk, J.T.O., 2011. Light and photosynthesis in aquatic ecosystems. 3rd ed. Cambridge: Cambridge University.), and in the frequency of frontal systems in the region (Tundisi et al., 2004Tundisi, J.G., Matsumura-Tundisi, T., Arantes JUNIOR, J.D., Tundisi, J.E.M., Manzini, N.F. and Ducrot, R., 2004. The response of Carlos Botelho (Lobo, Broa) reservoir to the passage of cold fronts as reflected by physical, chemical, and biological variables. Brazilian Journal of Biology = Revista Brasileira de Biologia, vol. 64, no. 1, pp. 177-186. http://dx.doi.org/10.1590/S1519-69842004000100020. PMid:15195377.
http://dx.doi.org/10.1590/S1519-69842004...
).

Spatial distribution of phytoplankton blooms (blue= without dense and extended blooms; green=blooms).
The analyses of Figure 5 show that the percentage of the reservoir surface covered by dense and continuous blooms varied widely during 2005. In September, when HRT reaches 40 days, the extent of the phytoplankton bloom detected by the satellite reaches almost 80% of the reservoir surface. Still, even during periods of very low HRT, there are regions of phytoplankton bloom. In June, stratification might be also an explanation for the lack of extended blooms (Lewis, 2000Lewis, W.M., 2000. Basis for the protection and management of tropical lakes. Lakes and Reservoirs: Research and Management, vol. 5, no. 1, pp. 35-48. http://dx.doi.org/10.1046/j.1440-1770.2000.00091.x.
http://dx.doi.org/10.1046/j.1440-1770.20...
), they occur locally.

Percent of the Ibitinga reservoir surface covered by phytoplankton blooms with chlorophyll-a concentration larger than 69μg. L–1.
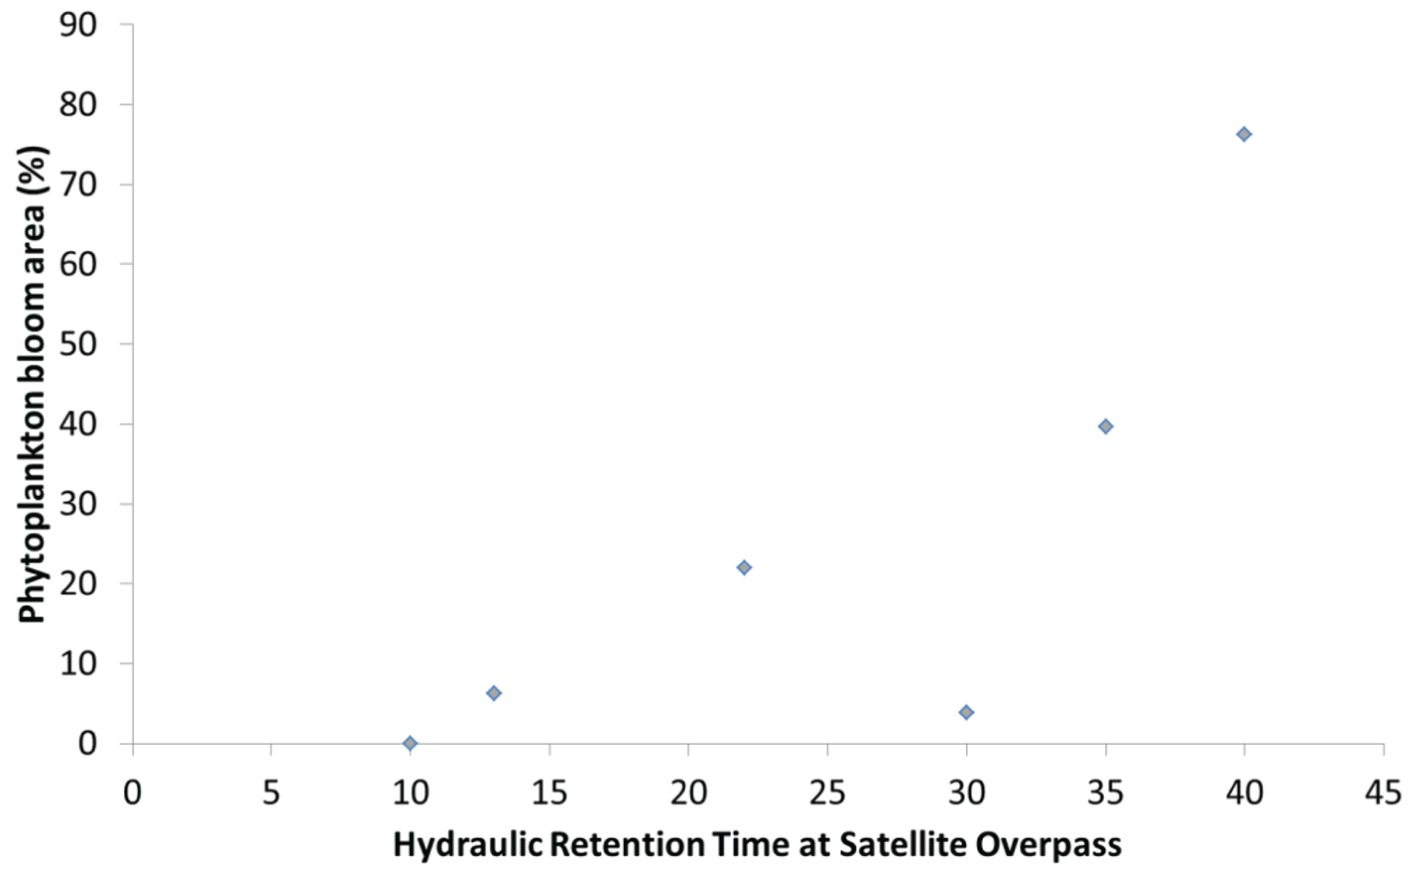
Figure 6 supports the idea that the HTR controls a great deal of the extent to which Ibitinga reservoir surface will experience phytoplankton bloom. Except for May-2005, increases in HTR correspond to proportional increases in the reservoir surface occupied by phytoplankton blooms. Despite the limited number of observations, the results suggest that nuisance blooms in the Ibitinga reservoir can be prevented by keeping the residence time bellow 20 days, mainly during spring time.

Percentage of reservoir surface classified as super to hypereutrophic versus hydraulic residence time (days).
4 Conclusion
The use of remotely sensed chlorophyll-a concentration allowed mapping the area occupied by dense and extended phytoplankton blooms. The percentage of the reservoir area covered by the blooms showed a strong relationship with the HRT during 2005. In spite of the limited number of observations, the results corroborate the importance of the HRT for explaining the increase in the frequency and extended blooms in eutrophic reservoirs such as Ibitinga. Remote sensing techniques, despite the uncertainty in the determination of chlorophyll-a concentration, proved to be an useful tool to investigate time changes in chlorophyll-a distribution. It also proved to be useful to investigate the relationship between HRT and the occurrence of phytoplankton bloom.
-
(With 6 figures)
References
- Algazi, V.R. and Ford, G.E., 1981. Radiometric equalization of non-periodic striping in satellite data. Computer Graphics and Image Processing, vol. 16, no. 3, pp. 287-295. http://dx.doi.org/10.1016/0146-664X(81)90041-1
» http://dx.doi.org/10.1016/0146-664X(81)90041-1 - Andersen, J.H., Schlüter, L. and Ærtebjerg, G., 2006. Coastal eutrophication: recent developments in definitions and implications for monitoring strategies. Journal of Plankton Research, vol. 28, no. 7, pp. 621-628. http://dx.doi.org/10.1093/plankt/fbl001
» http://dx.doi.org/10.1093/plankt/fbl001 - Arakawa, K., 1996. Median filter based on fuzzy rules and its application to image restoration. Fuzzy Sets and Systems, vol. 77, no. 1, pp. 3-13. http://dx.doi.org/10.1016/0165-0114(95)00122-0
» http://dx.doi.org/10.1016/0165-0114(95)00122-0 - Bennion, H., Hilton, J., Hughes, M., Clark, J., Hornby, D., Fozzard, I., Phillips, G. and Reynolds, C., 2005. The use of a GIS-based inventory to provide a national assessment of standing waters at risk from eutrophication in Great Britain. The Science of the Total Environment, vol. 344, no. 1-3, pp. 259-273. http://dx.doi.org/10.1016/j.scitotenv.2005.02.016 PMid:15907521.
» http://dx.doi.org/10.1016/j.scitotenv.2005.02.016 - Bernstein, R., Lotspoech, J.B., Myers, H.J., Kolsky, H.G. and Lees, R.D., 1984. Analysis and processing of Landsat-4 sensor data using advanced image processing techniques and technologies. IEEE Transactions on Geoscience and Remote Sensing, vol. 3, pp. 192-221.
- Carlson, R.E., 1974. A trophic state index for lakes. Minneapolis: Limnological Research Center, University of Minnesota. 17 p. Contribution, no. 141.
- Chander, G., Markham, B.L. and Helder, D.L., 2009. Summary of current radiometric calibration for Landsat MSS, TM, ETM+ and EO-1 ALI sensors. Remote Sensing of Environment, vol. 113, no. 5, pp. 893-903. http://dx.doi.org/10.1016/j.rse.2009.01.007
» http://dx.doi.org/10.1016/j.rse.2009.01.007 - COMPANHIA AMBIENTAL DO ESTADO DE SÃO PAULO – CETESB, 1974. Resultados de análises: reconhecimento das condições atuais sanitárias e ecológicas do Rio Tiete: estudo de eutrofização das represas da bacia do Tietê. São Paulo: CETESB. vol. 3.
- COMPANHIA AMBIENTAL DO ESTADO DE SÃO PAULO – CETESB, 2001. Relatório de qualidade das águas interiores do estado de São Paulo 2000. São Paulo: CETESB. 214 p. vol. 1.
- COMPANHIA AMBIENTAL DO ESTADO DE SÃO PAULO – CETESB, 2012 [viewed 30 June 2012]. Índice de qualidade das águas [online]. São Paulo: CETESB. Available from: http://www.cetesb.sp.gov.br/agua/%C3%A1guas-superficiais/108-%C3%ADndices-de-qualidade-das-%C3%A1guas
» http://www.cetesb.sp.gov.br/agua/%C3%A1guas-superficiais/108-%C3%ADndices-de-qualidade-das-%C3%A1guas - Dall'Olmo, G. and Gitelson, A.A., 2005. Effect of bio-optical parameter variability on the remote estimation of chlorophyll-a concentration in turbid productive waters: experimental results. Applied Optics, vol. 44, no. 3, pp. 412-422. http://dx.doi.org/10.1364/AO.44.000412 PMid:15717831.
» http://dx.doi.org/10.1364/AO.44.000412 - Dillon, P.J., 1974. A critical review of Vollenweider’s nutrient budget model and other related models. Water Resources Bulletin, vol. 10, no. 5, pp. 969-989. http://dx.doi.org/10.1111/j.1752-1688.1974.tb00617.x
» http://dx.doi.org/10.1111/j.1752-1688.1974.tb00617.x - Dillon, P.J., 1975. The phosphorus budget of Cameron Lake: the importance of flushing rate to the degree of eutrophy in lakes.Limnology and Oceonography, vol. 19, no. 1, pp. 28-39. http://dx.doi.org/10.4319/lo.1975.20.1.0028
» http://dx.doi.org/10.4319/lo.1975.20.1.0028 - Dillon, P.J. and Kirchner, W.B., 1975. The effects of geology and land use on the export of phosphorus from watersheds. Water Research, vol. 9, no. 2, pp. 135-148. http://dx.doi.org/10.1016/0043-1354(75)90002-0
» http://dx.doi.org/10.1016/0043-1354(75)90002-0 - Duan, H., Zhang, Y., Zhang, B., Song, K. and Wang, Z., 2007. Assessment of chlorophyll-a concentration and trophic state for Lake Chagan using Landsat TM and field spectral data. Environmental Monitoring and Assessment, vol. 129, no. 1-3, pp. 295-308. http://dx.doi.org/10.1007/s10661-006-9362-y PMid:17057973.
» http://dx.doi.org/10.1007/s10661-006-9362-y - ENVIRONMENTAL PROTECTION AGENCY – EPA, 1978. Summary analysis of the North American (U.S. Portiona) OECD eutrophication project: nutrient loading – lake response relationships and trophic state indices. Corvallis: Environmental Research Laboratory Office of Research and Development. Ecological Research Series, no. EPA-600/3-78-008.
- Gitelson, A., Garbuzov, G., Szilagyi, F., Mittenzwey, K.H., Karnieli, A. and Kaiser, A., 1993. Quantitative remote sensing methods for real-time monitoring of inland waters quality. International Journal of Remote Sensing, vol. 14, no. 7, pp. 1269-1295. http://dx.doi.org/10.1080/01431169308953956
» http://dx.doi.org/10.1080/01431169308953956 - Gitelson, A., Mayo, M., Yacobi, Y.Z., Parparov, A. and Berman, T., 1994. The use of high-spectral-resolution radiometer data for detection of low chlorophyll concentrations in Lake Kinneret. Journal of Plankton Research, vol. 16, no. 8, pp. 993-1002. http://dx.doi.org/10.1093/plankt/16.8.993
» http://dx.doi.org/10.1093/plankt/16.8.993 - GUIMARÃES JÚNIOR, C., LEOPOLDO, R.R., CRUZ, J.A. and FONTANA, S.C., 1998. Aspectos limnológicos do reservatório de Ibitinga-SP. Revista Brasileira de Recursos Hídricos, vol. 3, no. 1, pp. 89-103.
- INSTITUTO NACIONAL DE METEOROLOGIA – INMET, 2014 [viewed 18 November 2014]. [online]. Brasília. Available from: http://www.inmet.gov.br/
» http://www.inmet.gov.br/ - Kaufman, Y.J., Wald, A.E., Remer, L.A., Gao, B.-C., Li, R.-R. and Flynn, L., 1997. The MODIS 2.1-µm channel-correlation with visible reflectance for use in remote sensing of aerosol. IEEE Transactions on Geoscience and Remote Sensing, vol. 35, no. 5, pp. 1286-1298. http://dx.doi.org/10.1109/36.628795
» http://dx.doi.org/10.1109/36.628795 - Kirk, J.T.O., 2011. Light and photosynthesis in aquatic ecosystems. 3rd ed. Cambridge: Cambridge University.
- Lewis, W.M., 2000. Basis for the protection and management of tropical lakes. Lakes and Reservoirs: Research and Management, vol. 5, no. 1, pp. 35-48. http://dx.doi.org/10.1046/j.1440-1770.2000.00091.x
» http://dx.doi.org/10.1046/j.1440-1770.2000.00091.x - Londe, L.R., 2008 [viewed 10 May 2012]. Comportamento espectral do fitoplâncton de um reservatório brasileiro eutrofizado – Ibitinga (SP) [online]. São José dos Campos: Instituto Nacional de Pesquisas Espaciais, 223 p. PhD Thesis. Available from: http://urlib.net/sid.inpe.br/mtc-m18@80/2008/08.18.12.14
» http://urlib.net/sid.inpe.br/mtc-m18@80/2008/08.18.12.14 - Londe, L.R., Novo, E.M.L.M. and Calijuri, M.C., 2011. Aplicação de técnicas de sensoriamento remoto ao estudo do fitoplâncton de águas interiores. In: E. ALCÂNTARA, E.M.L.M. NOVO and J.L. STECH, eds. Novas tecnologias para o monitoramento e estudo de reservatórios hidrelétricos e grandes lagos. Rio de Janeiro: Parêntese, vol. único, pp. 219-254.
- Luzia, A.P., 2009. Estrutura organizacional do fitoplâncton nos sistemas lóticos e lênticos da bacia do Tietê- Jacaté (UGRHI-Tietê-Jacaré) em relação à qualidade da água e estado trófico. São Carlos: Centro de Ciências Biológicas e Saúde, Universidade Federal de São Carlos, 169 p. PhD Thesis.
- Moses, W.J., Gitelson, A.A., Berdnikov, S., Saprygin, V. and Povazhnyi, V., 2012. Operational MERIS-based NIR-red algorithms for estimating chlorophyll-< i> a</i> concentrations in coastal waters—The Azov Sea case study. Remote Sensing of Environment, vol. 121, pp. 118-124. http://dx.doi.org/10.1016/j.rse.2012.01.024
» http://dx.doi.org/10.1016/j.rse.2012.01.024 - Novo, E.M.L.M. and Stech, J.L., 2011. Novas tecnologias para o monitoramento e estudo de reservatórios hidrelétricos e grandes lagos. Rio de Janeiro: Parêntese, vol. único, pp. 219-254.
- Novo, E.M.L.M., Londe, L.R., Barbosa, C.C.F., Araujo, C.A.S. and Rennó, C.D., 2013. Proposal for a remote sensing trophic state index based upon Thematic Mapper/Landsat images. Revista Ambiente & Água, vol. 8, pp. 65-82.
- ORGANIZATION FOR ECONOMIC COOPERATION AND DEVELOPMENT – OECD, 1982. Eutrophication of water: monitoring, assessment and control. Paris.
- REYNOLDS, C.S., 2006. The ecology of phytoplankton. New York: Cambridge. 535 p.
- Ruddick, K.G., Gons, H.J., Rijkeboer, M. and Tilstone, G., 2001. Optical remote sensing of chlorophyll a in case 2 waters by use of an adaptive two-band algorithm with optimal error properties. Applied Optics, vol. 40, no. 21, pp. 3575-3585. http://dx.doi.org/10.1364/AO.40.003575 PMid:18360387.
» http://dx.doi.org/10.1364/AO.40.003575 - Rudorff, C.D.M. and Novo, E.M., 2007. Spectral mixture analysis for water quality assessment over the Amazon floodplain using Hyperion/EO-1 images. Ambiente & Água-An Interdisciplinary Journal of Applied Science, vol. 1, no. 2, pp. 65-79. http://dx.doi.org/10.4136/ambi-agua.13
» http://dx.doi.org/10.4136/ambi-agua.13 - SÃO PAULO. Secretaria de Saneamento e Recursos Hídricos. Coordenadoria de Recursos Hídricos, 2011. Relatório de Situação dos Recursos Hídricos do Estado de São Paulo. São Paulo. 208 p.
- Schowengerdt, R.A., 2006. Remote sensing: models and methods for image processing. Academic Press.
- Smith, V.H., 2007. Using primary productivity as an index of coastal eutrophication: the units of measurement matter. Journal of Plankton Research, vol. 29, no. 1, pp. 1-6. http://dx.doi.org/10.1093/plankt/fbl061
» http://dx.doi.org/10.1093/plankt/fbl061 - Straškraba, M., 1999. Retention time as a key variable of reservoir limnology. In: J.G. TUNDISI and M. STRAŠKRABA, eds. Theoretical reservoir ecology and its applications. São Carlos: International Institute of Ecology, Brazilian Academy of Sciences, Backhuys Publishers, cap. 16, pp. 385-410.
- TOLEDO JUNIOR, A. P., 1990. Informe preliminar sobre os estudos para a obtenção de um índice para a avaliação simplificada do estado trófico de reservatórios de regiões quentes tropicais. São Paulo: CETESB. 43 p. Relatório Técnico.
- Tucker, J., Grant, D.M. and Dykstra, J.D., 2004. NASA’s global orthorectified Landsat data set. Photogrammetric Engineering and Remote Sensing, vol. 70, no. 3, pp. 313-322. http://dx.doi.org/10.14358/PERS.70.3.313
» http://dx.doi.org/10.14358/PERS.70.3.313 - Tundisi, J.G., 2003. Água no século XXI: enfrentando a escassez. São Carlos: RiMA, IIE. 248 p.
- Tundisi, J.G., 2007. Exploração do potencial hidrelétrico da Amazônia. Estudos Avançados, vol. 21, no. 59, pp. 109-117. http://dx.doi.org/10.1590/S0103-40142007000100009
» http://dx.doi.org/10.1590/S0103-40142007000100009 - Tundisi, J.G., Matsumura-Tundisi, T. and Abe, D.S., 2007. Climate Monitoring before and during limnological studies: a needed integration. Brazilian Journal of Biology = Revista Brasileira de Biologia, vol. 67, no. 4, pp. 795-796. http://dx.doi.org/10.1590/S1519-69842007000400034 PMid:18278341.
» http://dx.doi.org/10.1590/S1519-69842007000400034 - Tundisi, J.G., Matsumura-Tundisi, T., Arantes JUNIOR, J.D., Tundisi, J.E.M., Manzini, N.F. and Ducrot, R., 2004. The response of Carlos Botelho (Lobo, Broa) reservoir to the passage of cold fronts as reflected by physical, chemical, and biological variables. Brazilian Journal of Biology = Revista Brasileira de Biologia, vol. 64, no. 1, pp. 177-186. http://dx.doi.org/10.1590/S1519-69842004000100020 PMid:15195377.
» http://dx.doi.org/10.1590/S1519-69842004000100020 - Tundisi, J.G., Matsumura-Tundisi, T., Calijuri, M.C. and Novo, E.M.L., 1991. Comparative limnology of five reservoirs in the middle Tietê River, S. Paulo State. Verhandlungen des Internationalen Verein Limnologie, vol. 24, pp. 1489-1496.
- Tundisi, J.G., Matsumura-Tundisi, T., Pareschi, D.C., Luzia, A.P., Von Haeling, P.H. and Frollini, E.H., 2008. A bacia hidrográfica do Tietê/Jacaré: estudo de caso em pesquisa e gerenciamento. Estudos Avançados, vol. 22, no. 63, pp. 159-172. http://dx.doi.org/10.1590/S0103-40142008000200010
» http://dx.doi.org/10.1590/S0103-40142008000200010 - Valeriano, M.M., 2008 [viewed 23 August 2012]. Topodata: guia de utilização de dados geomorfométricos locais [online]. São José dos Campos: INPE. 72 p. INPE-15318-RPE/818. Available from: http://urlib.net/8JMKD3MGP8W/33EPEBL
» http://urlib.net/8JMKD3MGP8W/33EPEBL - Vollenweider, R.A., 1968. Scientific fundamentals of the eutrophication of lakes and flowing waters, with particular reference to nitrogen and phosphorus as factors in eutophication. Paris: UNESCO. OECD Technical Report, DAS/CSI/68.
- Zimba, P.V. and Gitelson, A., 2006. Remote estimation of chlorophyll concentration in hyper-eutrophic aquatic systems: Model tuning and accuracy . optimizationAquaculture, vol. 256, no. 1, pp. 272-286. http://dx.doi.org/10.1016/j.aquaculture.2006.02.038
» http://dx.doi.org/10.1016/j.aquaculture.2006.02.038
Publication Dates
-
Publication in this collection
03 May 2016 -
Date of issue
Jul-Sep 2016
History
-
Received
18 Nov 2014 -
Accepted
07 May 2015