Abstract
Assess the state of public green areas, their importance and influence on environmental quality and living in urban centers is an arduous task considering the conceptual and scientific regarding quantification and data analysis methods divergence. In this study, we aimed to determine two indicators of public green areas relative to the percentage of public green areas (PPGA) and the public green areas index (PGAI) in the urban area of São Carlos, SP. The study area was organized into administrative regions (ARs), using satellite images, topographical maps of 1:10,000 Geographic and Cartographic Institute (1990) and data provided by the Municipality of São Carlos. The results show that public green areas comprise 6.55% of the municipality, with a public green areas index (PGAI) of 18.85 m2/inhabitant, indicating good urban environmental quality when compared to rates of 15 m2/capita for public green areas for recreation, suggested by the Brazilian Society of Urban Forestry. The differences between the administrative regions are concern with situations from 4.16 to 36.30 m2/inhabitant. In this context, it is recommend specific public policies and popular participation in the process of continuous improvement for increasing public green areas in the less favored regions. The Genebrino method applied to indicators of public green areas (GPGA – amount of public green areas divided by population density), showed a commendable goal above 40% for urban environmental quality.
Keywords:
urban forest; administrative regions; Genebrino Index; planning urban spaces
Resumo
Diagnosticar a situação das áreas verdes públicas, sua importância e influência na qualidade ambiental e de vida nos centros urbanos é uma tarefa árdua, considerando a divergência conceitual e de métodos científicos no que tange a quantificação e a análise dos dados. Neste estudo, objetivou-se determinar dois indicadores de áreas verdes públicas, referentes ao percentual de áreas verdes públicas (PAVP) e ao índice de áreas verdes públicas (IAVP) no perímetro urbano do Município de São Carlos, SP. A área de estudo foi organizada em regiões administrativas (RAs), utilizando imagens de satélite, cartas topográficas 1:10.000 do Instituto Geográfico e Cartográfico (1990) e dados fornecidos pela Prefeitura Municipal de São Carlos. Os resultados demonstram que as áreas verdes públicas compreendem 6,55% do território do município, com um índice de áreas verdes públicas (IAVP) de 18,85 m2/habitante, indicando uma boa qualidade ambiental urbana quando comparado aos índices de 15 m2/habitante para áreas verdes públicas destinadas à recreação, sugerido pela Sociedade Brasileira de Arborização Urbana. As diferenças entre as regiões administrativas são preocupantes, com situações de 4,16 a 36,30 m2/habitantes. Neste contexto, recomendam-se políticas públicas específicas e a participação popular no processo de melhoria contínua para o incremento das áreas verdes públicas nas regiões menos favorecidas. O método genebrino, aplicado aos indicadores de áreas verdes públicas (IAVP – somatório das áreas verdes públicas dividido pela densidade populacional), apontou uma meta recomendável acima de 40% para a qualidade ambiental urbana.
Palavras-chave:
vegetação urbana; regiões administrativas; Índice Genebrino; planejamento de espaços urbanos
1 Introduction
Urban space is a scene of constant change where not always the interests of society converge with the need to interact with nature, or even with the concern to preserve the urban forest fragments, whether public or private.
This divergence between the built and natural scenarios happens due to the inefficiency of public policies in the planning of cities, reflecting the poor environmental and quality of life (Matias et al., 2008MATIAS, L.F., CARVALHO, J.C.B., MARGUTI, B.O. and FARIAS, F.O., 2008 [viewed 20 December 2013]. Mapeamento do uso da terra na cidade de Paulínia (SP): desenvolvimento de aspectos metodológicos para detalhamento intra-urbano. In: Anais do XV Encontro Nacional de Geógrafos [online], 20-26 July 2008, São Paulo. São Paulo: Unicamp. Available from: http://www.agb.org.br/
http://www.agb.org.br/...
).
The search for solutions to municipalities is a process where must be considered the social and environmental dimension, and the use and occupation of the territory, beyond the conditions and characteristics present in urban space (Peres and Pugliesi, 2012Peres, R.B. and Pugliesi, E., 2012. As influências das políticas e do planejamento urbano no desenho de cidades mais sustentáveis: avanços e desafios voltados à realidade brasileira. In: A.R. OMETTO, R.B. PERES, and Y.M.B. SAAVEDRA, orgs. Ecoinovação para a melhoria ambiental de produtos e serviços: experiências espanholas e brasileiras nos setores industrial, urbano e agrícola. São Carlos: Diagrama Editorial, pp. 165-178.).
Vieira (2004)Vieira, P.B.H., 2004. Uma visão geográfica das áreas verdes de Florianópolis, SC: estudo de caso do Parque Ecológico do Córrego Grande (PECG). Florianópolis: Universidade Federal de Santa Catarina. Trabalho de Conclusão de Curso. highlights the concern about the quality and maintenance of urban green areas that are not always proportional to the expansion of urban growth areas.
The removal of urban vegetation interferes with the climate and consequently the quality of life of the human population, causing an increasing thermal discomfort, by increasing temperature (Shams et al., 2009SHAMS, J.C.A., GIACOMELI, D.C., and SUCOMINE, N.M., 2009. Emprego da arborização na melhoria do conforto térmico nos espaços livres públicos. Revista da Sociedade Brasileira de Arborização Urbana, vol. 4, no. 4, pp. 1-16.). Barbosa and Vecchia (2009)Barbosa, R.V.R. and VECCHIA, F.A.S., 2009. Estudos de ilha de calor urbana por meio de imagens do Landsat 7 ETM+: estudo de caso em São Carlos (SP). Reviews in Mineralogy, vol. 6, no. 3, pp. 273-278. attribute to the density of buildings, paving the ground and lower rates of woody vegetation the formation of heat islands, especially in the areas of trade and service.
Considering the vegetation as an important indicator of urban environmental quality, Caporusso and Lindon (2008)Caporusso, D. and Lindon, F.M., 2008. Áreas verdes urbanas: avaliação e proposta conceitual. In: VIII Seminário de Pós-graduação em Geografia da UNESP, 2008, Rio Claro. Rio Claro: UNESP. pp. 71-87. highlighted the importance of scientific papers that use the Green Area Index (GAI) as a technique for quantification and evaluation of urban vegetation. However, the divergence in the concept of green areas adopted by several authors, hampers the definition of a minimum ratio of vegetation cover in urban areas, leading to adaptations to establish internationally accepted indices (Oliveira et al., 1999Oliveira, C.H., SANTOS, J.E. and PIRES, J.S., 1999. Indicadores de arborização urbana da cidade de São Carlos (SP) com o uso do SIG-IDRISI. Brazilian Journal of Ecology, ano 3, no. 1, pp. 1-9.). The Brazilian Society of Urban Forestry (SBAU) suggests a minimum rate for public green areas for recreation, the value of 15 m2/inhab (SBAU, 1996SOCIEDADE BRASILEIRA DE ARBORIZAÇÃO URBANA – SBAU, 1996. Carta a Londrina e Ibiporã. Boletim Informativo, vol. 3, no. 5, pp. 3.).
Alvarez (2004)Alvarez, I.A., 2004. Qualidade do espaço verde urbano: uma proposta de índice de avaliação. Piracicaba: Escola Superior de Agricultura Luiz de Queiroz, Universidade de São Paulo, 187 p. PhD Thesis in Fitotecnia. argue the importance and necessity of using different methods of analysis, beyond quantitative, to obtain indicators of environmental quality.
The objective of this study was to map and analyze the current situation of public green areas of the administrative regions of São Carlos, SP to provide grants to urban and environmental planning.
2 Material and Methods
2.1 Area of study
The study area is within the city limits of the Municipality of San Carlos located at The Water Resources Management Unit - Tietê-Jacaré. The county occupies 1,137 km2, with 62 km2 of urbanized area with a population of 221.950 inhabitants (IBGE, 2010INSTITUTO BRASILEIRO DE GEOGRAFIA E ESTATÍSTICA – IBGE, 2010 [viewed 20 December 2013]. Cidades: São Paulo - São Carlos [online]. Rio de Janeiro: IBGE. Available from: http://cidades.ibge.gov.br/xtras/perfil.php?lang=&codmun=354890&search=sao-paulo|sao-carlos
http://cidades.ibge.gov.br/xtras/perfil....
).
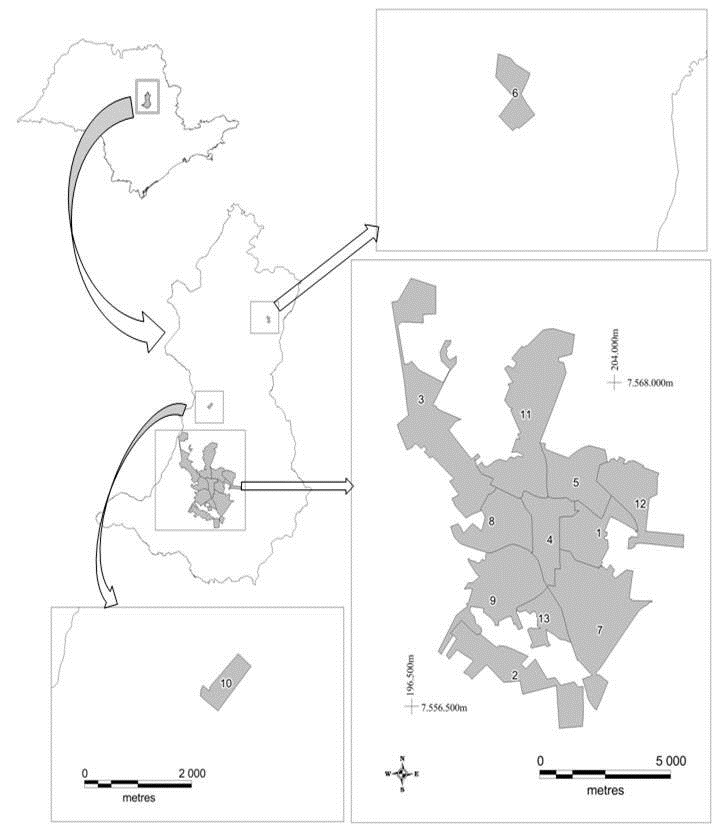
The urban area was divided into thirteen geographically distinct regions defined as Administrative Regions (ARs). The ARs were defined and organized by the governance of São Carlos based on groupings of surrounding neighborhoods, to facilitate popular participation in planning management actions of the municipality. This administrative structure was started in 2001, based on the organic law of São Carlos city (São Carlos, 2010SÃO CARLOS. Prefeitura Municipal, 2010. Emenda Substitutiva nº 01 à Lei Orgânica do Município, de 20 de dezembro de 2010. Dispõe sobre a organização do município de São Carlos. Câmara Municipal de São Carlos, São Carlos, 20 dec.) (Figure 1).

2.2 Getting spatial data
The vector data limits the public areas were provided by governance of São Carlos were overlapped to the image of CBERS-2B, HRC sensor, orbit 156_D point 125_1, changeover date June 29, 2009 (resolution 2.5 m).
The record of the satellite image was refined in MapInfo 11 program, based on 1:10,000 topographic maps of Geographic and Cartographic Institute (IGC, 1990INSTITUTO GEOGRÁFICO E CARTOGRÁFICO DO ESTADO DE SÃO PAULO – IGC, 1990. Plano Cartográfico do Estado de São Paulo [escala 1:10.000], Folha Córrego Água Santa [SF-23-V-C-IV-2-SO-B] e Folha Ribeirão Vassununga [SF-23-V-C-IV-2-NO-F]. São Paulo: IGC.).
The vectors of Public areas were overlaid on the the satellite image and kept only those that configure public green areas.
The public green areas were defined by the overlap of China-Brazil Earth Resources Satellite (CBERS) image, Google Earth, 2013 and 2014 visits and direct investigation in the ARs.
In this study the concept of public green areas was used according to Lima et al. (1994)LIMA, A.M.L.P., CAVALHEIRO, C., NUCCI, J.C., SOUSA, M.A.L.B., FIALHO, N.O. and DEL PICCHIA, P.C.D., 1994. Problemas e utilização na conceituação de termos como espaços livres, áreas verdes e correlatos. In: Anais do Congresso Brasileiro sobre Arborização Urbano, 1994, São Luís, MA. São Luís: Sociedade Brasileira de Arborização Urbana, pp. 539-553., which includes leafy squares, public gardens, medians and Shamrocks public roads where there is a predominance of woody vegetation and a non-sealed area. These authors do not consider this scope forestation accompanying the bed of public roads. This is justified because these are impermeable (Loboda and Angelis, 2005LOBODA, C.R. and ANGELIS, B.L.D., 2005. Áreas públicas urbanas: conceito, uso e funções. Ambiência, vol. 1, no. 1, pp. 125-139.).
The Percentage of Public Green Areas (PPGA) values and Public Green Area Index (PGAI) were calculated for the thirteen administrative regions using the quantification of the total area and population of ARs provided by the Sustainable Technology Development Service.
2.3 The percentage of Public Green Areas (PPGA)
PPGA was calculated as the ratio between the total area of public green areas and the territory of the administrative regions (Equation 1), considering all categories of public green areas, except those without trees and outside the limits of ARs public areas.
where: PAVP = Percent Public Green Areas; ΣAVP = Sum of total Public Green Areas (m2); TRAs = Territory Administrative Regions (m2).
2.4 Estimation of the Public Green Area Index (PGAI)
To estimate the PGAI, which is a parameter dependent on population density, we considered the green areas for collective use, represented by wooded common areas with free access to the population in leisure activities, excluding private green areas and those not were contained in ARs (Equation 2). Some public green areas, such as university campus (Federal University of São Carlos and University of São Paulo 1 and 2) and the Ecological Park, were not included.
The final value of IAVP was the sum of public green areas divided by population density.
where: PGAI = Public Green Area Index; ΣAVP = Sum of total Public Green Areas (m2); PopD= Population density (m2/inhabitant).
2.5 Urban environmental quality of green areas Index
To construct the index of urban environmental quality of public green areas of the city, adapted from the Genebrino or Distancial method (Sliwiany, 1997Sliwiany, R.M., 1997. Sociometria: como avaliar a qualidade de vida e projetos sociais. Petrópolis: Vozes. 182 p.) using the PGAI and PPGA indicators (Equation 3), establishing threshold values by averaging the best and worst situations found the ARs.
where: I = partial index Genebrino; Y = empirical value; Ymin = minimum threshold and; Ymax = maximum threshold.
The calculated index ranges from zero (empirical value coincides with the minimum threshold) and 100 (empirical value coincides with the maximum threshold), allowing classification into groups of satisfaction: poor (0-20%), fair (20% to 40%) good (40% to 60%), very good (60% and 80%) and excellent (80% to 100%) (IPPUC, 2010INSTITUTO DE PESQUISA E PLANEJAMENTO URBANO DE CURITIBA – IPPUC, 2010. Análise de desempenho 1970 a 2009, controle ambiental e desenvolvimento sustentável. Coordinated by Maria Teresa Bonatto de Castro and Marilia Isfer Ravanello. Curitiba: IPPUC. 69 p. Avaliação do Plano Diretor, 2.).
The AR-6 and AR -10 were excluded from the analysis because they are not characterized as consolidated urban area (Brasil, 2002BRASIL. CONSELHO NACIONAL DO MEIO AMBIENTE – CONAMA, 2002. Resolução CONAMA nº 302, de 20 de março de 2002. Dispõe sobre os parâmetros, definições e limites de Áreas de Preservação Permanente de reservatórios artificiais e o regime de uso do entorno. Diário Oficial da União, Brasília, 13 mar.) and correspond to the districts of Santa Eudoxia and Red Water and groups of small farms.
2.6 Photographic record
A photographic record of 65 public green areas was made, considering plots, plazas, small fragments of vegetation in RAs, selecting areas with the best aspects of vegetation. Subsequently, five pictures were chosen from each RA to represent the profile of green areas. On this occasion it was possible to determine the physical characteristics of green spaces in urban areas of occupation, and to determine the accuracy of the images of public green areas of administrative regions obtained by satellite images.
The visit to ARs enabled the researcher the perception of occupancy characteristics of residential neighborhoods which predominance of shops and services in as ARs 4 and 8.
3 Results
Public green areas in the city of São Carlos comprise 6.55% of the urban perimeter.
The total PGAI obtained for the county was 18.85 m2/inhabitant. This value compared with values suggested by SBAU indicates good environmental quality. However, we realized the heterogeneity of features of the public green areas, as shown in Table 1.
The Genebrino method applied to PPGA (GPGA) ranked ARs 1, 4, 5, 7 and 13 with poor environmental quality and ARs 2, 9 and 12, as “good” and “excellent” (Table 2).
This method applied to PGAI (GPGAI) showed satisfaction rates among different ARs (Figure 1).
The AR-01, despite covering a relatively small area (366.30 ha) compared to other ARs, concentrated 22 districts and a population of 15,530, with a VAP of 3.79%, resulting in PGAI of 8.94 m2/hab, considered bad, according to the classification presented in Figure 2. In similar situation lies AR-05 with 25 districts, a territory of 411.2 ha, the lowest PGA (3.15%) among the regions, with a low PGAI (7.49 m2/hab).

Urban environmental quality , as the Genebrino method PGAI (Public Green Area Index) for the Administrative Regions of São Carlos.
With less land occupation, the AR-04 aggregates 7 neighborhoods, with a density of 9,847 inhabitants, has the lowest PGA (1.88%) and PGAI 6.44%, considered low.
The AR-7 is a region with different characteristics, adding the largest number of districts (33) between ARs, an area of 939.5 ha, concentrated industrial areas. The disparity between the PGAI 19.70 m2/hab, satisfactory, and PGA of 3.74% can be attributed to the low population density (19 inhabitants / ha).
The regions that have the best PGAIs and GPGAIs were AR-08 with 36.30% m2/hab and 100 and AR-03 with m2/hab 31.44 and 71.40%, ranked with excellent environmental quality. Both have low population density of 22.97 inhabitants/ha and 26.18 inhab/ha and PGA of 8.23% and 8.34%, ranked also as good urban quality.
The AR-02 with 27.11 and 71.40% m2/hab and AR-11 with 26.01 and 67.96% m2/hab presented PGAIs and GPGAI considered satisfactory. The AR-02 stood out, with the best PGA 12.79% (excellent), in relation to other features and population density of 47.18 inhabitants / ha. In contrast, the AR-11, with low population density (21.34 inhabitants/ha), land area of 983.7 ha (22 districts), has two woods called Santa Marta and Cambuí that contribute to the increase in the values of the quality indices of green areas.
The AR-09 is the most populous administrative region in the urban area, and comprises 17 districts with relatively high population density of 53.45 inhabitants/ha. Even with a PGA rated as “good” (8.65%), due to the high number of inhabitants (33,644), presented the PGAI m2/hab of 16.18 and 37.37% GPGAI, both classified as “regular”.
In AR-12, PAV of 9.28% and 67.82% of PPGAI demonstrates great situation in relation to other regions. The intermediate size of its land area (425.8 ha) and the average population density of 52.39 inhabitants / ha resulted in PGAI m2/hab 17.72 and 42.17% of the Genebrino, classified as good.
The best GPGAI appearing in AR 2, 3, 8 and 11, with a range 67-100%, with ranked satisfaction rating between “good” and “excellent.” The worst results were the ARs 1, 4, 5 and 13, with values between 0% and 14.87% (Figures 2 and 3).

4 Discussion
The value of PGAI for the municipality considers only public areas bounded by the Municipality of São Carlos, not including campus of the Federal University of São Carlos (UFSCar), the Municipal Ecological Park, the tree-lined sidewalks and private areas (properties and condominiums). Nevertheless this index can not reflect the real situation of vegetation in public green areas in the administrative regions of the city limits, since these can be found unevenly distributed in a particular administrative area. In this sense, the analysis of the spatial distribution of public green areas allow a more refined perception of aspects related to urban and environmental quality of life for all. The results found that the population density, the percentage of green space and territorial extent of each administrative region, compared, with a total PGA of 6.55% in the urban area, a land area of 62,413,000 m2, show a low urban environmental quality, according to the criteria shows in Figure 3. Indicators with differences from PAV, which ranged from 1.88% (AR-04) to 12.79% (AR-02) and also in relation to PGAI were found, and 4.16 m2/hab (AR-13) to 36.30 m2/hab (AR-08).
ARs 3:08 showed the highest values of PGAI (31.44 and 36.30 m2/hab), justified by the proportion between population density and percentage of public green areas.
In contrast, values between 4.16 and 8.94 PGAI m2/hab observed in the AR-01, AR-04, AR-05 and AR-13, are below the minimum suggested by SBAU (15m2/person). These regions have the smallest land area (207.0 ha to 411.2 ha), however, low levels of green areas are not explained by variation in population density (29.25 to 75.99 inhabitants/ha). Furthermore, the contents of PGA 1.88 to 3.79% indicating a low environmental quality in these regions.
The Genebrino index enabled the perception of environmental quality based on the comparison of public green areas in relation to the occupation of urban spaces, and considering that some ARs were classified as satisfactory environmental quality, there is a PGA between 1.88% and 12 79% points to the need for urban planning considering the implementation of new public green areas depending on population density. Rossetti et al. (2010)ROSSETTI, A.I.N., PELLEGRINO, P.R.M. and TAVARES, A.R., 2010. As árvores e suas interfaces no ambiente urbano. Revista da Sociedade Brasileira de Arborização Urbana, vol. 5, no. 1, p. 1-24. also stressed the importance of planning agencies worry about the quantitative and qualitative proportions and the ideal distribution of each species, genus or family used in the restoration of woody vegetation within a territory.
However, the methodologies used have their optimum as they are applied in systematic manner effectiveness, considering the use of other indicators. It is worth mentioning that the extension of the methods to other parameters not examined in this work, such as water supply, sewage networks and collection of solid materials shows it is relevant in getting indexes of environmental quality in urban areas.
Administrative regions with higher density of occupation should also receive special attention, green spaces, regardless of their public or private modality must be encouraged by the municipality given its essential character to life quality. ARs with worse IAVPs can realize the rise / increase in intensity of heat islands and its harmful effects, such as increased temperature, as Amorim (2005)Amorim, M.C.C.T., 2005. Ilhas de calor em Birigui/SP. Revista Brasileira de Climatologia, vol. 1, no. 1, pp. 121-130. suggests, when comes to this problem.
The GIAVP points a recommended target of 40% for the search of good urban environmental quality. For this, it is crucial that public policies directed at creating new green areas and the maintenance of existing, encouraging popular participation in the process.
It is worth mentioning the importance of maintaining private green areas that play essential environmental functions, as well as the public, although the latter are more extensive and democratic use. In this sense, there Decree No. 264 of may 30, 2008 (São Carlos, 2008SÃO CARLOS, 2008. Decreto nº 264, de 30 de maio de 2008. Jornal Primeira Página, São Carlos, 03 jun.), that encourages owners to retain urban or retrieve their permeable areas through rebates property taxes.
Obtaining more accurate results in the diagnosis of urban environmental quality depends on the systematic application of different methodologies that insert new elements of research, such as education, culture and health. According to Oliveira et al. (1999)Oliveira, C.H., SANTOS, J.E. and PIRES, J.S., 1999. Indicadores de arborização urbana da cidade de São Carlos (SP) com o uso do SIG-IDRISI. Brazilian Journal of Ecology, ano 3, no. 1, pp. 1-9., it is difficult to separate the concepts of environmental quality and quality of life. Environmental quality has been conceptualized as a set of conditions that provides an environment in relation to the needs of their constituents and Quality of Life as the level of psychological, social and medical well-being of an individual or a population depending on external pressures. However, the concepts of quality of life and environmental quality are confused and are often treated by basic indicators (housing, sanitation, health, education, etc.). Other times due to perceptual aspects of social well-being and achievement, possibly due to choice opportunities for alternative livelihoods; still other times, based on analogy with economic indicators such as per capita income, gross domestic product and others.
The urban environmental planning should consider the interrelationships between public green areas and population dynamics in the occupation process of urban spaces and, therefore, the municipal master plan shows up as an important tool, linked to popular participation, enables balance between the natural and built environment, which results in environmental quality.
5 Conclusion
The use of techniques allied to the Geographical Information System (GIS) remote sensing helped to diagnose problem areas in relation to urban vegetation deficit.
The Genebrino or Distancial method applied to the PAV indicators and IAVP helpful to compare the regions with the best and worst conditions, in relation to urban public green areas.
The analysis of PGAI between ARs of São Carlos (18.85 m2/habitantes) found large inequalities in the distribution of public green areas that interfere with urban environmental quality.
Based on the data presented, the municipal government, coupled with the prosecutor's office and other environmental organizations, can set in its Strategic Plan, the guidelines for the process of expansion of the urban area, including measures aimed at public green areas, prioritizing population life quality.
-
(With 3 figures)
References
- Alvarez, I.A., 2004. Qualidade do espaço verde urbano: uma proposta de índice de avaliação. Piracicaba: Escola Superior de Agricultura Luiz de Queiroz, Universidade de São Paulo, 187 p. PhD Thesis in Fitotecnia.
- Amorim, M.C.C.T., 2005. Ilhas de calor em Birigui/SP. Revista Brasileira de Climatologia, vol. 1, no. 1, pp. 121-130.
- Barbosa, R.V.R. and VECCHIA, F.A.S., 2009. Estudos de ilha de calor urbana por meio de imagens do Landsat 7 ETM+: estudo de caso em São Carlos (SP). Reviews in Mineralogy, vol. 6, no. 3, pp. 273-278.
- BRASIL. CONSELHO NACIONAL DO MEIO AMBIENTE – CONAMA, 2002. Resolução CONAMA nº 302, de 20 de março de 2002. Dispõe sobre os parâmetros, definições e limites de Áreas de Preservação Permanente de reservatórios artificiais e o regime de uso do entorno. Diário Oficial da União, Brasília, 13 mar.
- Caporusso, D. and Lindon, F.M., 2008. Áreas verdes urbanas: avaliação e proposta conceitual. In: VIII Seminário de Pós-graduação em Geografia da UNESP, 2008, Rio Claro. Rio Claro: UNESP. pp. 71-87.
- INSTITUTO BRASILEIRO DE GEOGRAFIA E ESTATÍSTICA – IBGE, 2010 [viewed 20 December 2013]. Cidades: São Paulo - São Carlos [online]. Rio de Janeiro: IBGE. Available from: http://cidades.ibge.gov.br/xtras/perfil.php?lang=&codmun=354890&search=sao-paulo|sao-carlos
» http://cidades.ibge.gov.br/xtras/perfil.php?lang=&codmun=354890&search=sao-paulo|sao-carlos - INSTITUTO DE PESQUISA E PLANEJAMENTO URBANO DE CURITIBA – IPPUC, 2010. Análise de desempenho 1970 a 2009, controle ambiental e desenvolvimento sustentável. Coordinated by Maria Teresa Bonatto de Castro and Marilia Isfer Ravanello. Curitiba: IPPUC. 69 p. Avaliação do Plano Diretor, 2.
- INSTITUTO GEOGRÁFICO E CARTOGRÁFICO DO ESTADO DE SÃO PAULO – IGC, 1990. Plano Cartográfico do Estado de São Paulo [escala 1:10.000], Folha Córrego Água Santa [SF-23-V-C-IV-2-SO-B] e Folha Ribeirão Vassununga [SF-23-V-C-IV-2-NO-F]. São Paulo: IGC.
- LIMA, A.M.L.P., CAVALHEIRO, C., NUCCI, J.C., SOUSA, M.A.L.B., FIALHO, N.O. and DEL PICCHIA, P.C.D., 1994. Problemas e utilização na conceituação de termos como espaços livres, áreas verdes e correlatos. In: Anais do Congresso Brasileiro sobre Arborização Urbano, 1994, São Luís, MA. São Luís: Sociedade Brasileira de Arborização Urbana, pp. 539-553.
- LOBODA, C.R. and ANGELIS, B.L.D., 2005. Áreas públicas urbanas: conceito, uso e funções. Ambiência, vol. 1, no. 1, pp. 125-139.
- MATIAS, L.F., CARVALHO, J.C.B., MARGUTI, B.O. and FARIAS, F.O., 2008 [viewed 20 December 2013]. Mapeamento do uso da terra na cidade de Paulínia (SP): desenvolvimento de aspectos metodológicos para detalhamento intra-urbano. In: Anais do XV Encontro Nacional de Geógrafos [online], 20-26 July 2008, São Paulo. São Paulo: Unicamp. Available from: http://www.agb.org.br/
» http://www.agb.org.br/ - Oliveira, C.H., SANTOS, J.E. and PIRES, J.S., 1999. Indicadores de arborização urbana da cidade de São Carlos (SP) com o uso do SIG-IDRISI. Brazilian Journal of Ecology, ano 3, no. 1, pp. 1-9.
- Peres, R.B. and Pugliesi, E., 2012. As influências das políticas e do planejamento urbano no desenho de cidades mais sustentáveis: avanços e desafios voltados à realidade brasileira. In: A.R. OMETTO, R.B. PERES, and Y.M.B. SAAVEDRA, orgs. Ecoinovação para a melhoria ambiental de produtos e serviços: experiências espanholas e brasileiras nos setores industrial, urbano e agrícola. São Carlos: Diagrama Editorial, pp. 165-178.
- ROSSETTI, A.I.N., PELLEGRINO, P.R.M. and TAVARES, A.R., 2010. As árvores e suas interfaces no ambiente urbano. Revista da Sociedade Brasileira de Arborização Urbana, vol. 5, no. 1, p. 1-24.
- SÃO CARLOS, 2008. Decreto nº 264, de 30 de maio de 2008. Jornal Primeira Página, São Carlos, 03 jun.
- SÃO CARLOS. Prefeitura Municipal, 2010. Emenda Substitutiva nº 01 à Lei Orgânica do Município, de 20 de dezembro de 2010. Dispõe sobre a organização do município de São Carlos. Câmara Municipal de São Carlos, São Carlos, 20 dec.
- SHAMS, J.C.A., GIACOMELI, D.C., and SUCOMINE, N.M., 2009. Emprego da arborização na melhoria do conforto térmico nos espaços livres públicos. Revista da Sociedade Brasileira de Arborização Urbana, vol. 4, no. 4, pp. 1-16.
- Sliwiany, R.M., 1997. Sociometria: como avaliar a qualidade de vida e projetos sociais. Petrópolis: Vozes. 182 p.
- SOCIEDADE BRASILEIRA DE ARBORIZAÇÃO URBANA – SBAU, 1996. Carta a Londrina e Ibiporã. Boletim Informativo, vol. 3, no. 5, pp. 3.
- Vieira, P.B.H., 2004. Uma visão geográfica das áreas verdes de Florianópolis, SC: estudo de caso do Parque Ecológico do Córrego Grande (PECG). Florianópolis: Universidade Federal de Santa Catarina. Trabalho de Conclusão de Curso.
Publication Dates
-
Publication in this collection
19 Apr 2016 -
Date of issue
Jul-Sep 2016
History
-
Received
26 Jan 2015 -
Accepted
25 May 2015