
Abstract
Soil flooding is an environmental stressor for crops that can affect physiological performance and reduce crop yields. Abiotic stressors cause changes in protein synthesis, modifying the levels of a series of proteins, especially the heat shock proteins (HSP), and these proteins can help protect the plants against abiotic stress. The objective of this study was to verify if tomato plants cv. Micro-Tom from different genotypes with varying expression levels of MT-sHSP23.6 (mitochondrial small heat shock proteins) have different responses physiological to flooding. Plants from three genotypes (untransformed, MT-sHSP23.6 sense expression levels and MT-sHSP23.6 antisense expression levels) were cultivated under controlled conditions. After 50 days, the plants were flooded for 14 days. After this period half of the plants from each genotype were allowed to recover. Chlorophyll fluorescence, gas exchange, chlorophyll index, leaf area and dry matter were evaluated. Flood stress affected the photosynthetic electron transport chain, which is related to inactivation of the oxygen-evolving complex, loss of connectivity among units in photosystem II, oxidation-reduction of the plastoquinone pool and activity of photosystem I. The genotype with MT-sHSP23.6 sense expression levels was less sensitive to stress from flooding.
Keywords:
Solanum lycopersicum Mill; photosynthesis; chlorophyll fluorescence; stress
Resumo
O alagamento do solo é um estressor ambiental para as culturas e pode afetar o desempenho fisiológico e reduzir a produtividade das culturas. Estresses abióticos causam mudanças na síntese de proteínas, modificando os níveis de uma série de proteínas, em especial as proteínas de choque térmico (HSP) e essas proteínas são conhecidas por proteger as plantas contra estresses abióticos. O objetivo deste estudo foi verificar se as plantas do tomateiro cv. Micro-Tom de distintos genótipos com diferentes níveis de expressão da MT-sHSP23.6 (proteínas mitocondriais de choque térmico com pequena massa molecular), têm diferentes respostas fisiológicas ao alagamento. As plantas de três genótipos (não-transformado, transformado com orientação antisense e transformado com orientação sense para MT-sHSP23.6) foram cultivadas sob condições controladas. Após 50 dias as plantas foram alagadas durante 14 dias. Após esse período as plantas de cada genótipo foram recuperadas. Foram avaliados fluorescência da clorofila, trocas gasosas, índice de clorofila, área foliar e massa seca. O estresse por alagamento afetou a cadeia de transporte de elétrons da fotossíntese, que está relacionado à inativação do complexo de evolução do oxigênio, perda da conectividade entre as unidades do fotossistema II, de oxidação e redução do pool de plastoquinona e atividade do fotossistema I. O genótipo com orientação sense MT-sHSP23.6 foi menos sensível ao estresse por alagamento.
Palavras-chave:
Solanum lycopersicum Mill; fotossíntese; fluorescência da clorofila; estresse
1 Introduction
Soil flooding is a major limiting factor for the growth and development of most crop species (Horchani et al., 2008HORCHANI, F., GALLUSCI, P., BALDET, P., CABASSON, C., MAUCOURT, M., ROLIN, D., ASCHI-SMITI, S. and RAYMOND, P., 2008. Prolonged root hypoxia induces ammonium accumulation and decreases the nutritional quality of tomato fruits. Journal of Plant Physiology, vol. 165, no. 13, pp. 1352-1359. http://dx.doi.org/10.1016/j.jplph.2007.10.016. PMid:18180072.
http://dx.doi.org/10.1016/j.jplph.2007.1...
, 2009HORCHANI, F., KHAYATI, H., RAYMOND, P., BROUQUISSE, R. and ASCHI-SMITI, S., 2009. Contrasted effects of prolonged root hypoxia on tomato root and fruit (Solanum lycopersicum) metabolism. Journal Agronomy & Crop Science, vol. 195, no. 4, pp. 313-318. http://dx.doi.org/10.1111/j.1439-037X.2009.00363.x.
http://dx.doi.org/10.1111/j.1439-037X.20...
).Various easily detected physiological responses have been reported as a result of physical and chemical changes in soil (Kozlowski, 1997KOZLOWSKI, T.T., 1997. Responses of woody plants to flooding and salinity. Tree Physiology Monograph, vol. 1, pp. 1-29.). Because flooding is a significant problem in agriculture, studies have been conducted on various crop species (Zou et al., 2013ZOU, X., XIAOYU, T., CHENGWEI, H., LIU, Z., GUANGYUAN, L., GUIPING, F., YONG, C. and XUEKUN, Z., 2013. The transcriptome of . Brassica napus L. roots under waterlogging at the Seedling StageInternational Journal of Molecular Sciences, vol. 14, no. 2, pp. 2637-2651. http://dx.doi.org/10.3390/ijms14022637. PMid:23358252.
http://dx.doi.org/10.3390/ijms14022637...
) and have yielded the following results: 1) there is a significant transcriptional expression of genes involved in virtually every major biological functions; 2) gene transcripts that were significanthy up – or dow-regulated in response; 3) similar expression of transcription factors among species, especially in the α gene (sub 1A, HIF, ERF) and 4) genes encoding sHSPare strongly up-regulated (Mustroph et al., 2010MUSTROPH, A., LEE, S.C., OOSUMI, T., ZANETTI, M.E., YANG, H., MA, K., YAGHOUBI-MASIHI, A., FUKAO, T. and BAILEY-SERRES, J., 2010. Cross-Kingdom Comparison of Transcriptomic Adjustments to Low-Oxygen Stress Highlights Conserved and Plant-Specific Responses. Plant Physiology, vol. 152, no. 3, pp. 1484-1500. http://dx.doi.org/10.1104/pp.109.151845. PMid:20097791.
http://dx.doi.org/10.1104/pp.109.151845...
), however, the effects of flooding vary across species and within a single species (Ezin et al., 2010EZIN, V., PENA, R.D.L. and AHANCHEDE, A., 2010. Flooding tolerance of tomato genotypes during vegetative and reproductive stages. Brazilian Journal of Plant Physiology, vol. 22, pp. 131-142., Perboni et al., 2012PERBONI, A.T., CASSOL, D., SILVA, F.S.P., SILVA, D.M. and BACARIN, M.A., 2012. Chlorophyll a fluorescence study revealing effects of flooding in canola hybrids. Biologia, vol. 67, no. 2, pp. 338-346. http://dx.doi.org/10.2478/s11756-012-0006-0.
http://dx.doi.org/10.2478/s11756-012-000...
).
Abiotic stressors cause changes in protein synthesis, modifying the levels of a series of proteins, especially the heat shock proteins (HSP). One type of HSP, small heat shock proteins (sHSP), are produced in response to a wide variety of environmental stressors and act with other HSP to control stress prevention and recovery (Waters, 2013WATERS, E.R., 2013. The evolution, function, structure, and expression of the plant sHSPs. Journal of Experimental Botany, vol. 64, no. 2, pp. 391-403. http://dx.doi.org/10.1093/jxb/ers355. PMid:23255280.
http://dx.doi.org/10.1093/jxb/ers355...
; Huther et al., 2013HUTHER, C.M., RAMM, A., ROMBALDI, C.V. and BACARIN, M.A., 2013. Physiological response to heat stress of tomato ‘Micro-Tom’ plants expressing high and low levels of mitochondrial sHSP23.6 protein. Plant Growth Regulation, vol. 70, no. 2, pp. 175-185. http://dx.doi.org/10.1007/s10725-013-9790-y.
http://dx.doi.org/10.1007/s10725-013-979...
). HSP act on protein synthesis and repair and protect the endomembrane system, helping to restore cellular homeostasis (Pegoraro et al., 2011PEGORARO, C., MERTZ, L.M., MAIA, L.C., ROMBALDI, C.V. and OLIVEIRA, A.C., 2011. Importance of heat shock proteins in maize. Journal of Crop Science Biotechnology, vol. 14, no. 2, pp. 85-95. http://dx.doi.org/10.1007/s12892-010-0119-3.
http://dx.doi.org/10.1007/s12892-010-011...
).
Prior studies (Rampino et al., 2009RAMPINO, P., MITA, G., PATALEO, S., DE PASCALI, M., DI FONZO, N. and PERROTTA, C., 2009. Acquisition of thermotolerance and HSP gene expression. In durum wheat (. Triticum durum Desf.) cultivarsEnvironmental and Experimental Botany, vol. 66, no. 2, pp. 257-264. http://dx.doi.org/10.1016/j.envexpbot.2009.04.001.
http://dx.doi.org/10.1016/j.envexpbot.20...
; Huther et al., 2013HUTHER, C.M., RAMM, A., ROMBALDI, C.V. and BACARIN, M.A., 2013. Physiological response to heat stress of tomato ‘Micro-Tom’ plants expressing high and low levels of mitochondrial sHSP23.6 protein. Plant Growth Regulation, vol. 70, no. 2, pp. 175-185. http://dx.doi.org/10.1007/s10725-013-9790-y.
http://dx.doi.org/10.1007/s10725-013-979...
) have found that the HSP23.6 gene is typically expressed in response to various pressures, and its expression levels are strongly up-regulated during some developmental stages (Sarkar et al., 2009SARKAR, N.K., YEON, K.K. and GROVER, A., 2009. Rice sHsp genes: genomic organization and expression profiling under stress and development. BMC Genomics - BioMed Central, vol. 10, pp. 393-410. http://dx.doi.org/10.1186/1471-2164-10-393.
http://dx.doi.org/10.1186/1471-2164-10-3...
). Slight increase in HSP23.6 gene transcription was reported in tomato fruits under hypoxia (Pegoraro et al., 2012PEGORARO, C., SANTOS, R.S., KRÜGER, M.M., TIECHER, A., MAIA, L.C., ROMBALDI, C.V. and OLIVEIRA, A.C., 2012. Effects of hypoxia storage on gene transcript accumulation during tomato fruit ripening. Brazilian Journal of Plant Physiology, vol. 24, no. 2, pp. 141-148. http://dx.doi.org/10.1590/S1677-04202012000200007.
http://dx.doi.org/10.1590/S1677-04202012...
). The low transcription and protein amount required may be due to a low number of processes they are involved. Thus, although this protein is located in the mitochondria, it is believed to act within the organelle it self to promote homeostasis of the plastids, as reported by our group in previous studies with MT-sHSP23.6 sense tomato Micro-Tom genotype, lower photosynthetic damage under high temperature in comparison to MT-sHSP23.6 antisense genotype, suggest in a high tolerance degree to heat due to these protein function (Huther et al., 2013HUTHER, C.M., RAMM, A., ROMBALDI, C.V. and BACARIN, M.A., 2013. Physiological response to heat stress of tomato ‘Micro-Tom’ plants expressing high and low levels of mitochondrial sHSP23.6 protein. Plant Growth Regulation, vol. 70, no. 2, pp. 175-185. http://dx.doi.org/10.1007/s10725-013-9790-y.
http://dx.doi.org/10.1007/s10725-013-979...
). It is known that these two organelles interact during redox depletion, the interchange of metabolites, energy and sub-cellular protection (Waters, 2013WATERS, E.R., 2013. The evolution, function, structure, and expression of the plant sHSPs. Journal of Experimental Botany, vol. 64, no. 2, pp. 391-403. http://dx.doi.org/10.1093/jxb/ers355. PMid:23255280.
http://dx.doi.org/10.1093/jxb/ers355...
).
Decreased photosynthesis under flooded conditions may be associated with disturbances of photochemical and/or biochemical processes and PSII (photosystem II) is very sensitive to water stress, perhaps due to damage to the oxygen-evolving complex (Wright et al., 2009WRIGHT, H., DELONG, J., LADA, R. and PRANGE, R., 2009. The relationsship between water status and chlorophyll fluorescence in grapes (. aVitis spp.)Postharvest Biology and Technology, vol. 51, no. 2, pp. 193-199. http://dx.doi.org/10.1016/j.postharvbio.2008.07.004.
http://dx.doi.org/10.1016/j.postharvbio....
) or the PSII reaction centers (Slabbert and Krüger, 2011SLABBERT, R.M. and KRÜGER, G.H.J., 2011. Assessment of changes in photosystem II structure and function as affected by water deficit in L. and L. Amaranthus hypochondriacusAmaranthus hybridusPlant Physiology and Biochemistry, vol. 49, no. 9, pp. 978-984. http://dx.doi.org/10.1016/j.plaphy.2011.05.001. PMid:21696974.
http://dx.doi.org/10.1016/j.plaphy.2011....
).
Chl (chlorophyll) a fluorescence kinetics can be used to calculate fluorescence parameters that characterize the functioning of the photosynthetic apparatus (Yusuf et al., 2010YUSUF, M.A., KUMAR, D., RAJWANSHI, R., STRASSER, R.J., TSIMILLI-MICHAEL, M., GOVINDJEE. and SARIN, N.B., 2010. Overexpression of -tocopherol methyl transferase gene in transgenic . yBrassica juncea plants alleviates abiotic stress: Physiological and chlorophyll a fluorescence measurementsBiochimica et Biophysica Acta, vol. 1797, no. 8, pp. 1428-1438. http://dx.doi.org/10.1016/j.bbabio.2010.02.002. PMid:20144585.
http://dx.doi.org/10.1016/j.bbabio.2010....
). Analyzing fluorescence transient may be useful for assessing the effects of stressors on plant performance.
The objective of this study was to verify if tomato plants cv. Micro-Tom from different genotypes with varying expression levels of MT-sHSP23.6 (mitochondrial small heat shock proteins) have different responses physiological to flooding.
2 Material and Methods
2.1 Plant materials and growth conditions
Tomato seeds (Solanum lycopersicum Mill. cv. Micro-Tom) were used in the experiment. The seeds were either untransformed or had been transformed to various expression levels of MT-sHSP23.6 mitochondrial sense and antisense, as described by Huther et al. (2013)HUTHER, C.M., RAMM, A., ROMBALDI, C.V. and BACARIN, M.A., 2013. Physiological response to heat stress of tomato ‘Micro-Tom’ plants expressing high and low levels of mitochondrial sHSP23.6 protein. Plant Growth Regulation, vol. 70, no. 2, pp. 175-185. http://dx.doi.org/10.1007/s10725-013-9790-y.
http://dx.doi.org/10.1007/s10725-013-979...
.
Seeds from all three genotypes were sown in Gerbox containers and after 15 days transplanted to 500 mL plastic pots containing sand substrate. The seedlings were placed in growth chambers under controlled conditions (photosynthetic photon flux density of approximately 200 µmol m-2 s-1 above the center of the pots, 10 hour photoperiod and temperature of 21±3ºC). The plants were watered daily, and a nutrient solution described by Hoagland and Arnon (1950)HOAGLAND, D. and ARNON, D.I., 1950. The water culture method for growing plants without soil. Davis: California Agricultural Experiment Station. 347 p. was applied three times per week. Fifty days after sowing (DAS), 10 plants from each genotype were subjected to flooding (water level 2-3 cm above the substrate) for 14 days. To evaluate recovery from stress, at the 10 days of start the experiment, half of the flooded plants from each genotype were returned to normal water levels. Plants in the control treatment group remained under normal water levels.
2.2 Photosynthetic characteristics - fluorescence transient and gas exchange
Measurements for determining the fluorescence transient (curve OJIP) and gas exchange were taken on the first, third, seventh, tenth and fourteenth day of the experiment. During plant recovery, measurements were taken three and seven days after the excess water was drained.
The fluorescence transient was measured, using a portable fluorometer (Model Handy PEA, Hansatech Instruments, King’s Lynn, Norfolk, UK), in the first completely expanded young leaves, which were first adapted to dark environment for 30 minutes. After the adaptation period, a flash of 3,000 μmol photons m-2 s-1 was applied to induce the fluorescence transient. The fluorescence intensity was measured from 50 µs (initial fluorescence F0) to 1 s, and the parameters for the JIP-test were calculated as proposed by Strasser and Strasser (1995)STRASSER, B.J. and STRASSER, R.J., 1995. Measuring fast fluorescence transients to address environmental questions: The JIP-test. Photosynthesis: from Light to Biosphere, vol. 5, pp. 977-980..
The same leaves used to measure fluorescence transient were used to measure gas exchange with a portable infrared CO2 analyzer (model LI-6400XT LI-COR, Inc., Lincoln, NE, USA) using a photosynthetic photon flux density of 1,500 µmol photons m-2 s-1 and a CO2 concentration of 380 mol mol-1 inside the chamber. The following variables were measured from 10:00 to 11:00 h net CO2 assimilation rate (A) [µmol CO2 m-2 s-1] and intracellular CO2 concentration (Ci) [Pa]. The values of A and Ci were used to calculate the apparent carboxylation efficiency (A/Ci) [µmol CO2 m-2 s-1 Pa-1]. The leaf area (LA) and dry matter of the stem, petiole, leaves and roots were measured at the end of the experimental period.
2.3 Statistical analyses
A completely randomized experimental design was used, with five replicates per treatment. The mean values for gas exchange and the growth parameters were compared using Tukey’s tests (p<0.05). Chl a fluorescence was measured in three leaves per plant for a total of 15 measurements per treatment.
3 Results
3.1 Analysis of OJIP fluorescence transients by the JIP-test: evaluation of photosynthetic performance
The investigation of Chl (chlorophylls) a fluorescence induction (Kautsky curve) and JIP-test parameters revealed that: a) the relative variable fluorescencein step J (VJ) increased in waterlogged plants from WT and MT-sHSP23.6 antisense genotypes; b) the normalized total complementary area above the OJIP transient curve (Sm- total complementary area normalised above the transient OJIP); c) the number of cycles of reduction, oxidation and re-reduction of QA from the time when the light was turned on until reaching FM (N - turnover number as reduction, oxidation, re-reduction of QA in time span from light until reaching Fm) decreased in flooded plants from the genotypes WT and MT-sHSP23.6 antisense (Figure 1). There was no effect of flooding on plants from the genotype with MT-sHSP23.6 sense. During plant recovery (Figure 2), the OJIP fluorescence transient did not return to control levels in plants from the genotypes WT and MT-sHSP23.6 antisense, even after the full recovery period.

Radar plot of several parameters calculated by the JIP-test of the tomato plants ‘Micro-Tom’ with different expressions of HSP after flooding stress. (a) Wild type, (b) MT-sHSP23.6 sense, (c) MT-sHSP23.6 antisense. (−−−) control, (−■−) 1, (−●−) 3, (−▲−) 7, (−♦−), 10 and (−◌−) 14 days of the flooding. The heavy black line represents the normalized values of the parameters of the control.
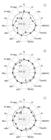
Radar plot of several parameters calculated by the JIP-test of the tomato plants ‘Micro-Tom’ with different expressions of HSP after three (−□−) and seven (−∆−) days of the recovery after flooding stress. (a) Wild type, (b) MT-sHSP23.6 sense, (c) MT-sHSP23.6 antisense. The heavy black line represents the normalized values of the parameters of the control (−−−).
The absorption flux (of antenna Chl) per RC (Reaction centre) (QA− reducing PSII reaction center) (ABS/RC), trapping flux per RC (leading to QA reduction) (TR0/RC) and electron transport flux (further than QA−) per RC (ET0/RC) were not significantly affected by flooding for any of the genotypes (Figure 1). However, electron flux reducing end electron acceptors at the PSI (photosystem I) acceptor side, per RC (RE0/RC) in WT and MT-sHSP23.6 antisense plants began to decrease on the first day after the initiation of flooding, and this decrease continued as flooding continued. For plants with MT-sHSP23.6 sense, this pattern was more evident after the third day of flood stress. Seven days after the end of flooding, RE0/RC had only recovered in plants with MT-sHSP23.6 sense (Figure 2).
The maximum quantum yield for primary photochemistry (TR0/ABS = Fv/Fm = φPo) and ΨEo (probability, at time 0, that a trapped exciton moves an electron into the electron transport chain beyond QA−) was slightly influenced. However, the quantum yield of electron transport from QA− to the intersystem of electron acceptors (φEo - quantum yield for electron transport -ET) decreased as a function of duration of flooding, especially after the seventh day of flooding. This pattern was only observed in MT-sHSP23.6 antisense plants. Of the yield parameters, φRo (efficiency/probability with which an electron from the intersystem electron carriers moves to reduce end electron acceptors at the PSI acceptor side) was most sensitive to flooding in all genotypes (Figure 1). In WT and MT-sHSP23.6 antisense plants, the effects of flood stress on φRo were observed immediately after flooding began, and φRo did not return to control levels after recovery in these plants (Figure 2).
Both performance index (PIABS - performance index for energy conservation from exciton to the reduction of intersystem electron acceptors e PItotal - performance index for energy conservation from exciton to the reduction of PSI end acceptors) decreased during the waterlogging treatment, whereas MT-sHSP23.6 sense genotype responded more effectively. In addition, MT-sHSP23.6 sense recovery its performance index similar to control upon return to normoxic conditions (Figure 2).
3.2 Analysis of the OJIP fluorescence transient: normalizations and subtractions
Normalizations and subtractions among steps of the OJIP fluorescence transient were used to thoroughly assess the effects of flooding on the OJ, OI and IP phases of the fluorescence transient. This approach allowed differences in kinetics to be identified and revealed hidden bands among the O, J, I and P steps. We present only measurements taken on the 14th day of flooding and the 7thday of recovery relative to the control.
The fluorescence transient data were normalized as follows:
-
a
between steps O (50 μs) and K (300 μs) as relative variable fluorescence [WOK = (Ft - F0)/(FK - F0)] and as kinetic difference [ΔWOK = (WOK (treatment) - WOK (control))] (Figure 3a-c). It was obtained and identified positive L-band (at approximately 150 µs) in flooded plants from all genotypes. The positive L-band was not present in MT-sHSP23.6 sense plants after seven days of recovery from flooding.
 Figure 3
The difference in the kinetics of double normalization at F0 and FK [△WOK = WOK[treatment] - WOK[control]] (a-c) and the difference in the kinetics of double normalization at F0 and FJ [△WOJ = WOJ[treatment] - WOJ [control]] (d-f) to the tomato plants ‘Micro-Tom’ with different expressions of HSP after flooding stress by 14 days (flooding) and flooding by seven days and seven days of the recovery (recovery). (a) and (d) - Wild type; (b) and (e) - MT-sHSP23.6 sense; (c) and (f) - MT-sHSP23.6 antisense.
-
b
between steps O (50 μs) and J (2 ms) as relative variable fluorescence [WOJ = (Ft - F0)/(FJ - F0)] and as kinetic difference [ΔWOJ = (WOJ (treatment) - WOJ (control))] (Figure 3 d-f). This procedure revealed the K-band (at approximately 300 µs). Flooding caused the positive K-band to appear in MT-sHSP23.6 antisense plants, and the K-band remained even after recovery.
-
c
between steps O (50 µs) and I (30 ms) as relative variable fluorescence [WOI = (Ft - F0)/(FI - F0)] (WOI ≥ 1) (Figure 4 a-c). This procedure enabled the evaluation of I-P phase events. Maximum amplitude of WOI ≥ 1 reflects the size of the electron acceptor pool on the PSI electron acceptor side. In this study, amplitude decreased with flooding for all genotypes, and this effect was smaller in MT-sHSP23.6 sense plants. This effect was only reversed in MT-sHSP23.6 sense plants during recovery from flooding (Figure 4b).
 Figure 4
Double normalization at the F0 to FI [WOI = (Ft - F0)/(FI - F0)] (a-c) and double normalization at the FI to FP [WIP = (Ft - FI)/ (Fm - FI)] (d-f) to the tomato plants ‘Micro-Tom’ with different expression levels of HSP after flooding stress by 14 days (flooding for 14 days) and flooding by seven days and seven days of the recovery (recovery). (a) and (d) - Wild type; (b) and (e) - MT-sHSP23.6 sense; (c) and (f) – MT-sHSP23.6 antisense. Events for WOI≥ 1.0 illustrate the differences in the pool size of the end electron acceptors.
-
d
between steps I and P as [WIP = (Ft - FI)/(Fm- FI)] (Figure 4 d-f). The inverse of the time to reach WIP = 0.5 is an estimate of the global rate of reduction of electron acceptors of PSI. In this study, there were no clear differences in the global rate of reduction of final electron acceptors in flooded plants relative to control plants.
3.3 Gas exchange
Net CO2 assimilation rate (A) (Figure 5 a-c) decreased under waterlogging conditions in all genotypes, though the reduction was high in the begning of the treatment. On the other hand, WT and MT-sHSP23.6 sense genotypes, after seven days of waterlogging, increased the net photosynthetic rate close to the control, whereas MT-sHSP23.6 antisense genotype showed decrease time-dependent under waterlogging. When plants returned to normoxic conditions an increase in A parameter was shown by al genotypes. However, in WT plants, A remained below control levels even after seven days of recovery. Regarding carboxylation efficiency (Figure 5 d-f), a smiliar behave to liquid photosynthetic net was observed, and the reduction in A/Ci ratio is probably due to damage in the biochesmistry reactions of photosynthesis.

Net CO2 assimilation rate (µmol CO2 m-2 s-1) (a-c) and apparent carboxylation efficiency (µmol CO2 m-2 s-1 Pa-1) (d-f) to the tomato plants ‘Micro-Tom’ with different expression levels of HSP after flooding stress by 14 days (flooding for 14 days) and flooding by seven days and seven days of the recovery (recovery). (a) and (d) - Wild type; (b) and (e) - MT-sHSP23.6 sense; (c) and (f) - MT-sHSP23.6 antisense.
3.4 Growth parameters
Plants from the genotypes WT and MT-sHSP23.6 antisense showed significant differences in terms of leaf area, mainly in waterlogged genotypes MT-sHSP23.6 antisense (Table 1). Leaf area was not affected by flooding in MT-sHSP23.6 sense plants. Total dry matter was only affected by flooding in MT-sHSP23.6 antisense plants. However, for this genotype, the shoot/root dry matter ratio did not differ from the its control. Although the shoot dry matter decreased, so did the root dry matter. Therefore, there were no significant differences between treatments. Flooded WT and MT-sHSP23.6 sense plants exhibited a greater increase in shoots than in roots, resulting in greater shoot/root dry matter ratios. The control of WT and MT-sHSP23.6 (sense ou antisense) genotypes exhibited a more pronounced drop in this ratio following the recovery period, with a relatively high increase in root dry matter and a relatively small increase in shoot dry matter.
Growth parameters in tomato plants cv. Micro Tom measured at the end of the experimental period (14 days of flooding more seven days of recovery).
4 Discussion
Photosynthetic responses genotypes to flooding were detected through changes in chlorophyll fluorescence parameters, suggesting that flooding caused changes in absorption and in the utilization of light energy by the electron transport chain for photosynthesis. The changes in JIP-test parameters were more pronounced in the WT and MT-sHSP23.6 antisense genotypes. Relative to the WT plants, the effects of flooding were more evident in the parameters related to oxidation and reduction of the electron acceptors of PSII (Sm and N). Flood stress resulted in fewer total electron transporters per reaction center, leading to a deficit in the reduction of QA.
For the parameters describing specific energy fluxes per reaction center, the electron flux reducing end electron acceptors at the PSI acceptor side, per RC (RE0/RC) all genotypes were affected, with slight decrease or increase in MT-sHSP23.6 sense genotype, may be due to a higher stability of the membranes and its protection capacity to the cellular damage induced by the stress. Changes in this parameter resulted in a decrease in the parameters φRo and δRo (probability with which an electron from the intersystem electron carriers moves to reduce end electron acceptors at the PSI acceptor side) relative to the control plants, demonstrating that there was a significant effect of flooding on the activity of PSI.
The performance indices (PIABS and PItotal) used in this study have been suggested to be the most efficient parameters for quantifying stress us genotypes because they are products of terms that express partial potentials for the conservation of energy at sequential bifurcations of photons absorbed by PSII for the reduction of intersystem electron acceptors (PIABS) and for the reduction of the final receptors of PSI (PItotal) (Strasser et al., 2010STRASSER, R.J., TSIMILLI-MICHAEL, M., QIANG, S. and GOLTSEV, V., 2010. Simultaneous in vivo recording of prompt and delayed fluorescence and 820 nm reflection changes during drying and after rehydration of the resurrection plant Haberlea rhodopensis.Biochimica et Biophysica Acta Bioenergetics, vol. 1797, no. 6-7, pp. 122-122. http://dx.doi.org/10.1016/j.bbabio.2010.04.365. PMid:20226756.
http://dx.doi.org/10.1016/j.bbabio.2010....
; Yusuf et al., 2010YUSUF, M.A., KUMAR, D., RAJWANSHI, R., STRASSER, R.J., TSIMILLI-MICHAEL, M., GOVINDJEE. and SARIN, N.B., 2010. Overexpression of -tocopherol methyl transferase gene in transgenic . yBrassica juncea plants alleviates abiotic stress: Physiological and chlorophyll a fluorescence measurementsBiochimica et Biophysica Acta, vol. 1797, no. 8, pp. 1428-1438. http://dx.doi.org/10.1016/j.bbabio.2010.02.002. PMid:20144585.
http://dx.doi.org/10.1016/j.bbabio.2010....
).
The parameter PIABS decreased with duration of flooding. According to Strasser et al. (2010)STRASSER, R.J., TSIMILLI-MICHAEL, M., QIANG, S. and GOLTSEV, V., 2010. Simultaneous in vivo recording of prompt and delayed fluorescence and 820 nm reflection changes during drying and after rehydration of the resurrection plant Haberlea rhodopensis.Biochimica et Biophysica Acta Bioenergetics, vol. 1797, no. 6-7, pp. 122-122. http://dx.doi.org/10.1016/j.bbabio.2010.04.365. PMid:20226756.
http://dx.doi.org/10.1016/j.bbabio.2010....
, a large drop in PIABS can be explained by changes in one, two, or three parameters and shows a rapid decrease in the efficiency of the redox reaction in the electron transport chain. Slabbert and Krüger (2011)SLABBERT, R.M. and KRÜGER, G.H.J., 2011. Assessment of changes in photosystem II structure and function as affected by water deficit in L. and L. Amaranthus hypochondriacusAmaranthus hybridusPlant Physiology and Biochemistry, vol. 49, no. 9, pp. 978-984. http://dx.doi.org/10.1016/j.plaphy.2011.05.001. PMid:21696974.
http://dx.doi.org/10.1016/j.plaphy.2011....
describe PIABS as a marker of plant vitality. In this study, the effect of flooding was most evident in the parameter PItotal, which showed the greatest decrease with flooding and reflected little energy conservation over time. Yusuf et al. (2010)YUSUF, M.A., KUMAR, D., RAJWANSHI, R., STRASSER, R.J., TSIMILLI-MICHAEL, M., GOVINDJEE. and SARIN, N.B., 2010. Overexpression of -tocopherol methyl transferase gene in transgenic . yBrassica juncea plants alleviates abiotic stress: Physiological and chlorophyll a fluorescence measurementsBiochimica et Biophysica Acta, vol. 1797, no. 8, pp. 1428-1438. http://dx.doi.org/10.1016/j.bbabio.2010.02.002. PMid:20144585.
http://dx.doi.org/10.1016/j.bbabio.2010....
showed that decreases in this parameter inicates a negative “strain” on the system photosynthetic, and PItotal parameter is assumed to be the most sensitive of the JIP test, once allows to evaluate several paramaters from transient fluorescence OJIP.
It should be noted that the MT-sHSP23.6 sense genotype best maintained the flow of energy to PSI throughout the period of flood stress, suggesting that the MT-sHSP23.6 sense and the function of this gene in stress response mechanisms may have led to greater flood tolerance (Siddique et al., 2008SIDDIQUE, M., GERNHARD, S., VON KOSKULL-DÖRING, P., VIERLING, E. and SCHARF, K.D., 2008. The plant sHSP superfamily: five new members in Arabidopsis thaliana with unexpected properties. Cell Stress & Chaperones, vol. 13, no. 2, pp. 183-197. http://dx.doi.org/10.1007/s12192-008-0032-6. PMid:18369739.
http://dx.doi.org/10.1007/s12192-008-003...
). Dramatic deceases in PItotal lead to reduced PSII activity and counteract damage to the structure and function of PSI. The IP phase of the OJIP curve is related to electron transfer through PSI and the reduction of electron congestion caused by a transient block on the acceptor side of PSI due to inactivation of the ferredoxin NADP + reductase (Strasser et al., 2010STRASSER, R.J., TSIMILLI-MICHAEL, M., QIANG, S. and GOLTSEV, V., 2010. Simultaneous in vivo recording of prompt and delayed fluorescence and 820 nm reflection changes during drying and after rehydration of the resurrection plant Haberlea rhodopensis.Biochimica et Biophysica Acta Bioenergetics, vol. 1797, no. 6-7, pp. 122-122. http://dx.doi.org/10.1016/j.bbabio.2010.04.365. PMid:20226756.
http://dx.doi.org/10.1016/j.bbabio.2010....
).
Regarding the recovery period (Figure 2) all parameters from JIP test returned to values similar to those observed in the control in MT-sHSP23.6 sense genotype. However, the parameters associated with the activity and functionality of the PSI were still having a residual flooding effect, particularly on the third day of recovery. It demonstrate that the recovery after a flooding stress allows the photosynthetic machinery return back to its full functionality, regarding its structure and functionality as determined by the parameters of efficiency, yield and performance. However, it was not observed in WT and MT-sHSP23.6 antisense genotypes, indicating that the structural and functional damage was not repaired during the recovery period evaluated, thus, linking these data with the functional capacity of HSP23.6 protein. Further more, the reestablishment of the homeostasis after a stress, once the transition from hypoxia to return to the oxygenation, promotes the formation of reactive oxygen species (Mustroph et al., 2010MUSTROPH, A., LEE, S.C., OOSUMI, T., ZANETTI, M.E., YANG, H., MA, K., YAGHOUBI-MASIHI, A., FUKAO, T. and BAILEY-SERRES, J., 2010. Cross-Kingdom Comparison of Transcriptomic Adjustments to Low-Oxygen Stress Highlights Conserved and Plant-Specific Responses. Plant Physiology, vol. 152, no. 3, pp. 1484-1500. http://dx.doi.org/10.1104/pp.109.151845. PMid:20097791.
http://dx.doi.org/10.1104/pp.109.151845...
), and these proteins play an important role in activanting the antioxidant system (Sule et al., 2004SÜLE, A., VANROBAEYS, F., HAJÓS, G., VAN BEEUMEN, J. and DEVREESE, B., 2004. Proteomic analysis of small heat shock protein isoforms in barley shoots. Phytochemistry, vol. 65, no. 12, pp. 1853-1863. http://dx.doi.org/10.1016/j.phytochem.2004.03.030. PMid:15276443.
http://dx.doi.org/10.1016/j.phytochem.20...
).
Normalizations and subtractions were applied to analyze the OJIP fluorescence transient, and these procedures permitted the detection of bands between the O and P steps. Using these normalizations, it was obtained and identified the positive L-band in all genotypes studied. The L-band (Stirbet et al., 1998STIRBET, A., GOVINDJEE., STRASSER, B.J. and STRASSER, R.J., 1998. Chlorophyll Fluorescence Induction in Higher Plants: Modelling and Numerical Simulation. aJournal of Theoretical Biology, vol. 193, no. 1, pp. 131-15. http://dx.doi.org/10.1006/jtbi.1998.0692.
http://dx.doi.org/10.1006/jtbi.1998.0692...
) obtained by subtraction between K and O from variable fluorescence relative, is a good indicator of the connectivity of the PSII complex, as well as its connectivity is closely related to its size, big L-bands have weak connectivity (Yusuf et al., 2010YUSUF, M.A., KUMAR, D., RAJWANSHI, R., STRASSER, R.J., TSIMILLI-MICHAEL, M., GOVINDJEE. and SARIN, N.B., 2010. Overexpression of -tocopherol methyl transferase gene in transgenic . yBrassica juncea plants alleviates abiotic stress: Physiological and chlorophyll a fluorescence measurementsBiochimica et Biophysica Acta, vol. 1797, no. 8, pp. 1428-1438. http://dx.doi.org/10.1016/j.bbabio.2010.02.002. PMid:20144585.
http://dx.doi.org/10.1016/j.bbabio.2010....
). Thus, was obseverd that 14 days of waterlogging imposed a loss of connectivity between the units of the PSII in all genotypes, whereas MT-sHSP23.6 sense genotype was effective in maintaining the connectivity between units of PSII upon recovery (negative L-band) once, high connectivity results in better utilization of excitation energy and better stability of the (Strasser et al., 2004STRASSER, R.J., TSIMILLI-MICHAEL, M. and SRIVASTAVA, A., 2004. Analysis of the Chlorophyll fluorescence transient. In: aG.C. PAPAGEORGIOU and GOVINDJEE, eds. Chlorophyll Fluorescence: A Signature of Photosynthesis. Dordrecht: Springer - Verlag, pp. 321-362.).
The analysis of fluorescence normalized between O (50μs) and J (2 ms) enabled the identification of the K-band at approximately 300 μs. According to Yusuf et al. (2010)YUSUF, M.A., KUMAR, D., RAJWANSHI, R., STRASSER, R.J., TSIMILLI-MICHAEL, M., GOVINDJEE. and SARIN, N.B., 2010. Overexpression of -tocopherol methyl transferase gene in transgenic . yBrassica juncea plants alleviates abiotic stress: Physiological and chlorophyll a fluorescence measurementsBiochimica et Biophysica Acta, vol. 1797, no. 8, pp. 1428-1438. http://dx.doi.org/10.1016/j.bbabio.2010.02.002. PMid:20144585.
http://dx.doi.org/10.1016/j.bbabio.2010....
, the presence of the positive K-band reflects inactivation of the oxygen-evolving complex (especially the Mn complex) and/or an increase in the size of the functional PSII antenna. The K-band is normally observed in plants under heat stress. However, in this study, it was also identified in plants under flooding stress, especially MT-sHSP23.6 antisense plants, that the transition from recorevy to nomal conditions did not impose damages. However, in MT-sHSP23.6 sense plants were not identified a K-band either upon waterlogging and recovery in comparison to control plants, indicating an efective stability of the liberty oxygen complex in response to the flooding.
The analysis of the O-I phase helped clarify the sequence of events involved in exciton capture by PSII up to the reduction of plastoquinone (PQ) (Yusuf et al., 2010YUSUF, M.A., KUMAR, D., RAJWANSHI, R., STRASSER, R.J., TSIMILLI-MICHAEL, M., GOVINDJEE. and SARIN, N.B., 2010. Overexpression of -tocopherol methyl transferase gene in transgenic . yBrassica juncea plants alleviates abiotic stress: Physiological and chlorophyll a fluorescence measurementsBiochimica et Biophysica Acta, vol. 1797, no. 8, pp. 1428-1438. http://dx.doi.org/10.1016/j.bbabio.2010.02.002. PMid:20144585.
http://dx.doi.org/10.1016/j.bbabio.2010....
). The MT-sHSP23.6 antisense and WT genotypes showed the greatest changes in this phase during flood stress, suggesting that higher expressions of HSP may be correlated with increased flood tolerance, given that there was no limitation on PQ reduction and electrons were largely transferred to the cytochrome complex b6f.
The kinetic difference between points I and P (30 ms to nearly 300 ms) reflects changes in the flow of electrons from plastoquinone (PQ) to the final electron acceptor of PSI (Yusuf et al., 2010YUSUF, M.A., KUMAR, D., RAJWANSHI, R., STRASSER, R.J., TSIMILLI-MICHAEL, M., GOVINDJEE. and SARIN, N.B., 2010. Overexpression of -tocopherol methyl transferase gene in transgenic . yBrassica juncea plants alleviates abiotic stress: Physiological and chlorophyll a fluorescence measurementsBiochimica et Biophysica Acta, vol. 1797, no. 8, pp. 1428-1438. http://dx.doi.org/10.1016/j.bbabio.2010.02.002. PMid:20144585.
http://dx.doi.org/10.1016/j.bbabio.2010....
). According to the results of our study, induced flood stress reduced the size of the PSI electron acceptor pool for all genotypes, suggesting that there was a reduction in the photochemical yield, but the effect was smallest in the genotype with a high expression of MT-sHSP23.6.
In our study, decreases in the rate of photosynthesis were mostly related to carboxylation efficiency, indicating that non-stomatal factors had the greatest effect on photosynthesis. Some published reports have suggested that the emergence of adventitious roots, which act as a new drain for photoassimilates, explains the maintenance of stomatal openings and transpiration rates under stress (Sauter, 2013SAUTER, M., 2013. Root responses to flooding. Current Opinion in Plant Biology, vol. 16, no. 3, pp. 282-286. http://dx.doi.org/10.1016/j.pbi.2013.03.013. PMid:23608517.
http://dx.doi.org/10.1016/j.pbi.2013.03....
) in these genotypes. However, at the end of the experiment the liquid assimilation rate of all genotypes recovered, indicating that a flooding stress can cause a metabolic disorder and these plants are able to recovery of CO2 fixation, and there are reports that these proteins are important during the recovery after a flooding stress, by playing a synergistic action against cell damage (Sule et al., 2004SÜLE, A., VANROBAEYS, F., HAJÓS, G., VAN BEEUMEN, J. and DEVREESE, B., 2004. Proteomic analysis of small heat shock protein isoforms in barley shoots. Phytochemistry, vol. 65, no. 12, pp. 1853-1863. http://dx.doi.org/10.1016/j.phytochem.2004.03.030. PMid:15276443.
http://dx.doi.org/10.1016/j.phytochem.20...
).
In our experiment, WT plants had a smaller leaf area with flood stress, but total dry matter was not affected. A plant recovery period did not reverse this effect, and leaf area remained low. A similar pattern was observed in plants with MT-sHSP23.6 antisense. In contrast, plants with MT-sHSP23.6 sense did not show a decrease in leaf area with flood stress, but they did exhibit a higher ratio of shoot to root dry matter.
The most significant difference among genotypes in this study was the difference inthe shoot:root dry matter ratio between the genotypes MT-sHSP23.6 sense and MT-sHSP23.6 antisense. Plants from the MT-sHSP23.6 sense genotype had a ratio of 10:1 under flood stress, while MT-sHSP23.6 antisense plants had a ratio of 5.6:1. In addition, was observed necrosis and degradation in root tissues in MT-sHSP23.6 antisense genotype (Data not shown).
Thus, the limited plant growth cannot be explained by a single physiological process, even if photosynthesis is the dominant physiological process involved. Such alterations lead to stunted growth and gradual deterioration of the main roots, as observed in the roots of genotype MT-sHSP23.6 antisense in this study. Adventitious roots appeared on MT-sHSP23.6 sense plants after the 10th day of flooding,which may explain the greater tolerance of this genotype to stress from flooding. Plants from the other genotypes did not develop these roots.
The importance of sHSP23.6 gene in response to hypoxia stress was reported by Waters et al. (2008)WATERS, E.R., AEVERMANN, B.D. and SANDERS-REED, Z., 2008. Comparativ e analysis of the small heat shock proteins in three angiosperm genomes identifies new subfamilies and reveals diverse evolutionary patterns. Cell Stress & Chaperones, vol. 13, no. 2, pp. 127-142. http://dx.doi.org/10.1007/s12192-008-0023-7. PMid:18759000.
http://dx.doi.org/10.1007/s12192-008-002...
and Pegoraro et al. (2012)PEGORARO, C., SANTOS, R.S., KRÜGER, M.M., TIECHER, A., MAIA, L.C., ROMBALDI, C.V. and OLIVEIRA, A.C., 2012. Effects of hypoxia storage on gene transcript accumulation during tomato fruit ripening. Brazilian Journal of Plant Physiology, vol. 24, no. 2, pp. 141-148. http://dx.doi.org/10.1590/S1677-04202012000200007.
http://dx.doi.org/10.1590/S1677-04202012...
, as being co-regulated under low oxygen levels, by encoding a protein within the mitochondria. As this organelle in plants is responsible for important metabolic processes such as photorespiration, oxidative phosphorylation, and process of the tricarboxylic acid cycle (Taylor et al., 2009TAYLOR, N.L., TAN, Y.F., JACOBY, R.P. and MILLAR, A.H., 2009. Abiotic environmental stress induced changes in the . Arabidopsis thaliana chloroplast, mitochondria and peroxisome proteomesJournal of Proteomics, vol. 72, no. 3, pp. 367-378. http://dx.doi.org/10.1016/j.jprot.2008.11.006. PMid:19061979.
http://dx.doi.org/10.1016/j.jprot.2008.1...
) is believed that changes in the expression of specific genes during hypoxic stress (Pandey and Kim, 2012PANDEY, D.M. and KIM, S.-R., 2012. Identification and Expression Analysis of Hypoxia Stress Inducible CCCH-type Zinc Finger Protein Genes in Rice. Journal of Plant Biology, vol. 55, no. 6, pp. 489-497. http://dx.doi.org/10.1007/s12374-012-0384-4.
http://dx.doi.org/10.1007/s12374-012-038...
) plus a high expression of the sHSP23.6 gene have played an importante role in the energy redox state of the cells, compensating the hipoxic effects, mainly in MT-sHSP23.6 sense genotype.
Thus, among the genotypes analyzed, the MT-sHSP23.6 sense was more tolerant to the flooding and recovery treatment imposed and the results suggest that mitochondrial HSP play an important role in determining plant response to stress (hypoxia and recorevy) and that the responses of plants can vary widely by genotype.
Abbreviations: MT-sHSP23.6 antisense - Plants transformed in the anti-sense orientation; MT-sHSP23.6 sense - Plants transformed in the sense orientation; WT - Non-transformed plants.
Acknowledgements
We are grateful to the Conselho Nacional de Desenvolvimento Científico e Tecnológico (CNPq) and Coordenação de Aperfeiçoamento de Pessoal de Nível Superior (CAPES) for financial support.
-
(With 5 figures)
References
- EZIN, V., PENA, R.D.L. and AHANCHEDE, A., 2010. Flooding tolerance of tomato genotypes during vegetative and reproductive stages. Brazilian Journal of Plant Physiology, vol. 22, pp. 131-142.
- HOAGLAND, D. and ARNON, D.I., 1950. The water culture method for growing plants without soil. Davis: California Agricultural Experiment Station. 347 p.
- HORCHANI, F., GALLUSCI, P., BALDET, P., CABASSON, C., MAUCOURT, M., ROLIN, D., ASCHI-SMITI, S. and RAYMOND, P., 2008. Prolonged root hypoxia induces ammonium accumulation and decreases the nutritional quality of tomato fruits. Journal of Plant Physiology, vol. 165, no. 13, pp. 1352-1359. http://dx.doi.org/10.1016/j.jplph.2007.10.016 PMid:18180072.
» http://dx.doi.org/10.1016/j.jplph.2007.10.016 - HORCHANI, F., KHAYATI, H., RAYMOND, P., BROUQUISSE, R. and ASCHI-SMITI, S., 2009. Contrasted effects of prolonged root hypoxia on tomato root and fruit (Solanum lycopersicum) metabolism. Journal Agronomy & Crop Science, vol. 195, no. 4, pp. 313-318. http://dx.doi.org/10.1111/j.1439-037X.2009.00363.x
» http://dx.doi.org/10.1111/j.1439-037X.2009.00363.x - HUTHER, C.M., RAMM, A., ROMBALDI, C.V. and BACARIN, M.A., 2013. Physiological response to heat stress of tomato ‘Micro-Tom’ plants expressing high and low levels of mitochondrial sHSP23.6 protein. Plant Growth Regulation, vol. 70, no. 2, pp. 175-185. http://dx.doi.org/10.1007/s10725-013-9790-y
» http://dx.doi.org/10.1007/s10725-013-9790-y - KOZLOWSKI, T.T., 1997. Responses of woody plants to flooding and salinity. Tree Physiology Monograph, vol. 1, pp. 1-29.
- MUSTROPH, A., LEE, S.C., OOSUMI, T., ZANETTI, M.E., YANG, H., MA, K., YAGHOUBI-MASIHI, A., FUKAO, T. and BAILEY-SERRES, J., 2010. Cross-Kingdom Comparison of Transcriptomic Adjustments to Low-Oxygen Stress Highlights Conserved and Plant-Specific Responses. Plant Physiology, vol. 152, no. 3, pp. 1484-1500. http://dx.doi.org/10.1104/pp.109.151845 PMid:20097791.
» http://dx.doi.org/10.1104/pp.109.151845 - PANDEY, D.M. and KIM, S.-R., 2012. Identification and Expression Analysis of Hypoxia Stress Inducible CCCH-type Zinc Finger Protein Genes in Rice. Journal of Plant Biology, vol. 55, no. 6, pp. 489-497. http://dx.doi.org/10.1007/s12374-012-0384-4
» http://dx.doi.org/10.1007/s12374-012-0384-4 - PEGORARO, C., MERTZ, L.M., MAIA, L.C., ROMBALDI, C.V. and OLIVEIRA, A.C., 2011. Importance of heat shock proteins in maize. Journal of Crop Science Biotechnology, vol. 14, no. 2, pp. 85-95. http://dx.doi.org/10.1007/s12892-010-0119-3
» http://dx.doi.org/10.1007/s12892-010-0119-3 - PEGORARO, C., SANTOS, R.S., KRÜGER, M.M., TIECHER, A., MAIA, L.C., ROMBALDI, C.V. and OLIVEIRA, A.C., 2012. Effects of hypoxia storage on gene transcript accumulation during tomato fruit ripening. Brazilian Journal of Plant Physiology, vol. 24, no. 2, pp. 141-148. http://dx.doi.org/10.1590/S1677-04202012000200007
» http://dx.doi.org/10.1590/S1677-04202012000200007 - PERBONI, A.T., CASSOL, D., SILVA, F.S.P., SILVA, D.M. and BACARIN, M.A., 2012. Chlorophyll a fluorescence study revealing effects of flooding in canola hybrids. Biologia, vol. 67, no. 2, pp. 338-346. http://dx.doi.org/10.2478/s11756-012-0006-0
» http://dx.doi.org/10.2478/s11756-012-0006-0 - RAMPINO, P., MITA, G., PATALEO, S., DE PASCALI, M., DI FONZO, N. and PERROTTA, C., 2009. Acquisition of thermotolerance and HSP gene expression. In durum wheat (. Triticum durum Desf.) cultivarsEnvironmental and Experimental Botany, vol. 66, no. 2, pp. 257-264. http://dx.doi.org/10.1016/j.envexpbot.2009.04.001
» http://dx.doi.org/10.1016/j.envexpbot.2009.04.001 - SARKAR, N.K., YEON, K.K. and GROVER, A., 2009. Rice sHsp genes: genomic organization and expression profiling under stress and development. BMC Genomics - BioMed Central, vol. 10, pp. 393-410. http://dx.doi.org/10.1186/1471-2164-10-393
» http://dx.doi.org/10.1186/1471-2164-10-393 - SAUTER, M., 2013. Root responses to flooding. Current Opinion in Plant Biology, vol. 16, no. 3, pp. 282-286. http://dx.doi.org/10.1016/j.pbi.2013.03.013 PMid:23608517.
» http://dx.doi.org/10.1016/j.pbi.2013.03.013 - SIDDIQUE, M., GERNHARD, S., VON KOSKULL-DÖRING, P., VIERLING, E. and SCHARF, K.D., 2008. The plant sHSP superfamily: five new members in Arabidopsis thaliana with unexpected properties. Cell Stress & Chaperones, vol. 13, no. 2, pp. 183-197. http://dx.doi.org/10.1007/s12192-008-0032-6 PMid:18369739.
» http://dx.doi.org/10.1007/s12192-008-0032-6 - SLABBERT, R.M. and KRÜGER, G.H.J., 2011. Assessment of changes in photosystem II structure and function as affected by water deficit in L. and L. Amaranthus hypochondriacusAmaranthus hybridusPlant Physiology and Biochemistry, vol. 49, no. 9, pp. 978-984. http://dx.doi.org/10.1016/j.plaphy.2011.05.001 PMid:21696974.
» http://dx.doi.org/10.1016/j.plaphy.2011.05.001 - STIRBET, A., GOVINDJEE., STRASSER, B.J. and STRASSER, R.J., 1998. Chlorophyll Fluorescence Induction in Higher Plants: Modelling and Numerical Simulation. aJournal of Theoretical Biology, vol. 193, no. 1, pp. 131-15. http://dx.doi.org/10.1006/jtbi.1998.0692
» http://dx.doi.org/10.1006/jtbi.1998.0692 - STRASSER, B.J. and STRASSER, R.J., 1995. Measuring fast fluorescence transients to address environmental questions: The JIP-test. Photosynthesis: from Light to Biosphere, vol. 5, pp. 977-980.
- STRASSER, R.J., TSIMILLI-MICHAEL, M. and SRIVASTAVA, A., 2004. Analysis of the Chlorophyll fluorescence transient. In: aG.C. PAPAGEORGIOU and GOVINDJEE, eds. Chlorophyll Fluorescence: A Signature of Photosynthesis. Dordrecht: Springer - Verlag, pp. 321-362.
- STRASSER, R.J., TSIMILLI-MICHAEL, M., QIANG, S. and GOLTSEV, V., 2010. Simultaneous in vivo recording of prompt and delayed fluorescence and 820 nm reflection changes during drying and after rehydration of the resurrection plant Haberlea rhodopensis.Biochimica et Biophysica Acta Bioenergetics, vol. 1797, no. 6-7, pp. 122-122. http://dx.doi.org/10.1016/j.bbabio.2010.04.365 PMid:20226756.
» http://dx.doi.org/10.1016/j.bbabio.2010.04.365 - SÜLE, A., VANROBAEYS, F., HAJÓS, G., VAN BEEUMEN, J. and DEVREESE, B., 2004. Proteomic analysis of small heat shock protein isoforms in barley shoots. Phytochemistry, vol. 65, no. 12, pp. 1853-1863. http://dx.doi.org/10.1016/j.phytochem.2004.03.030 PMid:15276443.
» http://dx.doi.org/10.1016/j.phytochem.2004.03.030 - TAYLOR, N.L., TAN, Y.F., JACOBY, R.P. and MILLAR, A.H., 2009. Abiotic environmental stress induced changes in the . Arabidopsis thaliana chloroplast, mitochondria and peroxisome proteomesJournal of Proteomics, vol. 72, no. 3, pp. 367-378. http://dx.doi.org/10.1016/j.jprot.2008.11.006 PMid:19061979.
» http://dx.doi.org/10.1016/j.jprot.2008.11.006 - WATERS, E.R., 2013. The evolution, function, structure, and expression of the plant sHSPs. Journal of Experimental Botany, vol. 64, no. 2, pp. 391-403. http://dx.doi.org/10.1093/jxb/ers355 PMid:23255280.
» http://dx.doi.org/10.1093/jxb/ers355 - WATERS, E.R., AEVERMANN, B.D. and SANDERS-REED, Z., 2008. Comparativ e analysis of the small heat shock proteins in three angiosperm genomes identifies new subfamilies and reveals diverse evolutionary patterns. Cell Stress & Chaperones, vol. 13, no. 2, pp. 127-142. http://dx.doi.org/10.1007/s12192-008-0023-7 PMid:18759000.
» http://dx.doi.org/10.1007/s12192-008-0023-7 - WRIGHT, H., DELONG, J., LADA, R. and PRANGE, R., 2009. The relationsship between water status and chlorophyll fluorescence in grapes (. aVitis spp.)Postharvest Biology and Technology, vol. 51, no. 2, pp. 193-199. http://dx.doi.org/10.1016/j.postharvbio.2008.07.004
» http://dx.doi.org/10.1016/j.postharvbio.2008.07.004 - YUSUF, M.A., KUMAR, D., RAJWANSHI, R., STRASSER, R.J., TSIMILLI-MICHAEL, M., GOVINDJEE. and SARIN, N.B., 2010. Overexpression of -tocopherol methyl transferase gene in transgenic . yBrassica juncea plants alleviates abiotic stress: Physiological and chlorophyll a fluorescence measurementsBiochimica et Biophysica Acta, vol. 1797, no. 8, pp. 1428-1438. http://dx.doi.org/10.1016/j.bbabio.2010.02.002 PMid:20144585.
» http://dx.doi.org/10.1016/j.bbabio.2010.02.002 - ZOU, X., XIAOYU, T., CHENGWEI, H., LIU, Z., GUANGYUAN, L., GUIPING, F., YONG, C. and XUEKUN, Z., 2013. The transcriptome of . Brassica napus L. roots under waterlogging at the Seedling StageInternational Journal of Molecular Sciences, vol. 14, no. 2, pp. 2637-2651. http://dx.doi.org/10.3390/ijms14022637 PMid:23358252.
» http://dx.doi.org/10.3390/ijms14022637
Publication Dates
-
Publication in this collection
11 July 2016 -
Date of issue
Jan-Mar 2017
History
-
Received
05 June 2015 -
Accepted
15 Nov 2015


