Abstract
The use of GMO expressing Bt toxin in soybean production has increased significantly in the last years in Brazil in order to manage the damage caused by lepidopteran pests. In this study, we compared the richness and abundance of owlet moths (Noctuoidea) associated with Bt and non-Bt soybean. We determined the temporal variations as a function of phenology, and correlated the population variations of the most common species with meteorological variables. The research was conducted at the experimental area of Embrapa Cerrados. The collection method used was differentiated being suppressive and absolute. A total of 13 species were collected, of which eight occurred on Bt soybeans. The most representative taxa were Chrysodeixis includens (72.87%), Anticarsia gemmatalis (18.17%) and Spodoptera spp (5.22%). The number of larvae belonging to species targeted by the Bt technology was 10 times lower on Bt than on non-Bt soybeans. Utetheisa ornatrix and Elaphria deltoides were recorded on soybean for the first time, observing larvae of both species in non-Bt soybean and those of U. ornatrix also in Bt soybean. Only A. gemmatalis larvae correlated (p <0.05) negatively with precipitation. This study provided field information on the abundance and species richness of owlet moths on non-Bt soybeans, associated with the effects of Bt soybean. When considering the different levels of infestation between cultivars as a criterion, larvae monitoring is of substantial importance in order to develop the lost control program.
Keywords:
Anticarsia gemmatalis; Chrysodeixis includens; Cry1Ac toxin; Spodoptera spp
Resumo
O uso de OGM que expressam toxina Bt na produção de soja tem aumentado significativamente nos últimos anos no Brasil e são utilizados para conter os danos causados pelos lepidópteros pragas. Neste estudo comparamos a riqueza e a abundância de Noctuoides (Noctuoidea) associados à soja Bt e não-Bt. Determinamos as variações temporais em função da fenologia e correlacionamos às variações populacionais das espécies mais comuns com variáveis meteorológicas. A pesquisa foi conduzida na área experimental da Embrapa Cerrados. O método de coleta utilizado foi diferenciado sendo supressivo e absoluto. Um total de 13 espécies foram coletadas, das quais oito ocorreram em soja Bt. Os taxa mais representativos foram Chrysodeixis includens, Anticarsia gemmatalis e Spodoptera spp. O número de larvas pertencentes às espécies alvo da tecnologia Bt foram 10 vezes menores na soja Bt do que em soja não-Bt . Utetheisa ornatrix e Elaphria deltoides foram registradas na soja pela primeira vez, observando-se larvas de ambas espécies na soja não-Bt e as de U. ornatrix também na soja Bt. Somente as larvas de A. gemmatalis se correlacionaram (p <0,05) negativamente com a precipitação. Este estudo forneceu informações em campo sobre a abundância e riqueza de espécies na soja não- Bt, associada aos efeitos da soja Bt. A importância do monitoramento das lagartas é substancial, a fim de tomar a melhor decisão de controle, considerando-se os diferentes níveis de infestação entre cultivares como critério.
Palavras-chave:
Anticarsia gemmatalis; Chrysodeixis includens; toxina Cry1Ac; Spodoptera spp
1. Introduction
The production of soybean (Glycine max (L.) Merrill) in Brazil occupies 3.5% of the territory and it is considered the second largest worldwide producer and exporter of whole soybeans, soy meal and soy oil ( Hirakuri and Lazzarotto, 2014 HIRAKURI, M.H. and LAZZAROTTO, J.J., 2014 [viewed 5 June 2016]. O agronegócio da soja nos contextos mundial e brasileiro [online]. Londrina: Embrapa Soja, 14 p. Circular Técnica, no. 126. Avaliable from: https://www.infoteca.cnptia.embrapa.br/infoteca/handle/doc/1062878
https://www.infoteca.cnptia.embrapa.br/...
; Brasil, 2016 BRASIL. MINISTÉRIO DA AGRICULTURA, PECUÁRIA E ABASTECIMENTO, 2016 [viewed 8 November 2016]. Abastecimento da safra brasileira de grãos [online]. Brasília: Companhia Nacional de Abastecimento, Monitoramento Agrícola – Safra 2015/2016, vol. 1, no. 9. Available from: http://www.conab.gov.br/OlalaCMS/uploads/arquivos/16_06_09_16_49_15_boletim_graos_junho__2016_-_final.pdf
http://www.conab.gov.br/OlalaCMS/upload...
). Lepidoptera species are considered one of the most important groups among the insects that feed on soybean leaves causing direct defoliation. There are at least 69 species of Lepidoptera documented causing damage in soybean fields in South America (Argentina, Brazil, Chile and Uruguay). Among these species, representatives of the superfamily Noctuoidea are of particularly a concern due to its feeding behavior causing significant economic damage ( Moscardi et al., 2012 MOSCARDI, F., BUENO, A.F., SOSA-GÓMEZ, D.R., ROGGIA, S., HOFFMANN-CAMPO, C.B., POMARI, A.F., CORSO, I.C. and YANO, S.A.C. 2012. Capítulo 4 - Artrópodes que atacam as folhas da soja. In: HOFFMANN-CAMPO, C.B., CORREA-FERREIRA, B.S. and MOSCARDI, F. eds. Soja - manejo integrado de insetos e outros artrópodes-praga . Brasília: Embrapa, pp. 213-334. ; Formentini et al., 2015 FORMENTINI, A.C., SOSA-GÓMEZ, D.R., PAULA-MORAES, S.V., BARROS, N.M. and SPECHT, A., 2015. Lepidoptera (Insecta) associated with soybean in Argentina, Brazil, Chile and Uruguay. Ciência Rural, vol. 45, no. 12, pp. 2113-2120. http://dx.doi.org/10.1590/0103-8478cr20141258.
http://dx.doi.org/10.1590/0103-8478cr20...
).
The identification and monitoring of the abundance of lepidopterans in agroecosystems is essential in order to establish an efficient management strategy and allow for the proper use of insecticides ( Hoffmann-Campo et al., 2000 HOFFMANN-CAMPO, C.B., MOSCARDI, F., CORRÊA-FERREIRA, B.S., OLIVEIRA, L.J., SOSA-GÓMEZ, D.R., PANIZZI, A.R., CORSO, I.C., GAZZONI, D.L. and OLIVEIRA, E., 2000 [viewed 8 June 2016]. Pragas da soja no Brasil e seu manejo integrado [online]. Londrina: Embrapa Soja, 70 p. Circular Técnica, no. 30. Avaliable from: http://www.ccpran.com.br/upload/downloads/dow_7.pdf
http://www.ccpran.com.br/upload/downloa...
; Specht and Corseuil, 2002 SPECHT, A. and CORSEUIL, E., 2002. Avaliação populacional de lagartas e inimigos naturais em azevém, com rede de varredura. Pesquisa Agropecuária Brasileira, vol. 37, no. 1, pp. 1-6. http://dx.doi.org/10.1590/S0100-204X2002000100001.
http://dx.doi.org/10.1590/S0100-204X200...
). Additionally, understanding the preference of the phenological stages by the species promotes effective pest management strategies ( Moscardi et al., 2012 MOSCARDI, F., BUENO, A.F., SOSA-GÓMEZ, D.R., ROGGIA, S., HOFFMANN-CAMPO, C.B., POMARI, A.F., CORSO, I.C. and YANO, S.A.C. 2012. Capítulo 4 - Artrópodes que atacam as folhas da soja. In: HOFFMANN-CAMPO, C.B., CORREA-FERREIRA, B.S. and MOSCARDI, F. eds. Soja - manejo integrado de insetos e outros artrópodes-praga . Brasília: Embrapa, pp. 213-334. ; Zuffo et al., 2015 ZUFFO, A.M., ZAMBIAZZI, E.V., GESTEIRA, G.A., REZENDE, P.M., BRUZI, A.T., SOARES, I.O., GWINNER, R. and BIANCHI, M.C., 2015. Agronomic performance of soybean according to stages of development and levels of defoliation. African Journal of Agricultural Research , vol. 10, no. 19, pp. 2089-2096. http://dx.doi.org/10.5897/AJAR2014.9369.
http://dx.doi.org/10.5897/AJAR2014.9369...
).
In an attempt to reduce the impact of key Lepidopteran pests in soybean crops, several regions of Brazil have increased the use of transgenic varieties expressing the Cry1Ac toxin. This toxin, derived from a soil bacteria B. thuringiensis (Bt), was incorporated in most important crops providing a strategy for agricultural pest management, with substantial economic and environmental benefits. Specifically, in Brazil soybean crops Cry1Ac toxin targets the velvetbean caterpillar - Anticarsia gemmatalis (Hübner, 1818), the soybean looper Chrysodeixis includens (Walker, [1858]) and species belonging to the Heliothinae subfamily. Soybean crops expressing the Cry1Ac toxin reduce insect pest population densities and minimize the use of insecticides ( Roh et al., 2007 ROH, J.Y., CHOI, J.Y., LI, M.S., JIN, B.R. and JE, Y.H., 2007. Bacillus thuringiensis as a specific, safe, and effective tool for insect pest control. Journal of Microbiology and Biotechnology, vol. 17, no. 4, pp. 547-559. PMid:18051264. ).
To ensure the effectiveness against target insects, Bt crops need to be managed in a manner that prevents the development of resistant populations ( Bates et al., 2005 BATES, S.L., ZHAO, J.Z., ROUSH, R.T. and SHELTON, A.M., 2005. Insect resistance management in GM crops: past, present and future. Nature Biotechnology, vol. 23, no. 1, pp. 57-62. http://dx.doi.org/10.1038/nbt1056. PMid:15637622.
http://dx.doi.org/10.1038/nbt1056 ...
; Gould, 1998 GOULD, F., 1998. Sustainability of transgenic insecticidal cultivars: integrating pest genetics and ecology. Annual Review of Entomology, vol. 43, no. 1, pp. 701-726. http://dx.doi.org/10.1146/annurev.ento.43.1.701. PMid:15012402.
http://dx.doi.org/10.1146/annurev.ento....
). The strategies used to minimize insect resistance include the use of the high doses with plants expressing high levels of the toxin and the adoption of structured refuges ( Gould, 1998 GOULD, F., 1998. Sustainability of transgenic insecticidal cultivars: integrating pest genetics and ecology. Annual Review of Entomology, vol. 43, no. 1, pp. 701-726. http://dx.doi.org/10.1146/annurev.ento.43.1.701. PMid:15012402.
http://dx.doi.org/10.1146/annurev.ento....
). In addition, the adoption of Bt technologies can trigger changes in pest status by suppressing the populations of the main target species ( Catarino et al., 2015 CATARINO, R., CEDDIA, G., AREAL, F.J. and PARK, J., 2015. The impact of secondary pests on Bacillus thuringiensis (Bt) crops. Plant Biotechnology Journal, vol. 13, no. 5, pp. 601-612. http://dx.doi.org/10.1111/pbi.12363. PMid:25832330.
http://dx.doi.org/10.1111/pbi.12363 ...
).
Given the great diversity of Brazilian habitats, the community of owlet larvae is not well-known in the different soybean producing states, making it difficult to establish a sustainable management control strategy considering the different crops, expressing the Bt toxin or not. For the Cerrado Biome, there were developed soybean cultivars characterized by rusticity and grain yield potential were developed, specially adapted for areas that are more prone to high temperatures and scarcity of water.
This study is based on the hypothesis that the expression of the Cry1Ac toxin should induce a qualitative-quantitative differentiation of lepidoptera associated with non-Bt and Bt soybeans, especially on the target noctuids of the technology. The objectives of this study were to compare (A) richness, abundance and temporal variations of Noctuoids in different phenological stages on non-Bt and Bt soybeans, and (B) to correlate the meteorological variables with the results of the three most abundant species of Noctuoids.
2. Material and Methods
2.1. Non-Bt and Bt soybean
Two herbicide tolerant cultivars with long cycles were used, the BRS 9180 IPRO RR ( Bt) expressing the Cry1Ac protein and its near isoline BRS Sambaíba RR (non- Bt).
2.2. Experimental area and soybean cultivation
Soybean was cultivated in the experimental area of Embrapa Cerrados, located at km 18 of highway BR-020, Planaltina, DF (Lat. 15º36’04”19’ S, Long. 47º42’38’49’ West, altitude 1,208 m). The crop season was 2015/2016.
The soil preparation of weed and fungal disease control followed the technical recommendations for the region ( Embrapa Soja, 2011 EMBRAPA SOJA 2011 [viewed 23 March 2016]. Tecnologias de produção de soja-região central do Brasil 2012 e 2013 [online]. Londrina: Embrapa Soja, 261 p. Embrapa Soja. Sistemas de Produção, no. 15. Avaliable from: http://www.infoteca.cnptia.embrapa.br/handle/doc/904487
http://www.infoteca.cnptia.embrapa.br/h...
). The rows were separated by 50 cm, with 11 plants per meter, resulting in 250,000 ha- 1 plants. We sowed soybeans on November 11, 2015. All cultivation management was performed as described in Table 1 .
Description of the soybean development stages and cultivar treatments used in the experimental field of Embrapa Cerrados, Planaltina, Distrito Federal, Brazil in the harvest 2015/2016.
The decision making for pest control was based on weekly sampling. The level of control was established as necessary on either one of two conditions: 30% defoliation or population density of 20 larvae (> 1.5 cm) per square meter in the vegetative period and 15% defoliation, 15 larvae (> 1.5 cm) per square meter in the reproductive period ( Hoffmann-Campo et al., 2000 HOFFMANN-CAMPO, C.B., MOSCARDI, F., CORRÊA-FERREIRA, B.S., OLIVEIRA, L.J., SOSA-GÓMEZ, D.R., PANIZZI, A.R., CORSO, I.C., GAZZONI, D.L. and OLIVEIRA, E., 2000 [viewed 8 June 2016]. Pragas da soja no Brasil e seu manejo integrado [online]. Londrina: Embrapa Soja, 70 p. Circular Técnica, no. 30. Avaliable from: http://www.ccpran.com.br/upload/downloads/dow_7.pdf
http://www.ccpran.com.br/upload/downloa...
; Conte and Corrêa-Ferreira, 2014 CONTE, O. and CORRÊA-FERREIRA, B.S., 2014 [viewed 10 February 2016]. Resultados do manejo integrado de pragas da soja na safra 2013/14 no Paraná [online]. Londrina: Embrapa Soja, 60 p. Documentos, no. 361. Available from: http://ainfo.cnptia.embrapa.br/digital/bitstream/item/130954/1/doc361-OL-1.pdf
http://ainfo.cnptia.embrapa.br/digital/...
). However, since there was neither injury greater than 15% nor more than 10 larvae/m 2, insecticides were not applied in the soybean cultivation used in the field experiment.
2.3. Experimental design
A randomized block design (RBD), was used with three replications in a split plot design (2.1 to 2.5 ha) arranged in alternating mosaic shape (three plots for each of the cultivars, Bt and non-Bt). Each plot of 10,000 m2 (minimum boundary = 24 meters) was divided into 100 sub-plots of 10 x 10 m (100 m2), where 1m2 was used for randomized and suppressive sampling (by suppressive we mean that all soybean plants were removed for inspection, see under systematized sampling below). When the same subplot was drawn, the sampling (1 m2) was conducted in the adjacent area, avoiding overlaps.
2.4. Systematized sampling of lepidoptera
Larvae were collected weekly in 10 samples of 1 m2 from each of the 10 sub-plots (100 m2) randomized within each plot (10,000 m2). Eighteen samplings were carried out, starting 19 days after planting, and extending to the end of the plant cycle.
Suppressive (or absolute) samples (10 samples per plot) consisted of the total removal of soybean plants within a defined 1m2 plot. After plant removal, the soil surface was inspected and any insects that had fallen on the ground were also collected.
The plants with insects were placed in polyethylene bags (50 to 200 liters capacity) and transported to the Laboratory of Entomology at Embrapa Cerrados, where they were kept under refrigeration (T = -6 °C) until they could be sorted.
2.5. Sorting and species identification
We visually inspected each plant, examining all leaves (adaxial and abaxial sides), branches, stems, flowers and pods for presence of larvae.
The larvae were identified to the lowest possible taxonomic level ( Caballero et al., 1994 CABALLERO, R., HABECK, D.H. and ANDREWS, K.L., 1994. Chave Ilustrada para larvas de Nóctuidos de importancia económica de El Salvador, Honduras y Nicarágua. Ceiba, vol. 35, no. 2, pp. 2225-2237. ) and classified according to their size as small (<1.5cm), medium (> 1.5 cm <2.5 cm), and large (> 2.5 cm) ( Specht and Corseuil, 2002 SPECHT, A. and CORSEUIL, E., 2002. Avaliação populacional de lagartas e inimigos naturais em azevém, com rede de varredura. Pesquisa Agropecuária Brasileira, vol. 37, no. 1, pp. 1-6. http://dx.doi.org/10.1590/S0100-204X2002000100001.
http://dx.doi.org/10.1590/S0100-204X200...
). Data were recorded in spreadsheets and insects were tagged, photographed and placed in Eppendof plastic microtubules containing 70% alcohol where they were kept as vouchers. A total of 1080 soybean bags were collected and a total of more than 22,000 soybean plants were inspected.
2.6. Other field parameters
The expression of the Bt toxin was confirmed with the QuickStixTM test Kit from EnviroLogix, for Cry1Ac soybean designed to extract and detect Cry1Ac protein. We evaluated 84 points between the stages (vegetative and reproductive periods) of Bt and non-Bt soybean, for the planting documentation of the experiment.
The yield of each cultivar was evaluated considering the heterogeneity of the experimental area. Together with each cultivar a total of 72 random transects (10m long and 1m wide) were evaluated using machinery (Wintersteiger) which guarantees the minimum seed loss. Nevertheless, the production apart estimates of each non-Bt and Bt soybean was taken into consideration.
Meteorological data for the cultivation period (November 2015 to April 2016) were obtained from the Embrapa Cerrado Weather Station. They consisted of the maximum temperature (Tmax), mean temperature (Tmed), minimum temperature (T min), radiation (Rad), relative air humidity (RH), wind speed (WS) and precipitation (Prec).
2.7. Data analysis
The experimental design allowed the analysis of the following factors: two cultivars (2 levels) and nine phenological stages (9 levels) with three replications. The cultivar factor was composed of the Bt and non-Bt treatments. The phenological stages factor were composed of: V20-V21, R1, R 2, R3-R4, R4-R5.1, R5.2 , R5.3 R5.4 and R6 ( Table 1 ). Even though collecting was conducted starting on the second week after germination, only data from V20-V21 to R6 were analyzed, since they contained at least five larvae.
We used the Generalized Linear Models (GLMS) for the discrete distribution data determined by counting. Data was analyzed using R software version 3.1.0 ( R Core Team, 2014 R Core Team, 2014 [viewed 5 November 2015]. R: A Language and environment for statistical computing [online] R Foundation for Statistical Computing. Vienna, Austria. Avaliable from: https://www.r-project.org/
https://www.r-project.org/ ...
). The number of A. gemmatalis, C. includens, Spodoptera spp. and Noctuoidea (all species) were compared between treatments and cultivation periods. Due to the small number of insects, and behavioral similarities among the representatives of the four species of Spodoptera, those were grouped under Spodoptera spp.. All GLMS were subjected to residual analysis to evaluate the adequacy of error distribution through the Chi-Square (χ2) test ( Crawley, 2007 CRAWLEY, M.J., 2007. The R Book. 2nd ed. Chichester: John Wiley and Sons, Ltd. Statistical modelling, p. 323-386. ).
The meteorological data was used for a correlation between the climate and the main species and analyzed using Spearman Correlation Analysis in R software version 3.1.0 ( R Core Team, 2014 R Core Team, 2014 [viewed 5 November 2015]. R: A Language and environment for statistical computing [online] R Foundation for Statistical Computing. Vienna, Austria. Avaliable from: https://www.r-project.org/
https://www.r-project.org/ ...
).
The average yield of non-Bt and Bt soybeans was estimated and compared using the Student t - test for independent samples.
In all statistics tests performed, was 5% of probability considered.
3. Results
In total, 1,150 larvae were collected. They were distributed into 13 species, nine genera and six subfamilies of Erebidae and Noctuidae. The majority of the species were collected from non- Bt soybeans. Agrotis ipsilon (Hufnagel, 1766), Elaphria deltoides (Möschler, 1880), Mocis latipes (Guenée, 1852), Spodoptera albula (Walker, 1857) and Rachiplusia nu (Gueneé, 1852) were not collected from Bt soybean ( Table 2 ).
Number of larvae Noctuoidea collected from BRS Sambaíba RR (non-Bt ) and BRS 9180 IPRO RR (Bt) soybean, between December 2015 and March 2016, at Embrapa Cerrados, Planaltina, Distrito Federal, Brazil.
The number of larvae collected from non-Bt soybeans corresponded to 92% of the individuals ( Table 2 ). This difference was significant in the V20-V21 to R6, stages, when a population increase with a peak of 10 larvae per square meter in R4 -R5.1 ( Table 3 ) ( Figure 1 A).
Comparison on the mean number of larvae collected per square meter according to the Soybean Phenological Stage between non-Bt and Bt soybean at area Experimental of Embrapa Cerrados, Planaltina, Distrito Federal, Brazil (December 2015 to March 2016).

Average number (larvae/m2) of Chrysodeixis includens , Anticarsia gemmatalis and Spodoptera spp. ( S. albula, S. cosmioides, S. eridania and S. frugiperda) collected from non-Bt -BRS Sambaíba RR (A) and Bt - BRS 9180 IPRO RR soybean (B). Between December 2015 and March 2016, in the experimental area at Embrapa Cerrados, Planaltina, Distrito Federal, Brazil.
The most abundant species in both cultivars was C. includens (soybean looper). However, on non-Bt soybeans the average number of C. includens larvae was almost 14 times greater than on Bt soybeans. The soybean looper represented 74% of total number of larvae of all species found on non-Bt soybeans, while on Bt soybeans it accounted for 58% of the entire sample ( Table 2 ). This species was the most influential on the average numbers of larvae collected in the study. In the reproductive stage R4-R5.1 of the non-Bt soybeans, there was a peak population of 7.7 soybean looper larvae/m2 (p <0.001) ( Figure 1 A) ( Table 3 ).
Anticarsia gemmatalis (velvetbean caterpillar) was the second most abundant species on both Bt and non-Bt soybeans. On non- Bt soybeans, the average number of larvae was almost 11 times greater than on Bt soybeans. Larvae of this species were collected from R3-R4 . Anticarsia gemmatalis represented approximately 18% of the total number of larvae for all treatments. In the reproductive stages R5.2 and R5.3 of the non-Bt soybean, there was a peak population of approximately 1.5 larvae/m 2 (p <0.001) ( Figure 1 A, B; Table 3 ).
Larvae belonging to the four Spodoptera species [S. albula (Walker, 1857), S. cosmioides (Walker, 1858), S. eridania (Stoll, 1782) and S. frugiperda (J.E. Smith, 1797)], (n = 60) accounted for just over 5% of total larvae collected. On the non-Bt soybean, the average number of larvae was only three times greater than on the Bt soybeans. Considering all species together, individuals of Spodoptera species represented 4.2% of all larvae found on non-Bt soybeans, while their representation on Bt soybeans was 16.3%. A small number of larvae of this species occurred during the reproductive stages R3-R4, and it was significantly higher on Bt soybeans than non-Bt. During the two weeks that followed (R 4-R5.1 and R5.2), the average number of larvae on non- Bt soybeans was significantly higher than on Bt, representing a population of 0.6 larvae/m2 (p <0.001) ( Figure 1 ; Table 3 ).
The respective proportion of larvae according to size was similar between cultivars, however, different among species. The distribution by size class was as follows: Chrysodeixis includens: 22% were small, 26% were medium-sized, and 52% were large; A. gemmatalis: 11% were small, 52% were medium-sized, and 37% large; and Spodoptera spp: 15% were small, 55% were medium-sized and 30% were large.
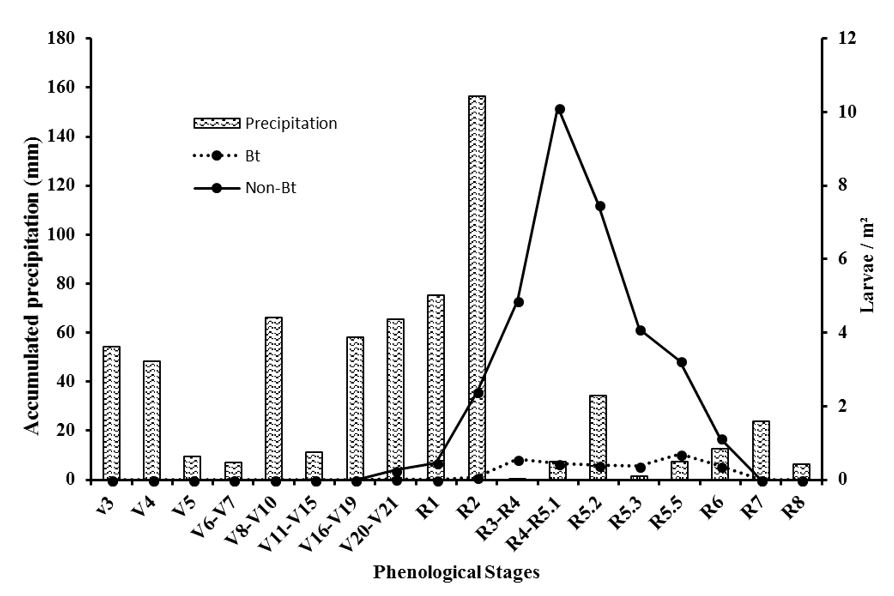
The weekly cumulative precipitation was the only weather parameter correlated with the number of A. gemmatalis larvae (p <0.05) ( Figure 2 ; Table 4 ).

Relationship between average larvae/m2 and weekly cumulative precipitation (mm3) in the experimental area at Embrapa Cerrados, Planaltina, Distrito Federal, Brazil. Between December 2015 and March 2016.
Spearman's Correlation Coefficient (r) between environmental variables (mean temperature, radiation, relative humidity, wind and precipitation) obtained from the weather station of Embrapa Cerrado, and the main Noctuid species of defoliating larvae recognized in this study at Embrapa Cerrados, Planaltina, Distrito Federal, Brazil.
According to the t - test the average yield (40.5 kg per hectare) showed no significant differences (P = 0.680) between non-Bt and Bt soybean.
4. Discussion
The low number of owlet species found in the present work (n=13) contrasts with the 31 noctuid soybean pests reported for South America ( Formentini et al., 2015 FORMENTINI, A.C., SOSA-GÓMEZ, D.R., PAULA-MORAES, S.V., BARROS, N.M. and SPECHT, A., 2015. Lepidoptera (Insecta) associated with soybean in Argentina, Brazil, Chile and Uruguay. Ciência Rural, vol. 45, no. 12, pp. 2113-2120. http://dx.doi.org/10.1590/0103-8478cr20141258.
http://dx.doi.org/10.1590/0103-8478cr20...
). The reduced diversity found in this study can be explained by the fact that these pest species are sporadic and limited to specific places in southern Brazil and neighboring countries (e.g. Agrotis gypaetina Guenée, 1852; Agrotis malefida Guenée, 1852; Dargida meridionalis (Hampson, 1905); Helicoverpa gelotopoeon (Dyar, 1921); Mythimna adultera (Schaus, 1894); Paracles cajetani (Rothschild, 1910); Paracles vulpina (Hübner, [1825]) and Peridroma saucia (Hübner, 1808)).
Despite this reduced diversity, two species, E. deltoides and Utetheisa ornatrix (Linnaeus, 1758), were observed feeding on soybean for the first time. Thus, there is a need for additional more surveys in different soybean regions were rotation with Crotalaria species (Fabaceae), the major hosts for U. ornatrix ( Sourakov, 2015 SOURAKOV, A., 2015. You are what you eat: native versus exotic Crotalaria species (Fabaceae) as host plants of the Ornate Bella Moth, Utetheisa ornatrix (Lepidoptera: Erebidae: Arctiinae). Journal of Natural History, vol. 49, no. 39-40, pp. 2397-2415. http://dx.doi.org/10.1080/00222933.2015.1006700.
http://dx.doi.org/10.1080/00222933.2015...
) occurs.
Non-Bt soybeans, represented 92% of the individuals and five species of larvae, which is certainly due to the expression of the Cry1Ac toxin, as it has already been proven to control lepidopteran pests in several countries ( Walker et al., 2000 WALKER, D.R., ALL, J.N., MC PHERSON, R.M., BOERMA, H.R. and PARROTT, W.A., 2000. Field evaluation of soybean engineered with a synthetic cry1Ac transgene for resistance to corn earworm, soybean looper, velvetbean caterpillar (Lepidoptera: Noctuidae), and lesser cornstalk borer (Lepidoptera: Pyralidae). Journal of Economic Entomology, vol. 93, no. 3, pp. 613-622. http://dx.doi.org/10.1603/0022-0493-93.3.613. PMid:10902306.
http://dx.doi.org/10.1603/0022-0493-93....
).
The maximum density of C. includens larvae/m2 was below the control level during the entire period and only one population peak was found between R 4-R5.1 and R5.2, where larvae were collected mainly from the reproductive stage. This differed from several observations on early infestations (three or four weeks after soybean germination), indicating at least two population peaks per harvest ( Conte and Corrêa-Ferreira, 2014 CONTE, O. and CORRÊA-FERREIRA, B.S., 2014 [viewed 10 February 2016]. Resultados do manejo integrado de pragas da soja na safra 2013/14 no Paraná [online]. Londrina: Embrapa Soja, 60 p. Documentos, no. 361. Available from: http://ainfo.cnptia.embrapa.br/digital/bitstream/item/130954/1/doc361-OL-1.pdf
http://ainfo.cnptia.embrapa.br/digital/...
).The small number of larvae collected on Bt soybean cultivar (with the proportion of collected on non-Bt soybean) indicates the susceptibility of C. includens to the Cry1Ac toxin ( Bernardi et al., 2012 BERNARDI, O., MALVESTITI, G.S., DOURADO, P.M., OLIVEIRA, W.S., MARTINELLI, S., BERGER, G.U., HEAD, G.P. and OMOTO, C., 2012. Assessment of the high‐dose concept and level of control provided by MON 87701× MON 89788 soybean against Anticarsia gemmatalis and Pseudoplusia includens (Lepidoptera: Noctuidae) in Brazil. Pest Management Science, vol. 68, no. 7, pp. 1083-1091. http://dx.doi.org/10.1002/ps.3271. PMid:22407725.
http://dx.doi.org/10.1002/ps.3271 ...
; Sorgatto et al., 2015 SORGATTO, R.J., BERNARDI, O. and OMOTO, C., 2015. Survival and development of Spodoptera frugiperda and Chrysodeixis includens (Lepidoptera: Noctuidae) on Bt cotton and Implications for resistance management strategies in Brazil. Environmental Entomology, vol. 44, no. 1, pp. 186-192. http://dx.doi.org/10.1093/ee/nvu018. PMid:26308821.
http://dx.doi.org/10.1093/ee/nvu018 ...
; Yano et al., 2016 YANO, S.A., SPECHT, A., MOSCARDI, F., CARVALHO, R.A., DOURADO, P.M., MARTINELLI, S., HEAD, G.P. and SÓSA-GÓMEZ, D.R., 2016. High susceptibility and low resistance allele frequency of Chrysodeixis includens (Lepidoptera: Noctuidae) field populations to Cry1Ac in Brazil. Pest Management Science, vol. 72, no. 8, pp. 1578-1584. http://dx.doi.org/10.1002/ps.4191. PMid:26581167.
http://dx.doi.org/10.1002/ps.4191 ...
).
The reduced amount of A. gemmatalis larvae (maximum 1.63/m2 ), restricted to the reproductive stages of the soybean, differ with most publications, which document high rates of infestation and defoliation by this species ( Walker et al., 2000 WALKER, D.R., ALL, J.N., MC PHERSON, R.M., BOERMA, H.R. and PARROTT, W.A., 2000. Field evaluation of soybean engineered with a synthetic cry1Ac transgene for resistance to corn earworm, soybean looper, velvetbean caterpillar (Lepidoptera: Noctuidae), and lesser cornstalk borer (Lepidoptera: Pyralidae). Journal of Economic Entomology, vol. 93, no. 3, pp. 613-622. http://dx.doi.org/10.1603/0022-0493-93.3.613. PMid:10902306.
http://dx.doi.org/10.1603/0022-0493-93....
). The proportion of A. gemmatalis larvae collected on Bt soybeans versus those collected from non-Bt were less than , which certainly illustrates the species susceptibility to the Cry1Ac toxin ( Walker et al., 2000 WALKER, D.R., ALL, J.N., MC PHERSON, R.M., BOERMA, H.R. and PARROTT, W.A., 2000. Field evaluation of soybean engineered with a synthetic cry1Ac transgene for resistance to corn earworm, soybean looper, velvetbean caterpillar (Lepidoptera: Noctuidae), and lesser cornstalk borer (Lepidoptera: Pyralidae). Journal of Economic Entomology, vol. 93, no. 3, pp. 613-622. http://dx.doi.org/10.1603/0022-0493-93.3.613. PMid:10902306.
http://dx.doi.org/10.1603/0022-0493-93....
). The lower incidence of A. gemmatalis compared to C. includens showed here may support that this species is no longer the most important lepidopteran pest of soybean as suggested by Moscardi et al. (2012) MOSCARDI, F., BUENO, A.F., SOSA-GÓMEZ, D.R., ROGGIA, S., HOFFMANN-CAMPO, C.B., POMARI, A.F., CORSO, I.C. and YANO, S.A.C. 2012. Capítulo 4 - Artrópodes que atacam as folhas da soja. In: HOFFMANN-CAMPO, C.B., CORREA-FERREIRA, B.S. and MOSCARDI, F. eds. Soja - manejo integrado de insetos e outros artrópodes-praga . Brasília: Embrapa, pp. 213-334. .
Four of the five species of Spodoptera whose larvae feed on soybean in South America were collected ( Formentini et al., 2015 FORMENTINI, A.C., SOSA-GÓMEZ, D.R., PAULA-MORAES, S.V., BARROS, N.M. and SPECHT, A., 2015. Lepidoptera (Insecta) associated with soybean in Argentina, Brazil, Chile and Uruguay. Ciência Rural, vol. 45, no. 12, pp. 2113-2120. http://dx.doi.org/10.1590/0103-8478cr20141258.
http://dx.doi.org/10.1590/0103-8478cr20...
; Montezano et al., 2015 MONTEZANO, D.G., SOSA-GÓMEZ, D.R., PAULA-MORAES, S.V., ROQUE-SPECHT, V.F., FRONZA, E., BARROS, N.M. and SPECHT, A., 2015. Biotic potential and reproductive parameters of Spodoptera dolichos (Lepidoptera: Noctuidae) in the laboratory. Zoologia , vol. 32, no. 6, pp. 485-491. http://dx.doi.org/10.1590/s1984-46702015000600008.
http://dx.doi.org/10.1590/s1984-4670201...
). Spodoptera accounted for only 5% of the total sample, differing from other studies that suggested the increase of this genus in soybean crops in Brazil, both on leaves and pods ( Moscardi et al., 2012 MOSCARDI, F., BUENO, A.F., SOSA-GÓMEZ, D.R., ROGGIA, S., HOFFMANN-CAMPO, C.B., POMARI, A.F., CORSO, I.C. and YANO, S.A.C. 2012. Capítulo 4 - Artrópodes que atacam as folhas da soja. In: HOFFMANN-CAMPO, C.B., CORREA-FERREIRA, B.S. and MOSCARDI, F. eds. Soja - manejo integrado de insetos e outros artrópodes-praga . Brasília: Embrapa, pp. 213-334. ). More than 50% of the Spodoptera larvae belong to Spodoptera eridania (Stoll, 1782), the most important pests of soybeans and cotton in different agricultural systems ( Santos et al., 2005 SANTOS, K.B., MENEGUIM, A.M. and NEVES, P.M., 2005. Biology and consumption of Spodoptera eridania (Cramer) (Lepidoptera: Noctuidae) in different hosts. Neotropical Entomology, vol. 34, no. 6, pp. 903-910. http://dx.doi.org/10.1590/S1519-566X2005000600005.
http://dx.doi.org/10.1590/S1519-566X200...
). It is important to keep in mind that Spodoptera are not targeted pests of the Bt technology, which explains the lower susceptibility of Spodoptera to the Cry1Ac toxin ( Bernardi et al., 2014 BERNARDI, O., SORGATTO, R.J., BARBOSA, A.D., DOMINGUES, F.A., DOURADO, P.M., CARVALHO, R.A., MARTINELLI, S., HEAD, G.P. and OMOTO, C., 2014. Low susceptibility of Spodoptera cosmioides, Spodoptera eridania and Spodoptera frugiperda (Lepidoptera: Noctuidae) to genetically-modified soybean expressing Cry1Ac protein. Crop Protection (Guildford, Surrey), vol. 58, pp. 33-40. http://dx.doi.org/10.1016/j.cropro.2014.01.001.
http://dx.doi.org/10.1016/j.cropro.2014...
; Sorgatto et al., 2015 SORGATTO, R.J., BERNARDI, O. and OMOTO, C., 2015. Survival and development of Spodoptera frugiperda and Chrysodeixis includens (Lepidoptera: Noctuidae) on Bt cotton and Implications for resistance management strategies in Brazil. Environmental Entomology, vol. 44, no. 1, pp. 186-192. http://dx.doi.org/10.1093/ee/nvu018. PMid:26308821.
http://dx.doi.org/10.1093/ee/nvu018 ...
).
The larvae sizes differed from the expected, even though the control level was not reached. Medium and large larvae were not expected in a large number for A. gemmatalis and C. inlcudens species. The small size larvae (<1.5 cm) represented the lowest proportion of individuals collected of all species, contrasting with studies on soybeans and other crops ( Specht and Corseuil, 2002 SPECHT, A. and CORSEUIL, E., 2002. Avaliação populacional de lagartas e inimigos naturais em azevém, com rede de varredura. Pesquisa Agropecuária Brasileira, vol. 37, no. 1, pp. 1-6. http://dx.doi.org/10.1590/S0100-204X2002000100001.
http://dx.doi.org/10.1590/S0100-204X200...
).
Considering the atypical climate, the low number of individuals collected can be attributed to the El Niño phenomenon that for standardization is characterized by a positive Oceanic Niño Index (ONI) greater than or equal to +0.5 °C for at least three consecutive months. The last episode extended from October 2014 to April 2016, with ONI values above 2.0 between November 2015 to January 2016 ( Null, 2016 NULL, J., 2016 [viewed 9 January 2017]. El Niño and La Niña years and intensities: based on Oceanic Niño 505 Index (ONI) [online]. Saratoga: Golden Gate Weather Services. Available from: http://ggweather.com/enso/oni.htm
http://ggweather.com/enso/oni.htm ...
). In the Brazilian Savanna this phenomena determines high temperatures and irregular precipitation with volumes much lower than expected. In the 2015-2016 crop season, 855.2 mm of precipitation was recorded, representing only 61.81% of the 1,383.7 mm expected in the climatological normal ( Silva et al., 2014 SILVA, F.A.M., EVANGELISTA, B.A. and MALAQUIAS, J.V., 2014. Normal Climatológica de 2014 a 2003 da Estação Principal da Embrapa Cerrados. Planaltina: Embrapa Cerrados, 98 p. Documentos, no. 321. ). This event led a decreased yield of grains and cotton in all biome (Brasil, 2016) BRASIL. MINISTÉRIO DA AGRICULTURA, PECUÁRIA E ABASTECIMENTO, 2016 [viewed 8 November 2016]. Abastecimento da safra brasileira de grãos [online]. Brasília: Companhia Nacional de Abastecimento, Monitoramento Agrícola – Safra 2015/2016, vol. 1, no. 9. Available from: http://www.conab.gov.br/OlalaCMS/uploads/arquivos/16_06_09_16_49_15_boletim_graos_junho__2016_-_final.pdf
http://www.conab.gov.br/OlalaCMS/upload...
. For decades, it has been known that climate has an effect on insects, including Lepidoptera ( Pardikes et al., 2015 PARDIKES, N.A., SHAPIRO, A.M., DYER, L.A. and FORISTER, M.L., 2015. Global weather and local butterflies: variable responses to a large‐scale climate pattern along an elevational gradient. Ecology, vol. 96, no. 11, pp. 2891-2901. http://dx.doi.org/10.1890/15-0661.1. PMid:27070009.
http://dx.doi.org/10.1890/15-0661.1 ...
). With contrast there is a lack of knowledge of the consequences of El Niño in different Brazilian regions and its impact on food production and pest insects ( Anderson et al., 2017 ANDERSON, W., SEAGER, R., BAETHGEN, W. and CANE, M., 2017. Crop production variability in North and South America forced by life-cycles of the El Niño Southern Oscillation. Agricultural and Forest Meteorology, vol. 239, pp. 151-165. http://dx.doi.org/10.1016/j.agrformet.2017.03.008.
http://dx.doi.org/10.1016/j.agrformet.2...
).
The negative correlation between population density of A. gemmatalis and rainfall reinforces the idea that years with low or irregular rainfall can be associated with increased population densities ( Sujii et al., 2002 SUJII, E.R., TIGANO, M.S. and SOSA-GOMES, D., 2002. Simulação do impacto do fungo Nomuraea rileyi em populações da lagarta da soja, Anticarsia gemmatalis. Pesquisa Agropecuária Brasileira , vol. 37, no. 11, pp. 1551-1558. http://dx.doi.org/10.1590/S0100-204X2002001100005.
http://dx.doi.org/10.1590/S0100-204X200...
). The identification of a correlation between climatic variables and the occurrence of Lepidoptera would be desirable to forecast the occurrence of each species based on current and future weather conditions.
This study documented the efficacy of the Bt technology and the Cry1Ac toxin for the management of target species, such as C. includens and A. gemmatalis, corroborating the reports of different authors after laboratory and field studies ( Walker et al., 2000 WALKER, D.R., ALL, J.N., MC PHERSON, R.M., BOERMA, H.R. and PARROTT, W.A., 2000. Field evaluation of soybean engineered with a synthetic cry1Ac transgene for resistance to corn earworm, soybean looper, velvetbean caterpillar (Lepidoptera: Noctuidae), and lesser cornstalk borer (Lepidoptera: Pyralidae). Journal of Economic Entomology, vol. 93, no. 3, pp. 613-622. http://dx.doi.org/10.1603/0022-0493-93.3.613. PMid:10902306.
http://dx.doi.org/10.1603/0022-0493-93....
; Bernardi et al., 2014 BERNARDI, O., SORGATTO, R.J., BARBOSA, A.D., DOMINGUES, F.A., DOURADO, P.M., CARVALHO, R.A., MARTINELLI, S., HEAD, G.P. and OMOTO, C., 2014. Low susceptibility of Spodoptera cosmioides, Spodoptera eridania and Spodoptera frugiperda (Lepidoptera: Noctuidae) to genetically-modified soybean expressing Cry1Ac protein. Crop Protection (Guildford, Surrey), vol. 58, pp. 33-40. http://dx.doi.org/10.1016/j.cropro.2014.01.001.
http://dx.doi.org/10.1016/j.cropro.2014...
; Sorgatto et al., 2015 SORGATTO, R.J., BERNARDI, O. and OMOTO, C., 2015. Survival and development of Spodoptera frugiperda and Chrysodeixis includens (Lepidoptera: Noctuidae) on Bt cotton and Implications for resistance management strategies in Brazil. Environmental Entomology, vol. 44, no. 1, pp. 186-192. http://dx.doi.org/10.1093/ee/nvu018. PMid:26308821.
http://dx.doi.org/10.1093/ee/nvu018 ...
; Yano et al., 2016 YANO, S.A., SPECHT, A., MOSCARDI, F., CARVALHO, R.A., DOURADO, P.M., MARTINELLI, S., HEAD, G.P. and SÓSA-GÓMEZ, D.R., 2016. High susceptibility and low resistance allele frequency of Chrysodeixis includens (Lepidoptera: Noctuidae) field populations to Cry1Ac in Brazil. Pest Management Science, vol. 72, no. 8, pp. 1578-1584. http://dx.doi.org/10.1002/ps.4191. PMid:26581167.
http://dx.doi.org/10.1002/ps.4191 ...
).
Nevertheless it is recommended that comparative studies should be conducted to test the effectiveness of different, non-suppressive, sampling methods compared to absolute sampling. ( Didonet et al., 2003 DIDONET, J., SARMENTO, R.A., AGUIAR, R.W.D.S., SANTOS, G. and ERASMO, E.A.L., 2003. Abundância de pragas e inimigos naturais em soja na região de Gurupi, Brasil. Manejo Integrado de Plagas y Agroecología, vol. 69, pp. 50-57. ; Conte and Correa-Ferreira, 2014; Cabral Antúnez et al., 2017 CABRAL ANTÚNEZ, C.C., STORCK, L., CARÚS GUEDES, J.V., RASCHE ALVAREZ, J.W., SCHAEFER, G.L. and CARGNELUTTI FILHO, A., 2017. Tamanho de amostra para avaliar a densidade populacional de lagartas em lavouras de soja. Investigación Agraria , vol. 18, no. 2, pp. 70-76. http://dx.doi.org/10.18004/investig.agrar.2016.diciembre.70-76.
http://dx.doi.org/10.18004/investig.agr...
).
Despite the differences detected between the numbers of larvae collected in both cultivars ( Tables 1
and 2 , Figures 1
and 2 ), the productivity of non-Bt and Bt soybean was statistically equal, even without the use of any insecticide during the entire soybean development cycle. Even with 10 times more larvae per square meter found in non-Bt soybean, no differences in productivity were observed, indicating that the total number of larvae did not reach the level of economic damage ( Hoffmann-Campo et al., 2000 HOFFMANN-CAMPO, C.B., MOSCARDI, F., CORRÊA-FERREIRA, B.S., OLIVEIRA, L.J., SOSA-GÓMEZ, D.R., PANIZZI, A.R., CORSO, I.C., GAZZONI, D.L. and OLIVEIRA, E., 2000 [viewed 8 June 2016]. Pragas da soja no Brasil e seu manejo integrado [online]. Londrina: Embrapa Soja, 70 p. Circular Técnica, no. 30. Avaliable from: http://www.ccpran.com.br/upload/downloads/dow_7.pdf
http://www.ccpran.com.br/upload/downloa...
; Conte and Corrêa-Ferreira, 2014 CONTE, O. and CORRÊA-FERREIRA, B.S., 2014 [viewed 10 February 2016]. Resultados do manejo integrado de pragas da soja na safra 2013/14 no Paraná [online]. Londrina: Embrapa Soja, 60 p. Documentos, no. 361. Available from: http://ainfo.cnptia.embrapa.br/digital/bitstream/item/130954/1/doc361-OL-1.pdf
http://ainfo.cnptia.embrapa.br/digital/...
). This finding reinforces the need to monitor the number of larvae throughout the soybean to rationalize the use of insecticides.
In conclusion, this study shows the differential abundance/occurrence and susceptibility of the main representatives of Noctuoidea associated with soybeans demonstrating the importance of field monitoring to assist on decision-making, and to assess the effectiveness of the technology. In addition U. ornatrix and E. deltoides were identified for the first time on soybean ( Formentini et al., 2015 FORMENTINI, A.C., SOSA-GÓMEZ, D.R., PAULA-MORAES, S.V., BARROS, N.M. and SPECHT, A., 2015. Lepidoptera (Insecta) associated with soybean in Argentina, Brazil, Chile and Uruguay. Ciência Rural, vol. 45, no. 12, pp. 2113-2120. http://dx.doi.org/10.1590/0103-8478cr20141258.
http://dx.doi.org/10.1590/0103-8478cr20...
). Overall, this type of study allows for the assessment of the status of each species in the agro-ecosystem. The evaluation of target pests, which are kept under control by the Bt technology, and the monitoring of secondary pests or other species that may use the available resource, can assist in the early detection of outbreaks. Therefore, under the particular conditions of this study, the negative correlation between population density of A. gemmatalis and rainfall was found.
Acknowledgements
The authors thanks to Instituto Chico Mendes (ICMBio) - Ministério do Meio Ambiente do Brasil – Authorization for scientific activities SISBIO 38547/(1-6); Conselho Nacional de Desenvolvimento Cientifico e Tecnológico (CNPq) (proc n°. 403376/2013-0, 476691/2013-3) and Empresa Brasileira de Pesquisa Agropecuária (SEG MP2 02.13.14.006.00.00) for research funding. We also thank the technician Orlando Vieira, for all the assistance provided in the implementation of field activities.
-
(With 2 figures)
References
- ANDERSON, W., SEAGER, R., BAETHGEN, W. and CANE, M., 2017. Crop production variability in North and South America forced by life-cycles of the El Niño Southern Oscillation. Agricultural and Forest Meteorology, vol. 239, pp. 151-165. http://dx.doi.org/10.1016/j.agrformet.2017.03.008.
» http://dx.doi.org/10.1016/j.agrformet.2017.03.008 - BATES, S.L., ZHAO, J.Z., ROUSH, R.T. and SHELTON, A.M., 2005. Insect resistance management in GM crops: past, present and future. Nature Biotechnology, vol. 23, no. 1, pp. 57-62. http://dx.doi.org/10.1038/nbt1056. PMid:15637622.
» http://dx.doi.org/10.1038/nbt1056 - BERNARDI, O., MALVESTITI, G.S., DOURADO, P.M., OLIVEIRA, W.S., MARTINELLI, S., BERGER, G.U., HEAD, G.P. and OMOTO, C., 2012. Assessment of the high‐dose concept and level of control provided by MON 87701× MON 89788 soybean against Anticarsia gemmatalis and Pseudoplusia includens (Lepidoptera: Noctuidae) in Brazil. Pest Management Science, vol. 68, no. 7, pp. 1083-1091. http://dx.doi.org/10.1002/ps.3271. PMid:22407725.
» http://dx.doi.org/10.1002/ps.3271 - BERNARDI, O., SORGATTO, R.J., BARBOSA, A.D., DOMINGUES, F.A., DOURADO, P.M., CARVALHO, R.A., MARTINELLI, S., HEAD, G.P. and OMOTO, C., 2014. Low susceptibility of Spodoptera cosmioides, Spodoptera eridania and Spodoptera frugiperda (Lepidoptera: Noctuidae) to genetically-modified soybean expressing Cry1Ac protein. Crop Protection (Guildford, Surrey), vol. 58, pp. 33-40. http://dx.doi.org/10.1016/j.cropro.2014.01.001.
» http://dx.doi.org/10.1016/j.cropro.2014.01.001 - BRASIL. MINISTÉRIO DA AGRICULTURA, PECUÁRIA E ABASTECIMENTO, 2016 [viewed 8 November 2016]. Abastecimento da safra brasileira de grãos [online]. Brasília: Companhia Nacional de Abastecimento, Monitoramento Agrícola – Safra 2015/2016, vol. 1, no. 9. Available from: http://www.conab.gov.br/OlalaCMS/uploads/arquivos/16_06_09_16_49_15_boletim_graos_junho__2016_-_final.pdf
» http://www.conab.gov.br/OlalaCMS/uploads/arquivos/16_06_09_16_49_15_boletim_graos_junho__2016_-_final.pdf - CABALLERO, R., HABECK, D.H. and ANDREWS, K.L., 1994. Chave Ilustrada para larvas de Nóctuidos de importancia económica de El Salvador, Honduras y Nicarágua. Ceiba, vol. 35, no. 2, pp. 2225-2237.
- CABRAL ANTÚNEZ, C.C., STORCK, L., CARÚS GUEDES, J.V., RASCHE ALVAREZ, J.W., SCHAEFER, G.L. and CARGNELUTTI FILHO, A., 2017. Tamanho de amostra para avaliar a densidade populacional de lagartas em lavouras de soja. Investigación Agraria , vol. 18, no. 2, pp. 70-76. http://dx.doi.org/10.18004/investig.agrar.2016.diciembre.70-76.
» http://dx.doi.org/10.18004/investig.agrar.2016.diciembre.70-76 - CATARINO, R., CEDDIA, G., AREAL, F.J. and PARK, J., 2015. The impact of secondary pests on Bacillus thuringiensis (Bt) crops. Plant Biotechnology Journal, vol. 13, no. 5, pp. 601-612. http://dx.doi.org/10.1111/pbi.12363. PMid:25832330.
» http://dx.doi.org/10.1111/pbi.12363 - CONTE, O. and CORRÊA-FERREIRA, B.S., 2014 [viewed 10 February 2016]. Resultados do manejo integrado de pragas da soja na safra 2013/14 no Paraná [online]. Londrina: Embrapa Soja, 60 p. Documentos, no. 361. Available from: http://ainfo.cnptia.embrapa.br/digital/bitstream/item/130954/1/doc361-OL-1.pdf
» http://ainfo.cnptia.embrapa.br/digital/bitstream/item/130954/1/doc361-OL-1.pdf - CRAWLEY, M.J., 2007. The R Book. 2nd ed. Chichester: John Wiley and Sons, Ltd. Statistical modelling, p. 323-386.
- DIDONET, J., SARMENTO, R.A., AGUIAR, R.W.D.S., SANTOS, G. and ERASMO, E.A.L., 2003. Abundância de pragas e inimigos naturais em soja na região de Gurupi, Brasil. Manejo Integrado de Plagas y Agroecología, vol. 69, pp. 50-57.
- EMBRAPA SOJA 2011 [viewed 23 March 2016]. Tecnologias de produção de soja-região central do Brasil 2012 e 2013 [online]. Londrina: Embrapa Soja, 261 p. Embrapa Soja. Sistemas de Produção, no. 15. Avaliable from: http://www.infoteca.cnptia.embrapa.br/handle/doc/904487
» http://www.infoteca.cnptia.embrapa.br/handle/doc/904487 - FORMENTINI, A.C., SOSA-GÓMEZ, D.R., PAULA-MORAES, S.V., BARROS, N.M. and SPECHT, A., 2015. Lepidoptera (Insecta) associated with soybean in Argentina, Brazil, Chile and Uruguay. Ciência Rural, vol. 45, no. 12, pp. 2113-2120. http://dx.doi.org/10.1590/0103-8478cr20141258.
» http://dx.doi.org/10.1590/0103-8478cr20141258 - GOULD, F., 1998. Sustainability of transgenic insecticidal cultivars: integrating pest genetics and ecology. Annual Review of Entomology, vol. 43, no. 1, pp. 701-726. http://dx.doi.org/10.1146/annurev.ento.43.1.701. PMid:15012402.
» http://dx.doi.org/10.1146/annurev.ento.43.1.701 - HIRAKURI, M.H. and LAZZAROTTO, J.J., 2014 [viewed 5 June 2016]. O agronegócio da soja nos contextos mundial e brasileiro [online]. Londrina: Embrapa Soja, 14 p. Circular Técnica, no. 126. Avaliable from: https://www.infoteca.cnptia.embrapa.br/infoteca/handle/doc/1062878
» https://www.infoteca.cnptia.embrapa.br/infoteca/handle/doc/1062878 - HOFFMANN-CAMPO, C.B., MOSCARDI, F., CORRÊA-FERREIRA, B.S., OLIVEIRA, L.J., SOSA-GÓMEZ, D.R., PANIZZI, A.R., CORSO, I.C., GAZZONI, D.L. and OLIVEIRA, E., 2000 [viewed 8 June 2016]. Pragas da soja no Brasil e seu manejo integrado [online]. Londrina: Embrapa Soja, 70 p. Circular Técnica, no. 30. Avaliable from: http://www.ccpran.com.br/upload/downloads/dow_7.pdf
» http://www.ccpran.com.br/upload/downloads/dow_7.pdf - MONTEZANO, D.G., SOSA-GÓMEZ, D.R., PAULA-MORAES, S.V., ROQUE-SPECHT, V.F., FRONZA, E., BARROS, N.M. and SPECHT, A., 2015. Biotic potential and reproductive parameters of Spodoptera dolichos (Lepidoptera: Noctuidae) in the laboratory. Zoologia , vol. 32, no. 6, pp. 485-491. http://dx.doi.org/10.1590/s1984-46702015000600008.
» http://dx.doi.org/10.1590/s1984-46702015000600008 - MOSCARDI, F., BUENO, A.F., SOSA-GÓMEZ, D.R., ROGGIA, S., HOFFMANN-CAMPO, C.B., POMARI, A.F., CORSO, I.C. and YANO, S.A.C. 2012. Capítulo 4 - Artrópodes que atacam as folhas da soja. In: HOFFMANN-CAMPO, C.B., CORREA-FERREIRA, B.S. and MOSCARDI, F. eds. Soja - manejo integrado de insetos e outros artrópodes-praga . Brasília: Embrapa, pp. 213-334.
- NULL, J., 2016 [viewed 9 January 2017]. El Niño and La Niña years and intensities: based on Oceanic Niño 505 Index (ONI) [online]. Saratoga: Golden Gate Weather Services. Available from: http://ggweather.com/enso/oni.htm
» http://ggweather.com/enso/oni.htm - PARDIKES, N.A., SHAPIRO, A.M., DYER, L.A. and FORISTER, M.L., 2015. Global weather and local butterflies: variable responses to a large‐scale climate pattern along an elevational gradient. Ecology, vol. 96, no. 11, pp. 2891-2901. http://dx.doi.org/10.1890/15-0661.1. PMid:27070009.
» http://dx.doi.org/10.1890/15-0661.1 - R Core Team, 2014 [viewed 5 November 2015]. R: A Language and environment for statistical computing [online] R Foundation for Statistical Computing. Vienna, Austria. Avaliable from: https://www.r-project.org/
» https://www.r-project.org/ - RITCHIE, S.W., HANWAY, J.J. and THOMPSON, H.E., 1985. How a soybean plant develops . Ames: University of Science and Technology, Cooperative Extension Service, 20 p. Special Report, no. 53.
- ROH, J.Y., CHOI, J.Y., LI, M.S., JIN, B.R. and JE, Y.H., 2007. Bacillus thuringiensis as a specific, safe, and effective tool for insect pest control. Journal of Microbiology and Biotechnology, vol. 17, no. 4, pp. 547-559. PMid:18051264.
- SANTOS, K.B., MENEGUIM, A.M. and NEVES, P.M., 2005. Biology and consumption of Spodoptera eridania (Cramer) (Lepidoptera: Noctuidae) in different hosts. Neotropical Entomology, vol. 34, no. 6, pp. 903-910. http://dx.doi.org/10.1590/S1519-566X2005000600005.
» http://dx.doi.org/10.1590/S1519-566X2005000600005 - SILVA, F.A.M., EVANGELISTA, B.A. and MALAQUIAS, J.V., 2014. Normal Climatológica de 2014 a 2003 da Estação Principal da Embrapa Cerrados Planaltina: Embrapa Cerrados, 98 p. Documentos, no. 321.
- SORGATTO, R.J., BERNARDI, O. and OMOTO, C., 2015. Survival and development of Spodoptera frugiperda and Chrysodeixis includens (Lepidoptera: Noctuidae) on Bt cotton and Implications for resistance management strategies in Brazil. Environmental Entomology, vol. 44, no. 1, pp. 186-192. http://dx.doi.org/10.1093/ee/nvu018. PMid:26308821.
» http://dx.doi.org/10.1093/ee/nvu018 - SOURAKOV, A., 2015. You are what you eat: native versus exotic Crotalaria species (Fabaceae) as host plants of the Ornate Bella Moth, Utetheisa ornatrix (Lepidoptera: Erebidae: Arctiinae). Journal of Natural History, vol. 49, no. 39-40, pp. 2397-2415. http://dx.doi.org/10.1080/00222933.2015.1006700.
» http://dx.doi.org/10.1080/00222933.2015.1006700 - SPECHT, A. and CORSEUIL, E., 2002. Avaliação populacional de lagartas e inimigos naturais em azevém, com rede de varredura. Pesquisa Agropecuária Brasileira, vol. 37, no. 1, pp. 1-6. http://dx.doi.org/10.1590/S0100-204X2002000100001.
» http://dx.doi.org/10.1590/S0100-204X2002000100001 - SUJII, E.R., TIGANO, M.S. and SOSA-GOMES, D., 2002. Simulação do impacto do fungo Nomuraea rileyi em populações da lagarta da soja, Anticarsia gemmatalis. Pesquisa Agropecuária Brasileira , vol. 37, no. 11, pp. 1551-1558. http://dx.doi.org/10.1590/S0100-204X2002001100005.
» http://dx.doi.org/10.1590/S0100-204X2002001100005 - WALKER, D.R., ALL, J.N., MC PHERSON, R.M., BOERMA, H.R. and PARROTT, W.A., 2000. Field evaluation of soybean engineered with a synthetic cry1Ac transgene for resistance to corn earworm, soybean looper, velvetbean caterpillar (Lepidoptera: Noctuidae), and lesser cornstalk borer (Lepidoptera: Pyralidae). Journal of Economic Entomology, vol. 93, no. 3, pp. 613-622. http://dx.doi.org/10.1603/0022-0493-93.3.613. PMid:10902306.
» http://dx.doi.org/10.1603/0022-0493-93.3.613 - YANO, S.A., SPECHT, A., MOSCARDI, F., CARVALHO, R.A., DOURADO, P.M., MARTINELLI, S., HEAD, G.P. and SÓSA-GÓMEZ, D.R., 2016. High susceptibility and low resistance allele frequency of Chrysodeixis includens (Lepidoptera: Noctuidae) field populations to Cry1Ac in Brazil. Pest Management Science, vol. 72, no. 8, pp. 1578-1584. http://dx.doi.org/10.1002/ps.4191. PMid:26581167.
» http://dx.doi.org/10.1002/ps.4191 - ZUFFO, A.M., ZAMBIAZZI, E.V., GESTEIRA, G.A., REZENDE, P.M., BRUZI, A.T., SOARES, I.O., GWINNER, R. and BIANCHI, M.C., 2015. Agronomic performance of soybean according to stages of development and levels of defoliation. African Journal of Agricultural Research , vol. 10, no. 19, pp. 2089-2096. http://dx.doi.org/10.5897/AJAR2014.9369.
» http://dx.doi.org/10.5897/AJAR2014.9369
Publication Dates
-
Publication in this collection
10 July 2018 -
Date of issue
Apr-Jun 2019
History
-
Received
10 May 2017 -
Accepted
04 Oct 2017