SUMMARY
Biometric relationships are important to illustrate the growth of animals. When adjusted using nonlinear models, these relationships can provide important information that contributes to the improvement of breeding techniques. In this study, morphometric data as a function of weight obtained in four experiments involving bullfrog tadpoles were adjusted using Gompertz, Logistic, Von Bertalanffy and Brody nonlinear models and the best-fit model was determined. After fitting the parameters to the different models in each experiment, the models were compared based on confidence intervals (α = 0.05). The following criteria were used for selection of the best model: biological interpretation, residual mean square, coefficient of determination, graphic analysis, and number of iterations. Standard and total length data as a function of tadpole weight converged in the four models. The Logistic and Gompertz models had no biological interpretation for some datasets. The Brody model provided the lowest residual mean square and number of iterations for the variables studied in all experiments. The Brody relative growth rate (K) was lower for total length when compared to standard length, indicating a greater initial growth in standard length. The Brody model was the best to describe the growth in standard and total length of bullfrog tadpoles as a function of weight.
biometric relationship; frog farming; growth; length
RESUMO
As relações biométricas são importantes para ilustrar o processo de crescimento dos animais. Estas, quando ajustadas a modelos não-lineares, podem revelar informações importantes para a melhoria das técnicas de criação. O conjunto de dados morfométricos em função do peso, de quatro experimentos com girinos de rã-touro, foram ajustados aos modelos não-lineares de Gompertz, Logístico, Von Bertalanffy e Brody, com objetivo de verificar o melhor ajuste. Após a adequação dos parâmetros para os diferentes modelos em cada experimento seguiu-se com a comparação dos mesmos, por meio dos intervalos de confiança (α = 0,05). Os critérios para selecionar os modelos foram: interpretação biológica, quadrado médio do resíduo, coeficiente de determinação, análise gráfica e o número de iterações. Os dados de comprimentos padrão e total em função do peso dos girinos convergiram nos quatro modelos. Os modelos Logístico e Gompertz não apresentaram interpretação biológica para alguns conjuntos de dados. O quadrado médio do resíduo e número de iterações em todos os experimentos e variáveis estudadas apresentaram os menores valores para o modelo de Brody. Os valores de K dos modelos de Brody para comprimento total, quando comparados ao padrão, apresentaram-se menores, indicando que os animais apresentaram um crescimento inicial maior em comprimento padrão. O modelo de Brody foi o mais indicado para descrever o comprimento padrão e total em função do peso para girinos de rã-touro.
comprimento; crescimento; ranicultura; relações biométricas
INTRODUCTION
Bullfrogs have a complex life cycle which comprises two phases: aquatic and terrestrial. The aquatic stage consists of tadpoles that undergo a continuous process of morphophysiological changes over a short period of time (rapid growth) (WILBUR, 1980WILBUR, H.M. Complex life cicles. Annual Review of Ecology and Systematics, v.11, p.67-93, 1980.).
The body of tadpoles is divided into two parts. The head part comprises the body of the animal where all organs are found and the tail part mainly consists of muscles (ISHIZUYA-OKA et al., 2010ISHIZUYA-OKA, A.; HASEBE, T.; SHI, Y. 2010 Apoptosis in amphibian organs during metamorphosis. Apoptosis, v.15, p.350-364, 2010.). The latter is important for metamorphic climax and serves as a source of protein at the time of its absorption. One measure used to evaluate the growth of these parts is total length and standard length (ALTIG, 2007ALTIG, R. A primer for the morphology of Anuran tadpoles. Herpetological Conservation and Biology, v.2, p.71-74, 2007.).
A model is said non-linear when no linearity with respect to the parameters and cannot be linearized by transformation. In general, these models are designed to describe an asymptotic trajectory of the independent variable in function of the independent variable. Generally, the difference between these models is given by defining the inflection point of the curve, which confers a sigmoid shape the same (SILVEIRA et al., 2011SILVEIRA, F.G.; SILVA, F.F.; CARNEIRO, P.L.S.; MALHADO, C.H.M. Classificação multivariada de modelos de crescimento para grupos genéticos de ovinos de corte. Revista Brasileira de Saúde e Produção Animal [online], v.13, p.62-73, 2011.).
Fitting a nonlinear equation that describes the lifespan of an animal is more informative for the study of growth since it condenses a dataset into a small group of biologically interpretable parameters (TURNER JUNIOR et al., 1976TURNER JUNIOR, M.E.; BRADLEY JUNIOR, E.L.; KIRK, K.A.; PRUITT, K.M. A theory of growth. Mathematical Biosciences, v.26, p.367-337, 1976.). The Gompertz (WINSOR, 1932WINSOR, C.P. The Gompertz curve as a growth curve. Proceedings of the National Academy of Sciences of the United States of America, v.18, p.1-8, 1932.), Von Bertalanffy (1957)VON BERTALANFFY, L. Quantitative laws in metabolism and growth. The Quartely Review of Biology, v.32, p.217-230, 1957., Logistic (NELDER, 1961NELDER, J.A. The fitting of a generation of the logistic curve. Biometrics, v.17, p.89-110, 1961.) and Brody (1945)BRODY, S. Bioenergetics and growth: with special reference to the efficiency complex of domestic animals. New York: Hafner, 1945. 1023 p nonlinear models are commonly used to fit datasets in animal production, particularly weight (g) as a function of time (days) (FREITAS, 2005FREITAS, A.R. Curvas de crescimento na produção animal. Revista Brasileira de Zootecnia, v.34, p.786-795, 2005.; SARMENTO et al., 2006SARMENTO, L.J.; REGAZZI, A.J.; SOUZA, W.H.; TORRES, R.A.; BREDA, F.C; MENEZES, G.R.O. Analysis of the growth curve of Santa Ines sheep. Revista Brasileira de Zootecnia, v.35, p.435-442, 2006.; DUMAS et al., 2010DUMAS, A.; FRANCE, J.; BUREAU, D. Modelling growth and body composition in fish nutrition: where have we been and where are we going? Aquaculture Research, v.41, p.161-181, 2010.; KUHI et al., 2010KUHI, H.D.; PORTER, T.; LÓPEZ, S.; KEBREAB, E.; STRATHE, A.B.; DUMAS, A.; DIJKSTRA, J.; FRANCE, J. A review of mathematical functions for the analysis of growth in poultry. World's Poultry Science Journal, v.66, p.227-240, 2010.). For animal populations, extrinsic factors such as climatic conditions clearly influence this relationship (ÁLVAREZ and NICIEZA, 2002ÁLVAREZ, D.; NICIEZA, A.G. Effects of temperature and food quality on anuran larval growth and metamorphosis. Functional Ecology, v.16, p.640-648, 2002.; MACIEL and JUNCÁ, 2009MACIEL, T.A.; JUNCÁ, F.A. Effects and volume of water on the growth and development of tadpoles of Pleurodema diplolister and Rhinella granulosa (Amphibia: Anura). Zoologia, v.26, p.413-418, 2009.). In these cases, ecological models (GAMITO, 1998GAMITO, S. Growth models and their use in ecological modelling: an application to a fish population. Ecological Modelling, v.113, p.83-94, 1998.) are indicated since weight gain rigorously reflects growth and its relationship with other variables that replace the time variable, such as length, height and width, often rules out environmental variations (SANTOS et al., 2007SANTOS, V.B.; FREITAS, R.T.F.; SILVA, F.F.; FREATO, T.A. Avaliação de curvas de crescimento morfométrico de linhagens de tilápia do nilo (Oreochromis niloticus). Ciência e Agrotecnologia, v.31, p.1486-1492, 2007.; GOMIERO et al., 2009GOMIERO, J.S.G.; FREITAS, R.T.F.; SANTOS, V.B.; SILVA, F.F.; RODRIGUES, P.B.; LOGATO, P.V.R. Curvas de crescimento morfométrico de piracanjuba (Brycon orbignyanus). Ciência e Agrotecnologia, v.33, p.882-889, 2009.).
The objective of the present study was to describe the morphometric growth of bullfrog tadpoles as a function of weight until metamorphosis by fitting four nonlinear mathematical functions using data from four rearing experiments.
MATERIAL AND METHODS
The dataset used was obtained from four experiments conducted at the Centro de Aquicultura (Aquaculture Center), Universidade Estadual Paulista (São Paulo State University), Jaboticabal, São Paulo, Brazil. Experiments 1 and 2 were carried out at the Laboratory of Aquatic Organisms Nutrition and experiments 3 and 4 at the Raniculture Section using bullfrog tadpoles (Lithobates catesbeianus).
A total of 3,240 bullfrog tadpoles at stage 25 (GOSNER, 1960GOSNER, K.L. A simplified table for staging anuran embryos and larvae with notes on identification. Herpetologica, v.16, p.183-190, 1960.), obtained from the same spawn, with an initial mean weight of 0.044 ± 0.001g, mean total length of 12.79 ± 0.19mm and mean standard length of 5.86 ± 0.18mm, were used. The animals were housed in eighteen 100-L tanks filled with 90L of water and equipped with an individual supply pipe and a direct bottom outlet.
The tadpoles were fed ad libitum powder food containing 26.23% digestible protein and 3,743.07kcal/kg digestible energy, three times per day. Leftovers were avoided so that the amount of food offered was considered to be same as that consumed (SOLOMON & TARUWA, 2011SOLOMON, R.J.; TARUWA, S.M.. The growth comparison of two catfishes (C. Gariepinus and Heteroclarias). Nature and Science, v.9, p.138-148, 2011.).
Total length (snout to tip of tail), standard length (snout to insertion of tail) and live weight were obtained at the beginning of the experiment and at 13, 23, 33, 42, 55 and 64 days. The last day of the experiment was defined when 20% of the animals had reached metamorphic climax (stage 42 according to GOSNER, 1960GOSNER, K.L. A simplified table for staging anuran embryos and larvae with notes on identification. Herpetologica, v.16, p.183-190, 1960.), a time when tadpoles cease feeding and use only accumulated reserves (WRIGHT et al., 2011WRIGHT, M.L.; RICHARDSON, S.E.; BIGOS, J.M. The fat body of bullfrog (Lithobates catesbeianus) tadpoles during metamorphosis: chages in mass, histology and melatonin content and effect of food deprivation. Comparative Biochemistry and Physiology part A, v.160, p.498-503, 2011.). A sample of 10% of the animals of each tank was weighed on a digital scale (0.01g) and length measurements were obtained with a digital caliper (0.001mm).
The method used was the same as that described for Experiment 1, except that the animals were fed commercial ration containing 37.92% crude protein and 4,156.34kcal/kg crude energy.
A total of 2,700 bullfrog tadpoles at stage 25 (GOSNER, 1960GOSNER, K.L. A simplified table for staging anuran embryos and larvae with notes on identification. Herpetologica, v.16, p.183-190, 1960.), with an initial mean weight of 0.039 ± 0.001g, mean total length of 12.62 ± 0.08mm and mean standard length of 5.66 ± 0.17mm, were divided into six tanks outside (capacity of 500L). The animals were fed ad libitum a commercial powder diet ration containing 55% crude protein and 4,366.30kcal/kg crude energy.
Total and standard length and live weight were measured at the beginning of the experiment and at 12, 20, 29, 42, 54 and 63 days in 40 animals per chamber with a digital caliper (0.001mm) and a digital scale (0.01g), respectively.
A total of 2,700 bullfrog tadpoles at stage 25 (GOSNER, 1960GOSNER, K.L. A simplified table for staging anuran embryos and larvae with notes on identification. Herpetologica, v.16, p.183-190, 1960.) with an initial mean weight of 0.26 ± 0.02g, mean total length of 27.26 ± 0.25mm and mean standard length of 10.65 ± 0.28mm were used. The animals were divided into six tanks outside (capacity of 500L) and were fed ad libitum powder food containing 26.23% digestible protein and 3,743.07kcal/kg digestible energy, three times per day.
Total and standard length and live weight were measured at the beginning of the experiment and at 11, 22, 34, 45 and 55 days in 40 animals per tank with a digital caliper (0.001mm) and a digital scale (0.01g), respectively.
The water used in the experiments was obtained from a mine and 100% water changes were performed at intervals of 24h. For the maintenance of water quality, the tanks were cleaned on alternative days with a siphon to remove uneaten food and feces.
The maximum and minimum temperatures of the water in the tanks were determined daily with a digital thermometer. Dissolved oxygen (YSI oxygen meter), conductivity (handheld PHTEK device) and pH (handheld PHTEK pH monitor, model pH-100) were measured weekly. These parameters were obtained in all experiments. The mean maximum and minimum water temperatures were 26.0 and 24.2°C during experiments 1 and 2, and 31.4 and 27.8°C during experiments 3 and 4, respectively. The water temperature in outside tanks was higher, but was adequate for tadpole development (HOFFMANN et al., 1989HOFFMANN, D.F.; LEBOUTE, E.M.; SOUZA, S.M.G. Efeito da temperatura no desempenho de girinos de rã-touro (Rana catesbeiana Shaw, 1892). Revista Brasileira de Zootecnia, v.18, p.557-566, 1989.). The mean dissolved oxygen (3.07 ± 0.92mg/L), electrical conductivity (38 ± 0.26μS/cm) and pH (6.17 ± 0.34) were adequate for frog farming (HAYASHI et al., 2004HAYASHI, C.; SOARES, C.M.; GALDIOLI, E.M.; FURUYA, V.R.B.; BOSCOLO, W.R. Desenvolvimento de girinos de rã-touro (Rana catesbeiana Shaw, 1802) cultivados em diferentes densidades de estocagem em tanque-rede. Revista Brasileira de Zootecnia, v.33, p.14-20, 2004.; HAILEY et al., 2006HAILEY, A.; SOOKOO, N.; MOHAMMED, A.; KHAN, A. Factors affecting tadpole growth: Development of a rearing system for the Neotropical leptodactylid Physalaemus pustulosus for ecotoxicological studies. Applied Herpetology, v.3, p.111-128, 2006.).
The following nonlinear functions were adopted to model standard and total length growth as a function of weight in tadpoles: Gompertz, Y = A exp (-B exp (-K w)); Von Bertalanffy, Y = A (1 - B exp (-K w))3; logistic, Y = A (1+ B exp (-K w))-1, and Brody, Y = A (1 - B exp (-K w)), where Y = value of the measurement (cm); w = weight (g); A = total or standard length (cm) at metamorphosis; B = scale parameter without biological interpretation, and K = relative growth rate at metamorphosis. The model parameters were estimated by the modified Gauss-Newton method through nonlinear regression using the NLIN procedure of the SAS program (2001).
The following criteria were used for selection of the best model and description of the growth curve as a function of weight: biological interpretation of the parameters, residual mean square (RMS), graphic analysis of the models, and Akaike information criterion (AIC) (AKAIKE, 1974AKAIKE, H. A new look at the statistical model identification. IEEE Transactions on Automatic Control, v.19, p.716-723, 1974.). In addition, the coefficient of determination (R2) was calculated as the square of the correlation between observed and estimated weights, which corresponds to 1 – (RSS-TSS), where RSS is the residual sum of squares and TSS is the total sum of squares corrected for the mean (SOUZA, 1998SOUZA, G.S. Introdução aos modelos de regressão linear e não-linear. Brasília: Serviço de Produção de Informação, 1998. 505p.).
RESULTS AND DISCUSSION
The total and standard length data as a function of tadpole weight converged in the four nonlinear models adopted.
The estimated A values were similar in three of the four experiments and for the two length variables. In the fourth experiment, the highest A value was estimated with the Brody model and was 104.1 cm for total length and 32.424cm for standard length. The K values estimated with the Brody model were the lowest in all experiments and for the two lengths studied (Tables 1 and 2).
The Brody model provided the lowest RMS and the smallest number of iterations of the variables studied in all experiments, indicating the best fit. The R2 found was high and similar for all models (Table 1).
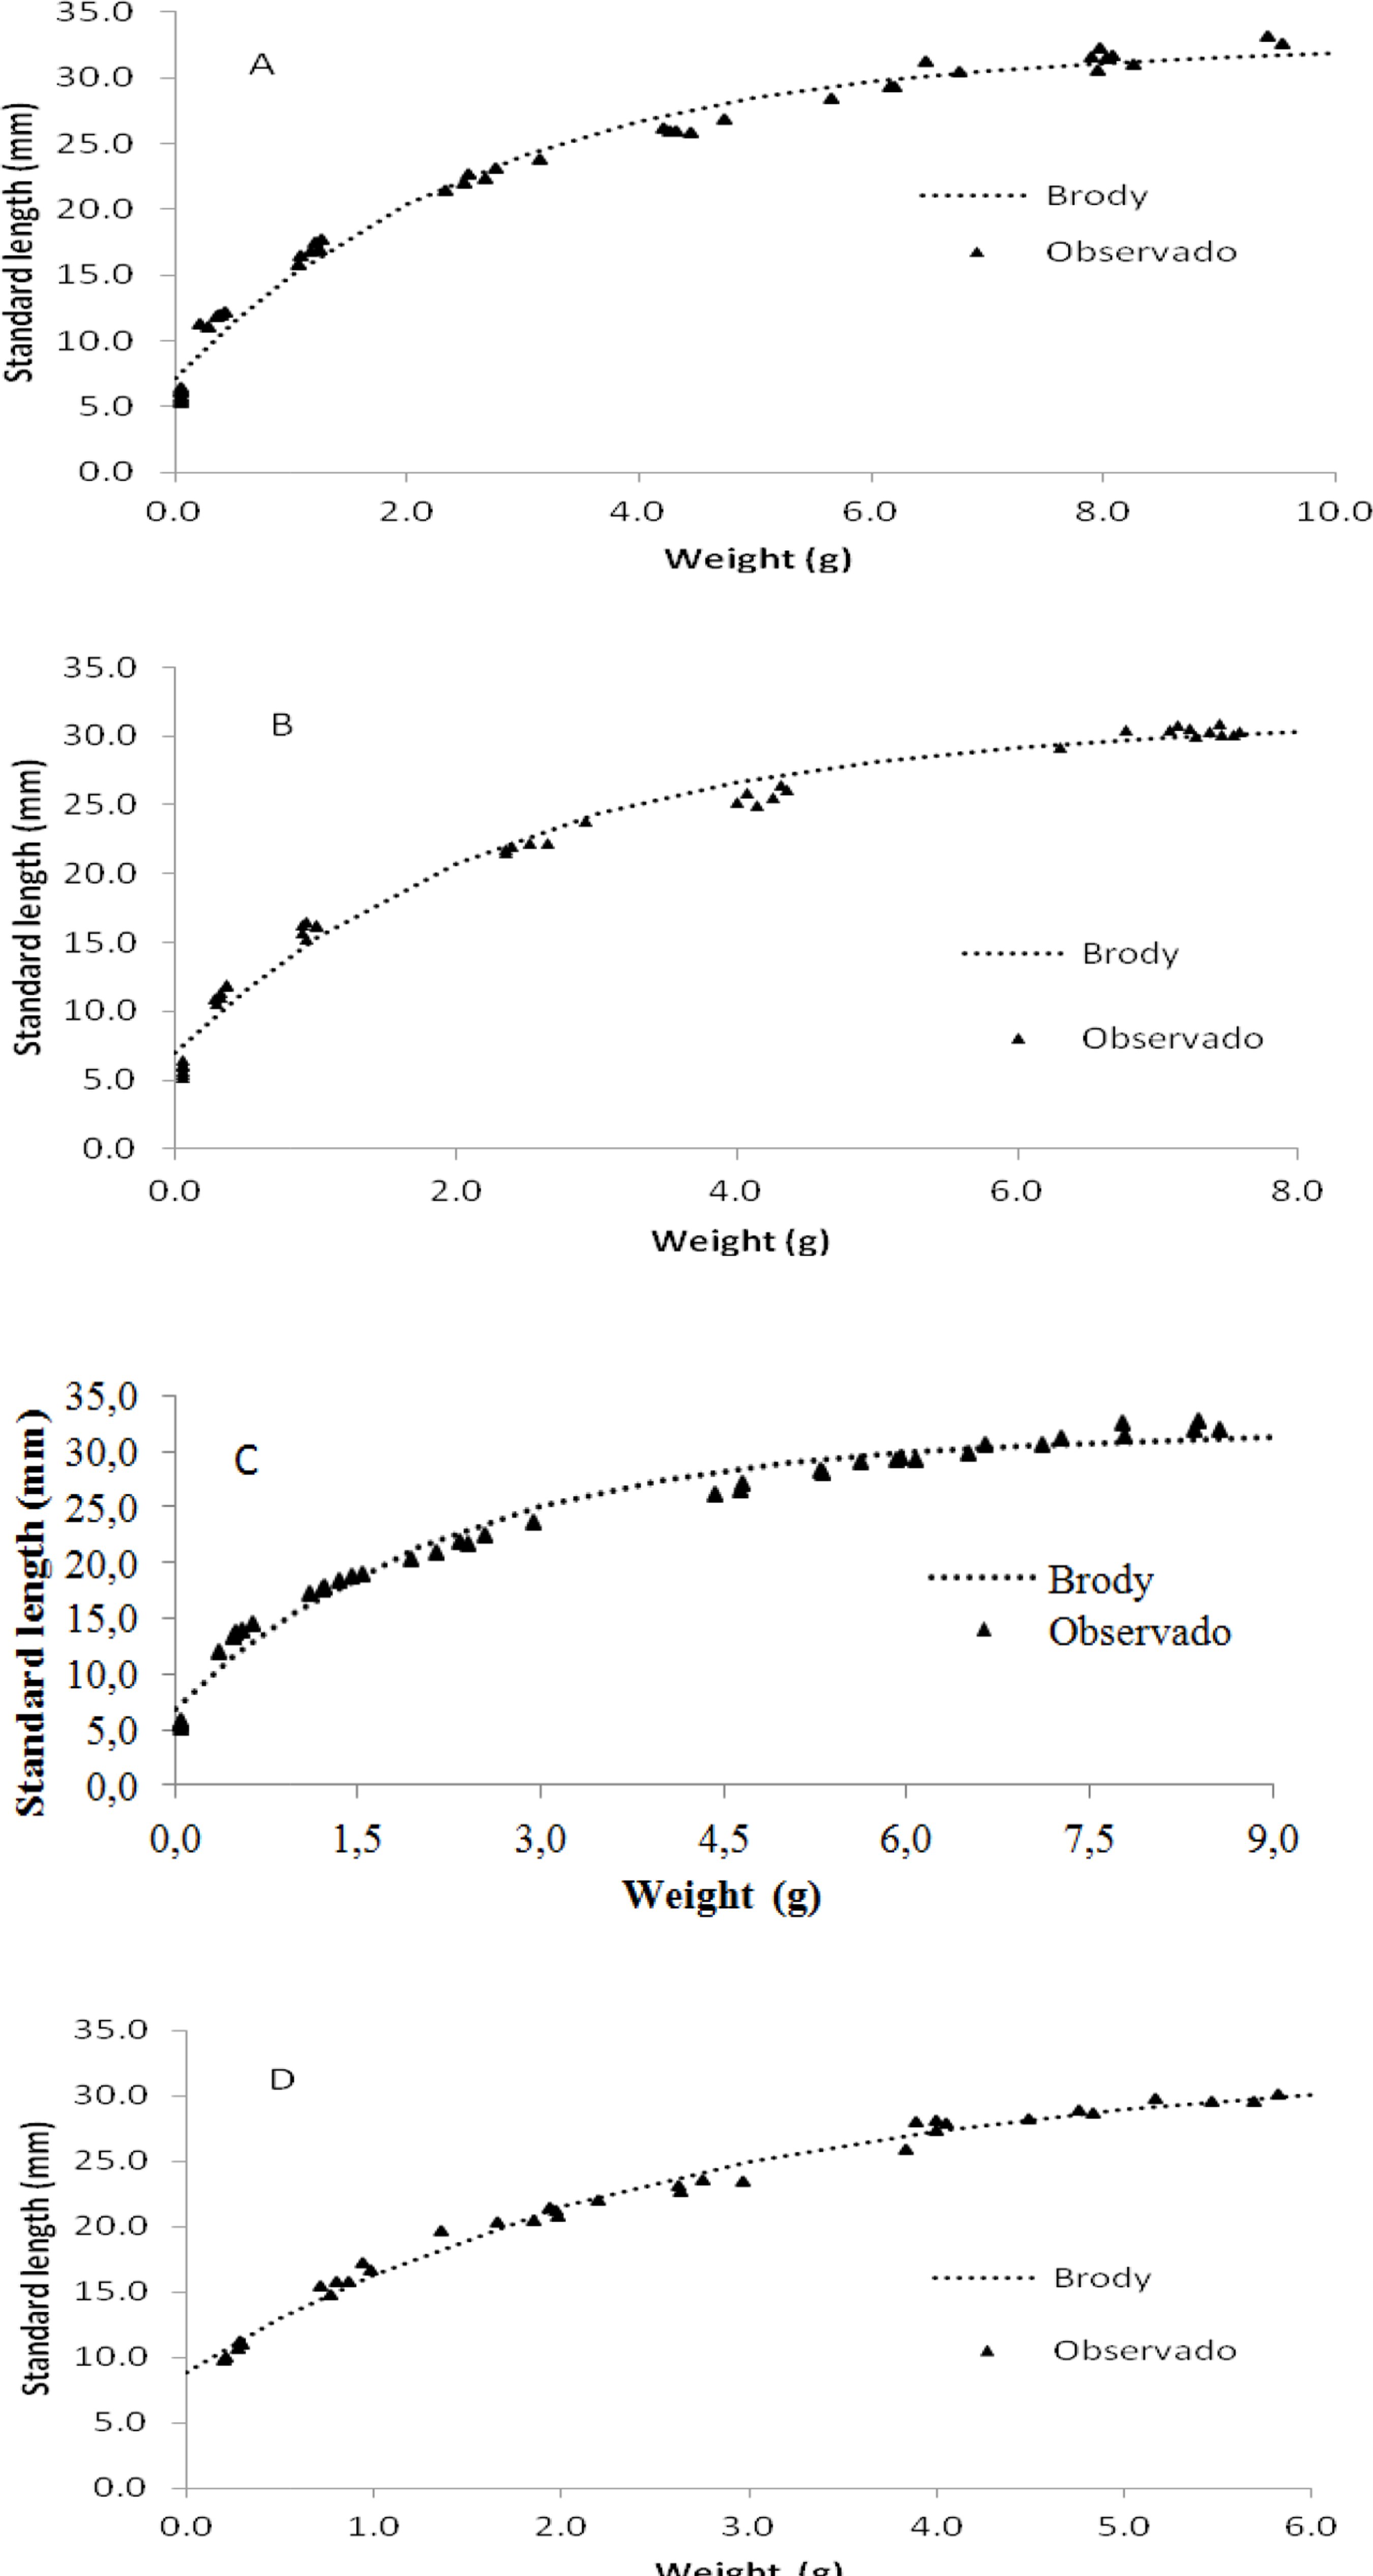
Graphical representation of the Brody model showed that the estimated values were close to the observed values for total length (Figure 1) and standard length (Figure 2) as a function of weight in the four experiments.
Brody growth curves of total length as a function of weight obtained for bullfrog tadpoles. Experiment 1 (A), experiment 2 (B), experiment 3 (C), and experiment 4 (D)
Brody growth curves of standard length as a function of weight obtained for bullfrog tadpoles. Experiment 1 (A), experiment 2 (B), experiment 3 (C), and experiment 4 (D)
The Brody model was chosen to describe the morphometric relationships in bullfrog tadpoles since this model converged to the data, provided biological interpretation, and presented the lowest RMS and Akaike information criterion (AIC).
Values of four experiments were used, important to increase the reliability and choice of nonlinear model. The Logistic, Von Bertalanffy and Gompertz models underestimated the A values in experiments 1, 2 and 3 when describing morphometric growth as a function of weight. The same was observed for a Logistic model used to describe the growth in length of piracanjuba, Brycon orbignyanus (GOMIERO et al., 2009GOMIERO, J.S.G.; FREITAS, R.T.F.; SANTOS, V.B.; SILVA, F.F.; RODRIGUES, P.B.; LOGATO, P.V.R. Curvas de crescimento morfométrico de piracanjuba (Brycon orbignyanus). Ciência e Agrotecnologia, v.33, p.882-889, 2009.).
This tendency is related to the performance of models for these datasets. The Brody, Von Bertalanffy, Logistic and Gompertz models were found to adequately describe the morphometric growth of Nile tilapia as a function of body weight, with the Gompertz and Von Bertalanffy models being the most indicated (SANTOS et al., 2007SANTOS, V.B.; FREITAS, R.T.F.; SILVA, F.F.; FREATO, T.A. Avaliação de curvas de crescimento morfométrico de linhagens de tilápia do nilo (Oreochromis niloticus). Ciência e Agrotecnologia, v.31, p.1486-1492, 2007.). For piracanjuba, the best models were the Brody and Von Bertalanffy models (GOMIERO et al., 2009GOMIERO, J.S.G.; FREITAS, R.T.F.; SANTOS, V.B.; SILVA, F.F.; RODRIGUES, P.B.; LOGATO, P.V.R. Curvas de crescimento morfométrico de piracanjuba (Brycon orbignyanus). Ciência e Agrotecnologia, v.33, p.882-889, 2009.). Taken together, these findings suggest that each species possesses specific growth characteristics that lead to different results.
In some cases, the Brody model was not adequate to describe the growth of domestic animal species such as sheep (SILVEIRA et al., 2011SILVEIRA, F.G.; SILVA, F.F.; CARNEIRO, P.L.S.; MALHADO, C.H.M. Classificação multivariada de modelos de crescimento para grupos genéticos de ovinos de corte. Revista Brasileira de Saúde e Produção Animal [online], v.13, p.62-73, 2011.), Guzerá cows (OLIVEIRA et al., 2000OLIVEIRA, H.N.; LÔBO, R.B.; PEREIRA, C.S. Comparação de modelos não-lineares para descrever o crescimento de fêmeas da raça guzerá. Pesquisa Agropecuária Brasileira, v.35, p.1843-1851, 2000.), or lamb (GUEDES et al., 2004GUEDES, M.H.P.; MUNIZ, J.A.; PEREZ, J.R.O.; SILVA, F.F.; AQUINO, L.H.; SANTOS, C.L. Estudo das curvas de crescimento de cordeiros das raças Santa Inês e Bergamácia considerando heterogeneidade de variância. Ciência e Agrotecnologia, v.28, p.381-388, 2004.). However, this model was found to be adequate for beef cows of different biological types (SILVA et al., 2011SILVA, F.L.; ALENCAR, M.M.; FREITAS, A.R.; PACKE, I.U.; MOURÃO, G.B. Growth curves in beef cows of different biological types. Pesquisa Agropecuária Brasileira, v.46, p.262-271, 2011.), Salvelinus alpinus fish (LOEWEN et al., 2010LOEWEN, T.N.; GILLIS, D.; TALLMAN, R.F. Maturation, growth and fecundity of Arctic charr, Salvelinus alpinus (L.), life-history variants co-existing in lake systems of Southern Baffin Island, Nunavut, Canada. Hydrobiologia, v.650, p.193-202, 2010.), and Panopea generosa mollusks (CALDERON-AGUILERA et al., 2010CALDERON-AGUILERA, L.E.; ARAGÓN-NORIEGA, E.A.; HAND, C.M.; MORENO-RIVERA, V.M. Morphometric relationships, age, growth, and mortality of the geoduck clam, Panopea generosa, along the pacific coast of baja california, Mexico. Journal of Shellfish Research, v.29, p.319-326, 2010.). These results show that a given model may or may not be adequate to fit a dataset and this type of study is therefore always necessary for different farm species.
The K values of the Brody model were lower for total length as a function of weight when compared to standard length as a function of weight in all experiments, indicating a greater initial growth in standard length, i.e., the head and organs (corresponding to standard length) develop first, followed by growth of the tail, muscle tissue and reserves for consumption during metamorphosis (MANSANO et al., 2014MANSANO, C.F.M.; STÉFANI, M.V.; PEREIRA, M.M.; NAASCIMENTO, T.S.R.; MACENTE, B.I. Morphometric growth characteristics and body composition of bullfrog tadpoles in captivity. Semina, v.35, p.1425–1438, 2014.). Different K values (relative growth rate at maturity) for different parts of the body have also been reported for Nile tilapia (SANTOS et al., 2007SANTOS, V.B.; FREITAS, R.T.F.; SILVA, F.F.; FREATO, T.A. Avaliação de curvas de crescimento morfométrico de linhagens de tilápia do nilo (Oreochromis niloticus). Ciência e Agrotecnologia, v.31, p.1486-1492, 2007.) and piracanjuba (GOMIERO et al., 2009GOMIERO, J.S.G.; FREITAS, R.T.F.; SANTOS, V.B.; SILVA, F.F.; RODRIGUES, P.B.; LOGATO, P.V.R. Curvas de crescimento morfométrico de piracanjuba (Brycon orbignyanus). Ciência e Agrotecnologia, v.33, p.882-889, 2009.), demonstrating heterogenous growth.
The Brody model is the best to describe the growth in standard and total length of bullfrog tadpoles as a function of weight.
ACKNOWLEDGEMENTS
We thank the state funding agency Fundação de Amparo à Pesquisa do Estado de São Paulo (FAPESP) for financial support, and the technician Márcio Roberto Reche for help with the experiments.
REFERENCES
- AKAIKE, H. A new look at the statistical model identification. IEEE Transactions on Automatic Control, v.19, p.716-723, 1974.
- ALTIG, R. A primer for the morphology of Anuran tadpoles. Herpetological Conservation and Biology, v.2, p.71-74, 2007.
- ÁLVAREZ, D.; NICIEZA, A.G. Effects of temperature and food quality on anuran larval growth and metamorphosis. Functional Ecology, v.16, p.640-648, 2002.
- BRODY, S. Bioenergetics and growth: with special reference to the efficiency complex of domestic animals New York: Hafner, 1945. 1023 p
- CALDERON-AGUILERA, L.E.; ARAGÓN-NORIEGA, E.A.; HAND, C.M.; MORENO-RIVERA, V.M. Morphometric relationships, age, growth, and mortality of the geoduck clam, Panopea generosa, along the pacific coast of baja california, Mexico. Journal of Shellfish Research, v.29, p.319-326, 2010.
- DUMAS, A.; FRANCE, J.; BUREAU, D. Modelling growth and body composition in fish nutrition: where have we been and where are we going? Aquaculture Research, v.41, p.161-181, 2010.
- FREITAS, A.R. Curvas de crescimento na produção animal. Revista Brasileira de Zootecnia, v.34, p.786-795, 2005.
- GAMITO, S. Growth models and their use in ecological modelling: an application to a fish population. Ecological Modelling, v.113, p.83-94, 1998.
- GOMIERO, J.S.G.; FREITAS, R.T.F.; SANTOS, V.B.; SILVA, F.F.; RODRIGUES, P.B.; LOGATO, P.V.R. Curvas de crescimento morfométrico de piracanjuba (Brycon orbignyanus) Ciência e Agrotecnologia, v.33, p.882-889, 2009.
- GOSNER, K.L. A simplified table for staging anuran embryos and larvae with notes on identification. Herpetologica, v.16, p.183-190, 1960.
- GUEDES, M.H.P.; MUNIZ, J.A.; PEREZ, J.R.O.; SILVA, F.F.; AQUINO, L.H.; SANTOS, C.L. Estudo das curvas de crescimento de cordeiros das raças Santa Inês e Bergamácia considerando heterogeneidade de variância. Ciência e Agrotecnologia, v.28, p.381-388, 2004.
- HAILEY, A.; SOOKOO, N.; MOHAMMED, A.; KHAN, A. Factors affecting tadpole growth: Development of a rearing system for the Neotropical leptodactylid Physalaemus pustulosus for ecotoxicological studies. Applied Herpetology, v.3, p.111-128, 2006.
- HAYASHI, C.; SOARES, C.M.; GALDIOLI, E.M.; FURUYA, V.R.B.; BOSCOLO, W.R. Desenvolvimento de girinos de rã-touro (Rana catesbeiana Shaw, 1802) cultivados em diferentes densidades de estocagem em tanque-rede. Revista Brasileira de Zootecnia, v.33, p.14-20, 2004.
- HOFFMANN, D.F.; LEBOUTE, E.M.; SOUZA, S.M.G. Efeito da temperatura no desempenho de girinos de rã-touro (Rana catesbeiana Shaw, 1892). Revista Brasileira de Zootecnia, v.18, p.557-566, 1989.
- ISHIZUYA-OKA, A.; HASEBE, T.; SHI, Y. 2010 Apoptosis in amphibian organs during metamorphosis. Apoptosis, v.15, p.350-364, 2010.
- KUHI, H.D.; PORTER, T.; LÓPEZ, S.; KEBREAB, E.; STRATHE, A.B.; DUMAS, A.; DIJKSTRA, J.; FRANCE, J. A review of mathematical functions for the analysis of growth in poultry. World's Poultry Science Journal, v.66, p.227-240, 2010.
- LOEWEN, T.N.; GILLIS, D.; TALLMAN, R.F. Maturation, growth and fecundity of Arctic charr, Salvelinus alpinus (L.), life-history variants co-existing in lake systems of Southern Baffin Island, Nunavut, Canada. Hydrobiologia, v.650, p.193-202, 2010.
- MACIEL, T.A.; JUNCÁ, F.A. Effects and volume of water on the growth and development of tadpoles of Pleurodema diplolister and Rhinella granulosa (Amphibia: Anura). Zoologia, v.26, p.413-418, 2009.
- MANSANO, C.F.M.; STÉFANI, M.V.; PEREIRA, M.M.; NAASCIMENTO, T.S.R.; MACENTE, B.I. Morphometric growth characteristics and body composition of bullfrog tadpoles in captivity. Semina, v.35, p.1425–1438, 2014.
- NELDER, J.A. The fitting of a generation of the logistic curve. Biometrics, v.17, p.89-110, 1961.
- OLIVEIRA, H.N.; LÔBO, R.B.; PEREIRA, C.S. Comparação de modelos não-lineares para descrever o crescimento de fêmeas da raça guzerá. Pesquisa Agropecuária Brasileira, v.35, p.1843-1851, 2000.
- SANTOS, V.B.; FREITAS, R.T.F.; SILVA, F.F.; FREATO, T.A. Avaliação de curvas de crescimento morfométrico de linhagens de tilápia do nilo (Oreochromis niloticus). Ciência e Agrotecnologia, v.31, p.1486-1492, 2007.
- SARMENTO, L.J.; REGAZZI, A.J.; SOUZA, W.H.; TORRES, R.A.; BREDA, F.C; MENEZES, G.R.O. Analysis of the growth curve of Santa Ines sheep. Revista Brasileira de Zootecnia, v.35, p.435-442, 2006.
- SILVA, F.L.; ALENCAR, M.M.; FREITAS, A.R.; PACKE, I.U.; MOURÃO, G.B. Growth curves in beef cows of different biological types. Pesquisa Agropecuária Brasileira, v.46, p.262-271, 2011.
- SILVEIRA, F.G.; SILVA, F.F.; CARNEIRO, P.L.S.; MALHADO, C.H.M. Classificação multivariada de modelos de crescimento para grupos genéticos de ovinos de corte. Revista Brasileira de Saúde e Produção Animal [online], v.13, p.62-73, 2011.
- SOLOMON, R.J.; TARUWA, S.M.. The growth comparison of two catfishes (C. Gariepinus and Heteroclarias). Nature and Science, v.9, p.138-148, 2011.
- SOUZA, G.S. Introdução aos modelos de regressão linear e não-linear Brasília: Serviço de Produção de Informação, 1998. 505p.
- TURNER JUNIOR, M.E.; BRADLEY JUNIOR, E.L.; KIRK, K.A.; PRUITT, K.M. A theory of growth. Mathematical Biosciences, v.26, p.367-337, 1976.
- VON BERTALANFFY, L. Quantitative laws in metabolism and growth. The Quartely Review of Biology, v.32, p.217-230, 1957.
- WILBUR, H.M. Complex life cicles. Annual Review of Ecology and Systematics, v.11, p.67-93, 1980.
- WINSOR, C.P. The Gompertz curve as a growth curve. Proceedings of the National Academy of Sciences of the United States of America, v.18, p.1-8, 1932.
- WRIGHT, M.L.; RICHARDSON, S.E.; BIGOS, J.M. The fat body of bullfrog (Lithobates catesbeianus) tadpoles during metamorphosis: chages in mass, histology and melatonin content and effect of food deprivation. Comparative Biochemistry and Physiology part A, v.160, p.498-503, 2011.
Publication Dates
-
Publication in this collection
Apr-Jun 2016
History
-
Received
25 July 2014 -
Accepted
17 Mar 2016