SUMMARY
We aimed to evaluate the random regression models that promote the best fit of residual variance predicting the breeding values of quail body weights and the sensitivity of its breeding values to the variations of different tryptophan:lysine ratios in the diets via reaction norms. A total of 1112 meat quails from LF1 and LF2 lines with 35 days of age were evaluated. During the period of 1 to 21 days of age, birds were fed with different tryptophan:lysine ratios (0.17, 0.20, 0.23, 0.26 and 0.29%) containing 2900 kcal ME/kg and 26.10% crude protein, followed by basal diet provided up to 35 days. The best model fit for residual variance was evaluated comparing heterogeneity (2, 3 and 4 classes) and homogeneity (1 class), including sex as fixed effect and the additive genetic effect as random. The second order Legendre polynomial was used to analyze the genotype x environment interaction using reaction norms. The model considering two classes of residual variance was the one that promoted the best fit of the data, being adopted to predict the breeding values. Thus, we observed changes in the sensitivity of the breeding values, characterized by the rearrangement of the breeding values, according to the different ratios of amino acids, suggesting the genotype x environment interaction.
Keywords:
Coturnix coturnix; genotype x environment interaction; heterogeneity of variance; reaction norm; tryptophan
RESUMO
Objetivou-se avaliar o modelo de regressão aleatória que promove o melhor ajuste da variância residual para a predição dos valores genéticos dos pesos corporais de codornas de corte e a sensibilidade dos seus valores genéticos às variações de diferentes relações triptofano:lisina. Foram avaliadas 1112 codornas de corte das linhagens LF1 e LF2, do nascimento aos 35 dias de idade. No período de 1 a 21 dias de idade as aves receberam alimentação com dietas de diferentes relações triptofano:lisina (0,17, 0,20, 0,23, 0,26 e 0,29%), contendo 2900 kcal EM/kg e 26,10% de proteína bruta, seguido pelo fornecimento de ração basal até os 35 dias. Foi avaliado o ajuste da variância residual comparando a homogeneidade (1 classe) e a heterogeneidade (2, 3 e 4 classes) incluindo o sexo como efeito fixo e o efeito genético aditivo como aleatório. O polinômio de Legendre de segunda ordem foi utilizado para a análise da interação genótipo x ambiente utilizando normas de reação. O modelo que considerou duas classes de variância residual foi o que promoveu o melhor ajuste dos dados e foi adotado para predição dos valores genéticos. Desta forma, foi observada alteração na sensibilidade dos valores genéticos, caracterizados pelo reordenamento dos valores genéticos, em função das diferentes relações estudadas, indicando a presença de interação genótipo x ambiente.
Palavras-chave:
Coturnix coturnix; interação genótipo x ambiente; heterogeneidade de variância; normas de reação; triptofano
INTRODUCTION
More efficient feeding of animals requires adjustments of amino acids in the diet to meet the nutritional requirements and improve digestibility through the supplementation with commercial amino acids (SCHMIDT et al., 2011SCHMIDT, M.; GOMES, P.C.; ROSTAGNO, H.S.;ALBINO, L.F.T.; NUNES, R.V.; MELLO, H.H.C. Níveis nutricionais de metionina+cistina digestível para poedeiras leves no segundo ciclo de produção. Revista Brasileira de Zootecnia, v.40, n.1, p.142-147, 2011.). Tryptophan amino acid, for example, has a role on development and growth of animals, protein synthesis and some physiological processes (OLIVEIRA et al., 2010OLIVEIRA, W.P.;OLIVEIRA, R.F.M.; DONZELE, J.L.; GOMES, P.C.; MARTINS, M.S.; ASSIS, A.P. Redução do nível de proteína bruta em rações para frangos de corte em ambiente de estresse por calor. Revista Brasileira de Zootecnia, v.39, n.5, p.1092-1098, 2010.). This amino acid acts as a precursor of serotonin, which acts on the behavior and welfare of birds (Le FLOC'H et al., 2011LE FLOC’H, N.; OTTEN, W.; MERLOT, E. Tryptophan metabolism, from nutrition to potential therapeutic applications. Amino Acids, v.41, p.1195-1205, 2011.).
Some of the important factors to be considered in animal production are the relationships between food and animal. Changes in animal diets may promote different performance changes as a function of the genotype by environment interaction. This interaction lead to different breeding values as changes in the environmental gradient occur, contrasting from the expected breeding values based solely on pedigree results (FALCONER, 1989FALCONER, D.S. Introduction to quantitative genetics. Essex: Longman Scientific & Technical, 1989. 438p.).
The presence of genotype by environment interaction can be evaluated via reaction norm models, which relate the varying of breeding values due to the occurrence of changes in the environment (SILVA et al., 2014SILVA, F.F.; MULDER, H.A.; KNOL, E.F.; LOPES, M.S.; GUIMARÃES, S.E.F.; LOPES, P.S.; MATHUR, P.K.; VIANA, J.M.S.; BASTIAANSEN, J. W. M. Sire evaluation for total number born in pigs using a genomic reaction norms approach. Journal of Animal Science, v.92, p. 3825–3834, 2014.). The random regression models predict the breeding values used in reaction norms in order to evaluate the effect of environmental gradient, allowing to estimate the genetic variation of quantitative traits at any point at different scenarios (SANTOS et al., 2008SANTOS, G.G.; CORRÊA, G.S.S.; VALENTE, B.D.; SILVA, M.A.; CORRÊA, A.B.;FELIPE, V.P.S.; WENCESLAU, R.R. Sensibilidade de valores genéticos de codornas de corte em crescimento às modificações de níveis de proteína das dietas. Arquivo Brasileiro de Medicina Veterinária e Zootecnia, v.60, n.5, p.1188-1196, 2008.).
The objective of this study was to evaluate the random regression model that provides the best fit of the residual variance, and the genotype by environment interaction in two lines of meat quails from birth to 21 days of age as a function of the different tryptophan:lysine ratios in the diets via reaction norms.
MATERIAL AND METHODS
The study was performed in the quail production sector of the Animal Breeding Program of the Animal Science Department at the Universidade Federal dos Vales do Jequitinhonha e Mucuri (UFVJM), JK Campus, in agreement with the Ethics Committee on Animal Use of the UFVJM (CEUA), protocol number 027/2014.
A total of 1112 meat quails from two lines (LF1 and LF2) obtained by mating of 80 males and 160 females of each line were evaluated. At birth, quails wereidentified, weighed and randomly distributed in five treatments with different tryptophan:lysine ratios (0.17, 0.20, 0.23, 0.26 and 0.29%).
The quails were fed diets containing 26% of crude protein, 2900 kcal ME/kg and the tryptophan:lysine ratios. Diets were calculated based on digestible content of the amino acids in the ingredients, as proposed by Rostagno et al. (2011)ROSTAGNO, H.S. ALBINO, L.F.T.; DONZELE, J.L.; GOMES, P.C.; OLIVEIRA, R.F.; LOPES, D.C.; FERREIRA, A.S.; BARRETO, S.L.T.Tabelas brasileiras para aves e suínos: composição de alimentos e exigências nutricionais. Viçosa, MG: Universidade Federal de Viçosa, 2011., and on nutritional requirements as recommended by Silva & Costa (2009)SILVA, J.H.V.; COSTA, F. G. P. Tabela para codornas japonesas e europeias. 2.ed. Jaboticabal, SP: FUNEP, 2009. 110p..
From birth up to the 21st day of age, birds were kept in boxes of 5 m2 with wood bed, artificial heating by infrared lamps of 250 watts and water supply and feed ad libitum. At 22 days of age, quails were sexed. From 22 up to 35 days of age, animals weremovedto other boxes and fed basal diet with 22% crude protein, 3050 kcal ME/kg and tryptophan:lysine ratio of 0.17%.
Birds were individually weighted on 0.1g precision digital scales at 14, 21,28 and 35 days of age totalizing 2238 and 2033 recordings on LF1 on LF2, respectively. The kinship matrix had 1445 animals in LF1 and 1361 in LF2. Birds without identification of sex, father, mother or that had the observed value higher or lower than three standard deviations in relation to the mean of each evaluated trait were taken off from the database (Table 1).
We used the random regression methodology, under the animal model, including the fixed effect of sex, and direct additive genetic and residual effect as random. Both fixed and random effects were modeled as linear functions of second order Legendre orthogonal polynomials weighted by regression coefficients. The evaluation model for all traits was defined by:
where: yhij is the observation of animal h, sex j, fed diet with the tryptophan:lysine ratio i; bjk is the fixed regression coefficient related with Legendre polynomial k assigned to sex j; ahkis the random regression coefficient related with Legendre polynomial k of additive genetic effect attributed to animal h; xk(i) is the function of the Legendre polynomial k associated with the tryptophan:lysine i ratio; ehij is the residue associated with the observation yhij and this was the only effect not considered as a function of the tryptophan:lysine ratio of the diets.
The model in the matrix form was:
where: y is the vector of observations; b is the regression coefficients vector of fixed trajectory of each sex; a is the vector of random regression coefficients attributed to additive genetic effects; X and Z are incidence matrices of effects in b and a, containing Legendre polynomials relative to the value of the control variable adopted for the tryptophan lysine ratio; and e is the residue vector. Several studies working with the comparison of random models using residual variance observed similar performance among the main evaluation criteria (NEVES et al., 2012NEVES, H.H.R.; CARVALHEIRO, R.; QUEIROZ, S.A. Genetic and environmental heterogeneity of residual variance of weight traits in Nellore beef cattle. Genetics Selection Evolution, v.44.1, p.19, 2012., BIGNARDI et al., 2009BIGNARDI, A.B.; EL FARO, L.; CARDOSO, V.L.; MACHADO, P.F.; DE ALBUQUERQUE, L.G. Randomregressionmodelstoestimatetest-daymilkyieldgeneticparametersHolstein cows in Southeastern Brazil. Livestock Science, v.123, n.1, p.1-7, 2009., BREWER et al., 2016BREWER, M.J.; BUTLER, A.; COOKSLEY, S.L. The relative performance of AIC, AICC and BIC in the presence of unobserved heterogeneity. Methods in Ecology and Evolution, v.7, n.6 p.679-692, 2016.). Thus, the comparisons of homogeneous and heterogeneous models were performed via Bayesian Information Criterion (BIC), proposed by Schwarz (1978)SCHWARZ, G. Estimating the dimension of a models. The Annals of Statistics, v.6, n.2, p.461-464, 1978., for each file:
where p refers to the number of model parameters, N is the total number of observations, r is the rank of the incidence matrix for the fixed effects, and LogL is the logarithm of the likelihood function.
Classes of residual variance were considered according to the tryptophan:lysine ratios as: Class 1: homogeneous residual variance (0.17 to 0.29); Class 2: heterogeneous variances in two classes (0.17 to 0.23 and 0.24 to 0.29); Class 3: heterogeneous variances in three classes (0.17 to 0.20, 0.21 to 0.26 and 0.27 to 0.29); Class 4: heterogeneous variances in four classes (0.17 to 0.20, 0.21 to 0.23, 0.24 to 0.26 and 0.27 to 0.29). Assuming that:
where: and are components of variance attributed to the random regression constant of the intercept (b0) and the linear regression coefficient (b1) of the direct additive genetic effect, is the covariance component between the random regression coefficients (b0 and b1) of the direct additive genetic effect, is the residual variance component, A is the numerator matrix of the Wright coefficient, G is the matrix of additive genetic covariance, ϕ is the Legendre polynomial, In is the identity matrix, and (n) is the number of observations.
To obtain the additive genetic covariance between the tryptophan:lysine i and j ratio, the following formula was used:
where: Zi = [ϕ0(i)ϕ1(i)]; e Zj = [ϕ0(j)ϕ1(j)]
The heritability was estimated as a function of tryptophan:lysine:
where: i represents the tryptophan lysine ratio of the diet, j refers to the residue class that this ratio is part of and d refers to direct heritability.
The covariance components assigned to each random effect were estimated using the Maximum Restricted Likelihood (REML) methodology from WOMBAT program (MEYER, 2006MEYER, K. “WOMBAT” – Digging deep for quantitative genetic analyses by restricted maximum likelihood. In: WORLD CONGRESS OF GENETICS APPLIED TO LIVESTOCK PRODUCTION, 8, 2006, Belo Horizonte. Proceedings… Belo Horizonte, 2006.).
Covariance functions were used to estimate the structure of additive genetic covariance and direct heritability according to the tryptophan lysine ratios in the diets. Twenty-five quails from each line were randomly sampled for each trait according to the tryptophan lysine ratios in the diets aiming to demonstrate the behavior of breeding values observed in the reaction norms.
RESULTS AND DISCUSSION
Models with different classes of residual variance were compared based on BIC value (as lower is the BIC values, better is the model fit) according to Burnham and Anderson, (2004)BURNHAM, K.P.; ANDERSON, D.R. Multimodel inference: understanding AIC and BIC in model selection. Sociological Methods & Research, v.33, p.261-304, 2004.. Thus, the model assuming two classes of heterogeneous residual variance was the one that promoted a more adequate adjustment, in most of the evaluated ages, in both lines (Table 2).
Our results corroborate with the literature, which suggests the need to use residual variance heterogeneity, in terms that it promotes a better fit of residual variance while compared to the homogeneous variance (FARIA et al., 2017FARIA, G.Q.; BONAFÉ, C.M.; SOUZA, K.A.R.; SILVA, M.A.; COSTA, L.S.; LIMA, H.J.D.; CAMPOS, F.G.; SILVA, R.B.; SILVA, A.A.; TAROCÔ, G.; ROCHA, G.M.F.; MIRANDA, J.A. Estimação de valores genéticos para codornas europeias em função dos níveis da relação treonina: lisina da dieta: do nascimento aos 21 dias de idade. Arquivo Brasileiro de Medicina Veterinária e Zootecnia, v.69, p. 214-224, 2017.; TEIXEIRA et al., 2012TEIXEIRA, B.B. EUCLYDES, R.F.; TEIXEIRA, R.B.; SILVA, L.P.; TORRES, R.A.; LEHNER, H.G.; CAETANO, G.C.; CRISPIM, A.C. Modelos de regressão aleatória para avaliação da curva de crescimento em matrizes de codorna de corte. Ciência Rural, v.42, n.9, p.1641-1647, 2012.; GONÇALVES et al. 2012GONÇALVES, F.M.; PIRES, A.V.; PEREIRA, I.G.; DRUMOND, E.S.C.; FELIPE, V.P.S.; PINHEIRO, S.R.F. Genetic Evaluation of European quails by random regression models. Revista Brasileira de Zootecnia, v.41, n.9, p.2005-2011, 2012.; BONAFE et al., 2011BONAFÉ, C.M.; TORRES,R.A.; TEIXEIRA,R.B.; SILVA, F.G.; SOUSA,M.F.; LEITE, C.D.S.; SILVA,L. P.; CAETANO, G.C. Heterogeneidade de variância residual em modelos de regressão aleatória na descrição do crescimento de codornas de corte. Revista Brasileira de Zootecnia, v.40, n.10, p.2129-2134, 2011.). Evaluating carcass traits of meat quails, Miranda et al. (2016)MIRANDA, J.A;PIRES, A.V.; ABREU, L.R.A.; MOTA, L.F.; SILVA, M.A.; BONAFÉ, C.M.; LIMA, H.J.D.; MARTINS, P.G.M.A. Sensitivity of breeding values for carcass traits of meat-type quail to changes in dietary (methionine + cystine): lysine ration using reaction norm models. Journal of Animal Breeding Genetics, n.133, p.463–475, 2016. also observed that the random regression models considering residual variance heterogeneity promoted better adjustment than the models that used homogeneous residual variance, as observed in this study.
The adjustment of the residual variance heterogeneity depends on the structure of the trait and population. These factors may contribute to the fact that several authors observed better adjustments of the models for body weights of meat quails with different numbers of classes, 3 (TEIXEIRA et al., 2012TEIXEIRA, B.B. EUCLYDES, R.F.; TEIXEIRA, R.B.; SILVA, L.P.; TORRES, R.A.; LEHNER, H.G.; CAETANO, G.C.; CRISPIM, A.C. Modelos de regressão aleatória para avaliação da curva de crescimento em matrizes de codorna de corte. Ciência Rural, v.42, n.9, p.1641-1647, 2012.), 5 (BONAFÉ et al., 2011BONAFÉ, C.M.; TORRES,R.A.; TEIXEIRA,R.B.; SILVA, F.G.; SOUSA,M.F.; LEITE, C.D.S.; SILVA,L. P.; CAETANO, G.C. Heterogeneidade de variância residual em modelos de regressão aleatória na descrição do crescimento de codornas de corte. Revista Brasileira de Zootecnia, v.40, n.10, p.2129-2134, 2011.) and 6 (GONÇALVES et al., 2012GONÇALVES, F.M.; PIRES, A.V.; PEREIRA, I.G.; DRUMOND, E.S.C.; FELIPE, V.P.S.; PINHEIRO, S.R.F. Genetic Evaluation of European quails by random regression models. Revista Brasileira de Zootecnia, v.41, n.9, p.2005-2011, 2012.). While evaluating and comparing four classes of heterogeneous variances to predict breeding values for body weights of quail, Miranda et al. (2016)MIRANDA, J.A;PIRES, A.V.; ABREU, L.R.A.; MOTA, L.F.; SILVA, M.A.; BONAFÉ, C.M.; LIMA, H.J.D.; MARTINS, P.G.M.A. Sensitivity of breeding values for carcass traits of meat-type quail to changes in dietary (methionine + cystine): lysine ration using reaction norm models. Journal of Animal Breeding Genetics, n.133, p.463–475, 2016. observed that the model with two classes of residual variance promoted the best fit, corroborating this study, in which most of the traits presented the best fit also considering two classes of heterogeneous residual variance.
Once observed that the model assuming two classes of heterogeneous residual variance promoted a more adequate adjustment, the genetic parameters were estimated. Thus, it was observed that estimates of the genetic correlations of tryptophan:lysine ratios varied in both lines and ages (Table 3).
Genetic correlations estimates for body weights of meat quails of LF1 (above diagonal) and LF2 (below diagonal)
According to Robertson (1959)ROBERTSON, A. The sampling variance of genetic correlation coefficient. Biometric, v.15, n.3, p.469-485, 1959., when the genetic correlation between measured traits in two environments is greater than or equal to 0.8, it is considered that there is no genotypeby environment interaction, otherwise, the interaction is evidenced. In this study, genetic correlations valueshad a great difference between them, and might have been caused by the amplitude of body weights in each evaluated age.
Genetic correlations between tryptophan levels for initial weighting were higher than those observed at final weighting and slaughtering. These results may be explained by the large weight gain during the first days of life, promoted by the increase of tryptophan in the diets (Table 4). Bonafé et al. (2011)BONAFÉ, C.M.; TORRES,R.A.; TEIXEIRA,R.B.; SILVA, F.G.; SOUSA,M.F.; LEITE, C.D.S.; SILVA,L. P.; CAETANO, G.C. Heterogeneidade de variância residual em modelos de regressão aleatória na descrição do crescimento de codornas de corte. Revista Brasileira de Zootecnia, v.40, n.10, p.2129-2134, 2011. and Miranda et al. (2016)MIRANDA, J.A;PIRES, A.V.; ABREU, L.R.A.; MOTA, L.F.; SILVA, M.A.; BONAFÉ, C.M.; LIMA, H.J.D.; MARTINS, P.G.M.A. Sensitivity of breeding values for carcass traits of meat-type quail to changes in dietary (methionine + cystine): lysine ration using reaction norm models. Journal of Animal Breeding Genetics, n.133, p.463–475, 2016., studying amino acid ratios for meat quails, observed the presence of interaction between the genotypes and the evaluated environments (amino acid ratios).
Variations attributed to the regression constant - intercept () and the linear regression coefficient () of the direct additive genetic effect, covariance () and correlation () between the intercept and linear coefficient, and residual variance (), estimated for body weights of lines LF1 and LF2 of meat quails
According to Table 4, correlations between the coefficients b0 and b1 were high and positive for P14 in both lines and for P28 in LF2. On the other hand, they were negative for P21 and P28 in LF1, and the same was observed in LF2 for P21 and P35. Positive correlations between the intercept and linear regression coefficients () indicate that the higher the value of the intercept, the greater the slope on the line that describes the sensitivity of the breeding values (FALCONER, 1989FALCONER, D.S. Introduction to quantitative genetics. Essex: Longman Scientific & Technical, 1989. 438p.). Negative values for these correlations mean that birds will respond negatively to increased tryptophan:lysine ratios in the diet.
Heritability is the ratio between estimated values of additive genetic and phenotypic variance, in which values above 0.4 indicate high heritability and show that a large part of the observed phenotypic variation originates from the additive effect of the genes. On the other hand, the low estimates of heritability suggest that the expression of a trait is strongly influenced by the environment (FALCONER, 1989FALCONER, D.S. Introduction to quantitative genetics. Essex: Longman Scientific & Technical, 1989. 438p.). In this study, a change in the magnitude of estimated heritabilities according to the variation of tryptophan:lysine levels was observed and presented different results among LF1 and LF2 lines (Figure 1).
Estimation of heritability (h2) and additive genetic variance (Va) of LF1 and LF2 body weights at 14, 21, 28 and 35 days of age, according to tryptophan:lysine ratios in the diet
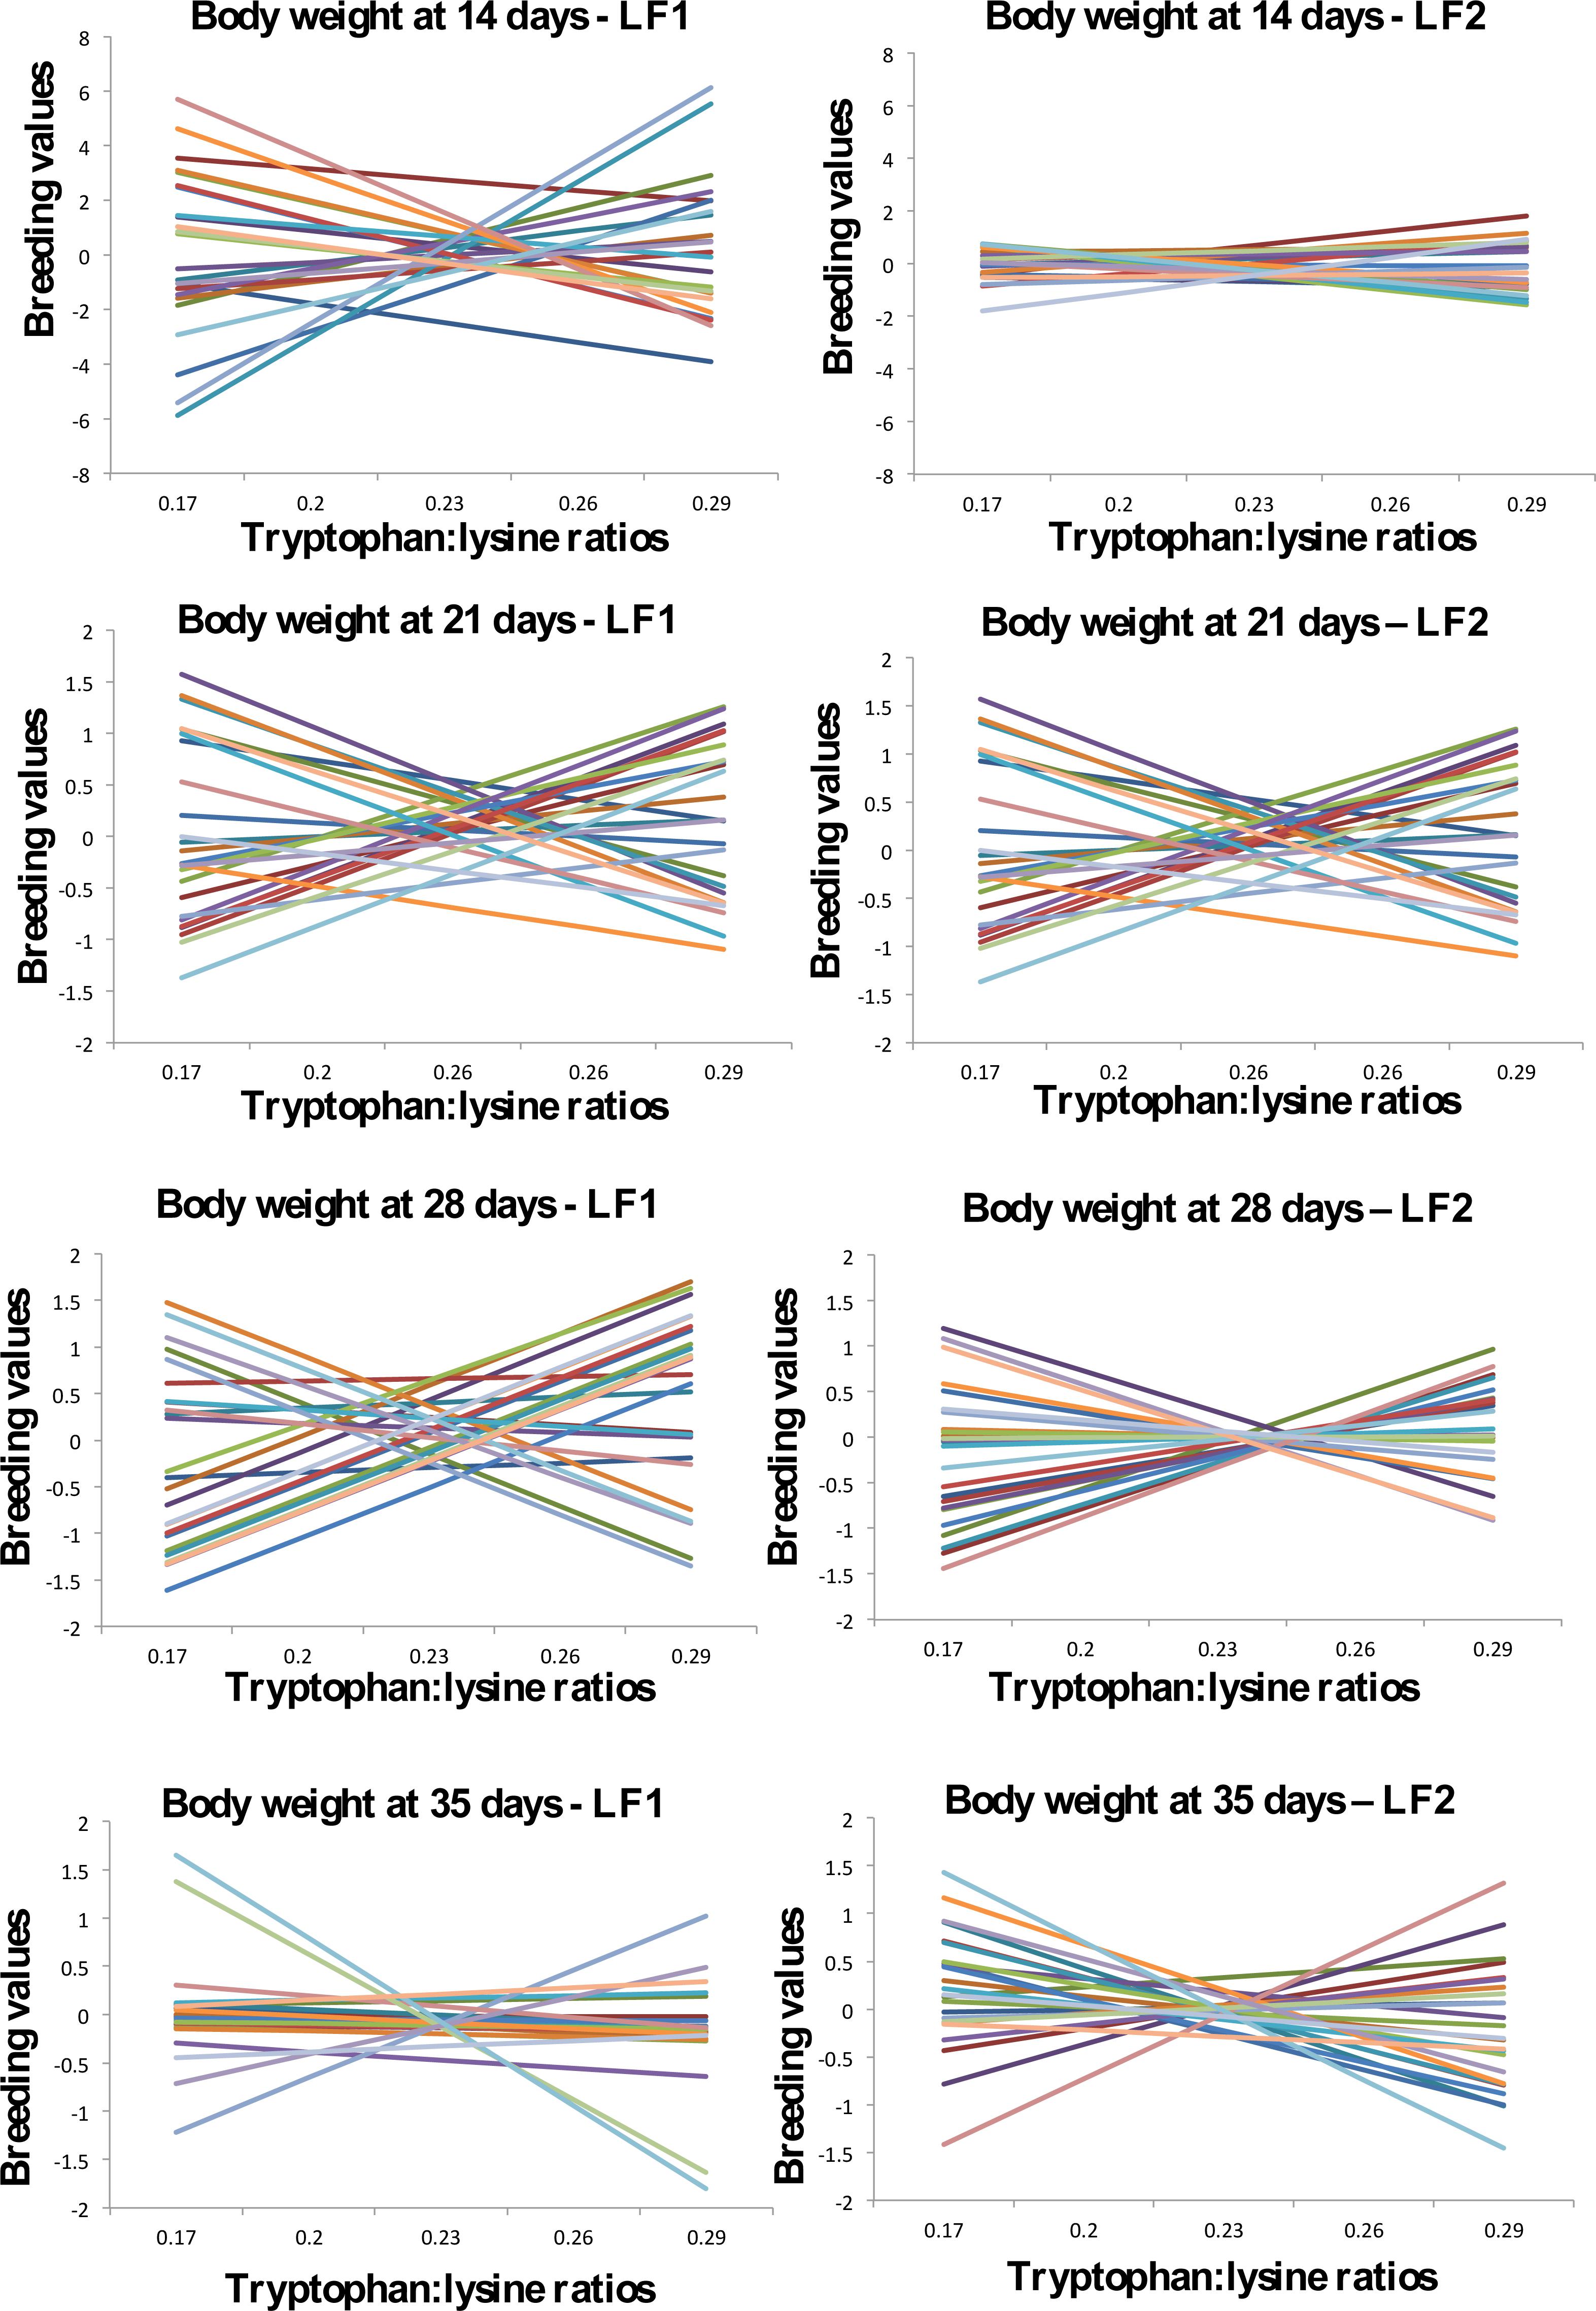
The heritability estimates observed for all traits varied according to the changes in tryptophan:lysine ratios in the diets, in both lines (Figure 1). For the two lines, at 14 days of age, the heritability decreased for 0.17 to 0.20 tryptophan:lysine ratios, after which it presented an increase with higher ratios. At 21 days, heritability and additive variance decreased with increasing tryptophan:lysine ratios, with a slight increase at the 0.29 ratio. For the body weight at 28 and 35 days of LF1 line, the estimates remained very low and constant. For LF2 line at 35 days, heritability and additive variance decreased up to the 0.23 ratio, then increased by 0.29. If quails were selected at 14 days, higher ratios of tryptophan:lysine should be used. The opposite effect was observed at 21 days, in which quails should be selected at lower ratios. According to the results, as the selection of the next generation parents in a breeding program occurs after 21 days due to sex determination, lower levels of amino acids could be used during all breeding phases, thus reducing the production cost. The reaction norms of 25 birds randomly sampled in the database for each evaluated period are shown in Figure 2. According to these analyzes, animals evaluated in both lines presented rearrangement and dispersion in their breeding values ranking in all analyzed ages.
Reaction norms of the additive breeding values for body weights in LF1 and LF2 meat quails fed from birth to 21 days of age with diets containing different tryptophan:lysine ratios
The dispersion of the breeding values was greater at 14 days of age for LF1 line, different from the results observed by Santos (2008)SANTOS, G.G.; CORRÊA, G.S.S.; VALENTE, B.D.; SILVA, M.A.; CORRÊA, A.B.;FELIPE, V.P.S.; WENCESLAU, R.R. Sensibilidade de valores genéticos de codornas de corte em crescimento às modificações de níveis de proteína das dietas. Arquivo Brasileiro de Medicina Veterinária e Zootecnia, v.60, n.5, p.1188-1196, 2008., who observed the greatest dispersion at 42 days of age. At 35 days, the lowest dispersion of breeding values for LF1 line was observed. For the two lines, in all evaluated ages, rearrangements were observed in the breeding values ranking, characterizing the occurrence of interaction between genotype and environment.
According to Su et al. (2006)SU, G.; MADSEN, P.;LUND, M.S.;SORENSEN, D.;KORSGAARD, I.R.; JENSEN, J. Bayesian analysis of the linear reaction norm model with unknown covariates. Journal Animal Science, v.84, n.7, p.1651-1657, 2006., changes in the order of breeding values ranking tend to be more intense as much the values of the correlations of coefficients b0 and b1 differ. However, even with some values for genetic correlation in this study being above 0.8, the reaction norms showed a rearrangement for the breeding values of the evaluated weights.
Mota et al. (2015)MOTA L.F.M.; ABREU, L.R.A.; SILVA, M.A.; PIRES, A.V.; LIMA, H.J.D.; BONAFÉ, C.M.; COSTA, L.S.; SOUZA, K.A.R.; MARTINS, P.G.M.A. Genotype x dietary (methionine + cystine): Lysine ratio interaction for body weight of meat-type quails using reaction norm models. Livestock Science, v.182, p.137–144, 2015. using reaction norms models verified the presence of genotype by environment interaction in quails fed with different (methionine + cystine): lysine ratios in the diet. In another study, Santos et al. (2008)SANTOS, G.G.; CORRÊA, G.S.S.; VALENTE, B.D.; SILVA, M.A.; CORRÊA, A.B.;FELIPE, V.P.S.; WENCESLAU, R.R. Sensibilidade de valores genéticos de codornas de corte em crescimento às modificações de níveis de proteína das dietas. Arquivo Brasileiro de Medicina Veterinária e Zootecnia, v.60, n.5, p.1188-1196, 2008. studied two lines of meat quails evaluating changes in crude protein levels (24, 26, 28 and 30%) of the diets via models considering heterogeneity of residual variance. The authors observed the dispersion of breeding values indicating the presence of interaction between genotype and environment, corroborating with the results of this study.
Inour study, it was observed that the random regression models that considered the heterogeneous residual variance presented lower BIC values than those that considered homogeneity, and the two class model promoted the best fit in both lines considering the different tryptophan:lysine ratios. It was also verified interaction between genotype and environment, characterized by the rearrangement ofbreeding values ranking order of the evaluated traits, however, these breeding values are not valid for other tryptophan:lysine ratios.
REFERENCES
- BIGNARDI, A.B.; EL FARO, L.; CARDOSO, V.L.; MACHADO, P.F.; DE ALBUQUERQUE, L.G. Randomregressionmodelstoestimatetest-daymilkyieldgeneticparametersHolstein cows in Southeastern Brazil. Livestock Science, v.123, n.1, p.1-7, 2009.
- BONAFÉ, C.M.; TORRES,R.A.; TEIXEIRA,R.B.; SILVA, F.G.; SOUSA,M.F.; LEITE, C.D.S.; SILVA,L. P.; CAETANO, G.C. Heterogeneidade de variância residual em modelos de regressão aleatória na descrição do crescimento de codornas de corte. Revista Brasileira de Zootecnia, v.40, n.10, p.2129-2134, 2011.
- BREWER, M.J.; BUTLER, A.; COOKSLEY, S.L. The relative performance of AIC, AICC and BIC in the presence of unobserved heterogeneity. Methods in Ecology and Evolution, v.7, n.6 p.679-692, 2016.
- BURNHAM, K.P.; ANDERSON, D.R. Multimodel inference: understanding AIC and BIC in model selection. Sociological Methods & Research, v.33, p.261-304, 2004.
- DIONELLO, N.J.L.; CORREA, G.S.S.; SILVA, M.A.; CORRÊA, A.B.; SANTOS, G.G. Estimativas da trajetória genética do crescimento de codornas de corte utilizando modelos de regressão aleatória. Arquivo Brasileiro de Medicina Veterinária e Zootecnia, v.60, n.2, p.454-460, 2008.
- EL FARO, L.; ALBUQUERQUE, L.G. Utilização de modelos de regressão aleatória para produção de leite no dia do controle, com diferentes estruturas de variâncias residuais. Revista Brasileira de Zootecnia, v.32, p.1104-1113, 2003.
- FALCONER, D.S. Introduction to quantitative genetics Essex: Longman Scientific & Technical, 1989. 438p.
- FARIA, G.Q.; BONAFÉ, C.M.; SOUZA, K.A.R.; SILVA, M.A.; COSTA, L.S.; LIMA, H.J.D.; CAMPOS, F.G.; SILVA, R.B.; SILVA, A.A.; TAROCÔ, G.; ROCHA, G.M.F.; MIRANDA, J.A. Estimação de valores genéticos para codornas europeias em função dos níveis da relação treonina: lisina da dieta: do nascimento aos 21 dias de idade. Arquivo Brasileiro de Medicina Veterinária e Zootecnia, v.69, p. 214-224, 2017.
- FELIPE, V.P.S.;SILVA, M.A.; WENCESLAU, R.R.; VALENTE, B.D.; SANTOS, G.G.; FREITAS, L.S.; CORRÊA, G.S.S.; CORRÊA, A.B. Utilização de modelos de norma de reação com variância residual heterogênea para estudo de valores genéticos de peso de codornas de corte em função de níveis de proteína bruta na dieta. Arquivo Brasileiro de Medicina Veterinária e Zootecnia, v.64, n.4, p.991-1000, 2012.
- GONÇALVES, F.M.; PIRES, A.V.; PEREIRA, I.G.; DRUMOND, E.S.C.; FELIPE, V.P.S.; PINHEIRO, S.R.F. Genetic Evaluation of European quails by random regression models. Revista Brasileira de Zootecnia, v.41, n.9, p.2005-2011, 2012.
- JORDÃO FILHO, J.; SILVA, J.H.V.; SILVA, C.T.; COSTA, F.G.P., SOUSA, J.M.B.; GIVISIEZ, P.E.N. Energy requirement for maintenance and gain for two genotypes of quails housed in different breeding rearing systems. Revista Brasileira de Zootecnia, v.40, n.11, p.2415-2422, 2011.
- LE FLOC’H, N.; OTTEN, W.; MERLOT, E. Tryptophan metabolism, from nutrition to potential therapeutic applications. Amino Acids, v.41, p.1195-1205, 2011.
- MEYER, K. “WOMBAT” – Digging deep for quantitative genetic analyses by restricted maximum likelihood. In: WORLD CONGRESS OF GENETICS APPLIED TO LIVESTOCK PRODUCTION, 8, 2006, Belo Horizonte. Proceedings… Belo Horizonte, 2006.
- MIRANDA, J.A;PIRES, A.V.; ABREU, L.R.A.; MOTA, L.F.; SILVA, M.A.; BONAFÉ, C.M.; LIMA, H.J.D.; MARTINS, P.G.M.A. Sensitivity of breeding values for carcass traits of meat-type quail to changes in dietary (methionine + cystine): lysine ration using reaction norm models. Journal of Animal Breeding Genetics, n.133, p.463–475, 2016.
- MOTA L.F.M.; ABREU, L.R.A.; SILVA, M.A.; PIRES, A.V.; LIMA, H.J.D.; BONAFÉ, C.M.; COSTA, L.S.; SOUZA, K.A.R.; MARTINS, P.G.M.A. Genotype x dietary (methionine + cystine): Lysine ratio interaction for body weight of meat-type quails using reaction norm models. Livestock Science, v.182, p.137–144, 2015.
- NEVES, H.H.R.; CARVALHEIRO, R.; QUEIROZ, S.A. Genetic and environmental heterogeneity of residual variance of weight traits in Nellore beef cattle. Genetics Selection Evolution, v.44.1, p.19, 2012.
- OLIVEIRA, W.P.;OLIVEIRA, R.F.M.; DONZELE, J.L.; GOMES, P.C.; MARTINS, M.S.; ASSIS, A.P. Redução do nível de proteína bruta em rações para frangos de corte em ambiente de estresse por calor. Revista Brasileira de Zootecnia, v.39, n.5, p.1092-1098, 2010.
- ROBERTSON, A. The sampling variance of genetic correlation coefficient. Biometric, v.15, n.3, p.469-485, 1959.
- ROSTAGNO, H.S. ALBINO, L.F.T.; DONZELE, J.L.; GOMES, P.C.; OLIVEIRA, R.F.; LOPES, D.C.; FERREIRA, A.S.; BARRETO, S.L.T.Tabelas brasileiras para aves e suínos: composição de alimentos e exigências nutricionais. Viçosa, MG: Universidade Federal de Viçosa, 2011.
- SANTANA, M.L.; JR, E.J.P.; BIGNARDI, A.B.; MENÉNDEZ-BUXADERA, A.; CARDOSO, F.F.;FERRAZ, J.B. Multi-trait linear reaction norm model to describe the pattern ofphenotypic expression of some economic traits in beefcattle across a range of environments. Journal Applied Genetics, v.56, p.219–229. 2015.
- SANTOS, G.G.; CORRÊA, G.S.S.; VALENTE, B.D.; SILVA, M.A.; CORRÊA, A.B.;FELIPE, V.P.S.; WENCESLAU, R.R. Sensibilidade de valores genéticos de codornas de corte em crescimento às modificações de níveis de proteína das dietas. Arquivo Brasileiro de Medicina Veterinária e Zootecnia, v.60, n.5, p.1188-1196, 2008.
- SCHMIDT, M.; GOMES, P.C.; ROSTAGNO, H.S.;ALBINO, L.F.T.; NUNES, R.V.; MELLO, H.H.C. Níveis nutricionais de metionina+cistina digestível para poedeiras leves no segundo ciclo de produção. Revista Brasileira de Zootecnia, v.40, n.1, p.142-147, 2011.
- SCHWARZ, G. Estimating the dimension of a models. The Annals of Statistics, v.6, n.2, p.461-464, 1978.
- SILVA, F.F.; MULDER, H.A.; KNOL, E.F.; LOPES, M.S.; GUIMARÃES, S.E.F.; LOPES, P.S.; MATHUR, P.K.; VIANA, J.M.S.; BASTIAANSEN, J. W. M. Sire evaluation for total number born in pigs using a genomic reaction norms approach. Journal of Animal Science, v.92, p. 3825–3834, 2014.
- SILVA, J.H.V.; COSTA, F. G. P. Tabela para codornas japonesas e europeias 2.ed. Jaboticabal, SP: FUNEP, 2009. 110p.
- SU, G.; MADSEN, P.;LUND, M.S.;SORENSEN, D.;KORSGAARD, I.R.; JENSEN, J. Bayesian analysis of the linear reaction norm model with unknown covariates. Journal Animal Science, v.84, n.7, p.1651-1657, 2006.
- TEIXEIRA, B.B. EUCLYDES, R.F.; TEIXEIRA, R.B.; SILVA, L.P.; TORRES, R.A.; LEHNER, H.G.; CAETANO, G.C.; CRISPIM, A.C. Modelos de regressão aleatória para avaliação da curva de crescimento em matrizes de codorna de corte. Ciência Rural, v.42, n.9, p.1641-1647, 2012.
- VELOSO, R.C.; ABREU, L.R.A.; MOTA, L.F.M.; CASTRO, M.R.; SILVA, M.A.; PIRES, A.V.; LIMA, H.J.D'A.; BOARI, C.A. Modelos de norma de reação para estudo das características de qualidade da carne de codornas de corte em função das relações (metionina+cistina):lisina da dieta. Arquivo Brasileiro de Medicina Veterinária e Zootecnia, v.67, n.5, p.1438–1448, 2015.
Publication Dates
-
Publication in this collection
Oct-Dec 2018
History
-
Received
17 July 2018 -
Accepted
20 Sept 2018