Abstracts
Introduction:
Currently, the reticulocyte counting is a challenge for clinical laboratories in Brazil, mainly for the ordinary ones, which still use the manual method. This method has some limitations, since it consists of a laborious method, time consuming, with low accuracy.
Objectives:
This study has developed and evaluated the performance of a New Laboratory Protocol for flow cytometry (FC) reticulocytes counting using acridine orange (AO) as dye, aiming to standardize a more precise, easy, fast implementation, and low cost protocol. After standardization of the New Protocol (FC/AO), it was compared with the manual method. The results were analyzed according to the recommendations of the National Committee for Clinical Laboratory Standards (NCCLS), now known as Clinical and Laboratory Standards Institute (CLSI), to evaluate the interchangeability of methods in linear regression analysis and paired t test, besides other quality control tests.
Conclusion:
Based on these results concerning to the correlation between the methods and the tests related to quality control, we can admit that FC/AO for reticulocyte counting shows undeniable advantages when compared to the preexisting manual method.
reticulocyte counting methods; flow cytometry; acridine orange; manual reticulocyte count
Introdução:
Atualmente, a contagem de reticulócitos representa um desafio para os laboratórios clínicos no Brasil, principalmente os de pequeno e médio porte, nos quais ainda se utiliza o método manual. Este método apresenta algumas limitações, classificando-se como tedioso, demorado e de baixa precisão.
Objetivos:
O presente estudo desenvolveu e avaliou o desempenho de um novo protocolo laboratorial para contagem de reticulócitos por citometria de fluxo (CF) utilizando acridine orange (AO) como corante, visando padronizar um protocolo preciso, de fácil e rápida execução e custo acessível. Após a padronização do novo protocolo desenvolvido (CF/AO), fez-se a comparação com o método manual. Os resultados foram analisados de acordo com recomendações do National Committee for Clinical Laboratory Standards (NCCLS), atualmente Clinical and Laboratory Standards Institute (CLSI), para avaliar a intercambialidade entre os métodos, por meio da análise de regressão linear e teste t pareado, além de outros testes de controle de qualidade.
Conclusão:
Diante dos resultados obtidos referentes à correlação entre os métodos e os testes voltados ao controle de qualidade, pode-se admitir que o CF/AO estabelecido para contagem de reticulócitos possui vantagens inegáveis quando comparado com o método manual.
métodos de contagem de reticulócitos; citometria de fluxo; acridine orange; contagem manual de reticulócitos
INTRODUCTION
The diagnosis definition between the hemolytic or nonhemolytic anemia, as well as the assessment of nutritional anemia and other conditions that lead to tissue hypoxia treatments, are among the main causes of clinical applications for reticulocyte count. These conditions can lead to an increased number of these cells in blood tissue, indicating an overactive bone marrow. The count reduction, in turn, may be indicative of hypoactive bone marrow(44. FAILACE, R. Hemograma: manual de interpretacao. 5. ed. Porto Alegre: Artmed, 2009. 424p.,1414. ZAGO, M. A.; FALCÃO, R. P.; PASQUINI, R. Hematologia: fundamentos e pratica. São Paulo: Atheneu, 2001. 1081p.). However, the reticulocyte count is a challenge for clinical laboratories in general, because its degree of reliability is not consistent with its level of importance in clinical decisions. Most laboratories in Brazil still performs the determinations by the manual method, despite its limitations, since it consists in a boring, time consuming and of low precision method(88. PIVA, E.; BRUGNARA, C.; CHIANDETTI, L.; PLEBANI, M. Automated reticulocyte counting: state of the art and clinical applications in the evaluation of erythropoiesis. Clin Chem Lab Med, v. 48, n. 10, p. 1369-80, 2010.). In turn, the use of automated methods allows a significant increase in the accuracy of results, and optimization of the analyst job, so that enabling him (her) to do other important activities in the laboratory(99. RILEY, R. S.; BEN-EZRA, J. M.; TIDWELL, A.; ROMAGNOLI G. Reticulocyte analysis by flow cytometry and other techniques. Hematology/Oncology Clinics of North America, v. 16, p. 373-20. 2002.).
Considering the importance of using the reticulocyte count in various clinical conditions, as well as the need to evaluate, refine, and develop new automated methods, it justifies efforts to establish protocols that are precise, accurate, rapid, efficient, and of low cost.
This study aimed to validate a laboratory protocol for flow cytometry (FC) reticulocytes enumeration by using acridine orange (AO), with good accuracy, low cost, as well as ease and speed of execution. Furthermore, we attempted to evaluate its performance, comparing it with the conventional method (manual), and we performed quality control testing, following some guidelines established by the National Committee for Clinical Laboratory Standards(66. NCCLS. Methods for reticulocyte counting (automated blood cell counters, flow cytometry, and supravital dyes); approved guideline - second edition. NCCLS document H44-A2, v. 24, n. 8, 2004, 35p.), now known as Clinical and Laboratory Standards Institute (CLSI), and others, relevant to the evaluation method.
MATERIAL AND METHODS
This study is part of a larger project entitled "Methodological Innovations in flow cytometry applied to Hematology", approved by the Reserch Ethics Commitee-Universidade Federal de Minas Gerais (UFMG), and by the Reserch Ethics Commitee-Fundação Centro de Hematologia e Hemoterapia de Minas Gerais (Fundação Hemominas).
To carry out all stages of the study, blood samples from healthy donors were analyzed, as well as outpatients of the Fundação Hemominas, patients with anemia, especially sickle-cell anemia. A small aliquot of venous blood samples (about 1 ml) was directly collected into Vacutainer® System Tubes (5 ml of whole blood collected in ethylenediaminetetraacetic acid [EDTA] + K3), from a vein of the arm of patients and donors of the Fundação Hemominas. It was reserved for this study, and transferred to a 12 × 75 mm polystyrene tube. All blood samples were strictly processed 4 and 7 hours after collection.
Validation protocol of FC reticulocyte counting using AO
In order to validate a protocol for FC reticulocytes enumeration using AO as a dye, this study was divided into two phases. At first, we attempted to define the optimal concentration of AO, the time and temperature of incubation for staining reticulocytes, and thus, to establish a new protocol. In the second phase, the parameters defined in the previous phase were evaluated in a larger number of samples; we also performed the quality control tests.
Standardization protocol for FC reticulocyte counting using AO (Phase 1)
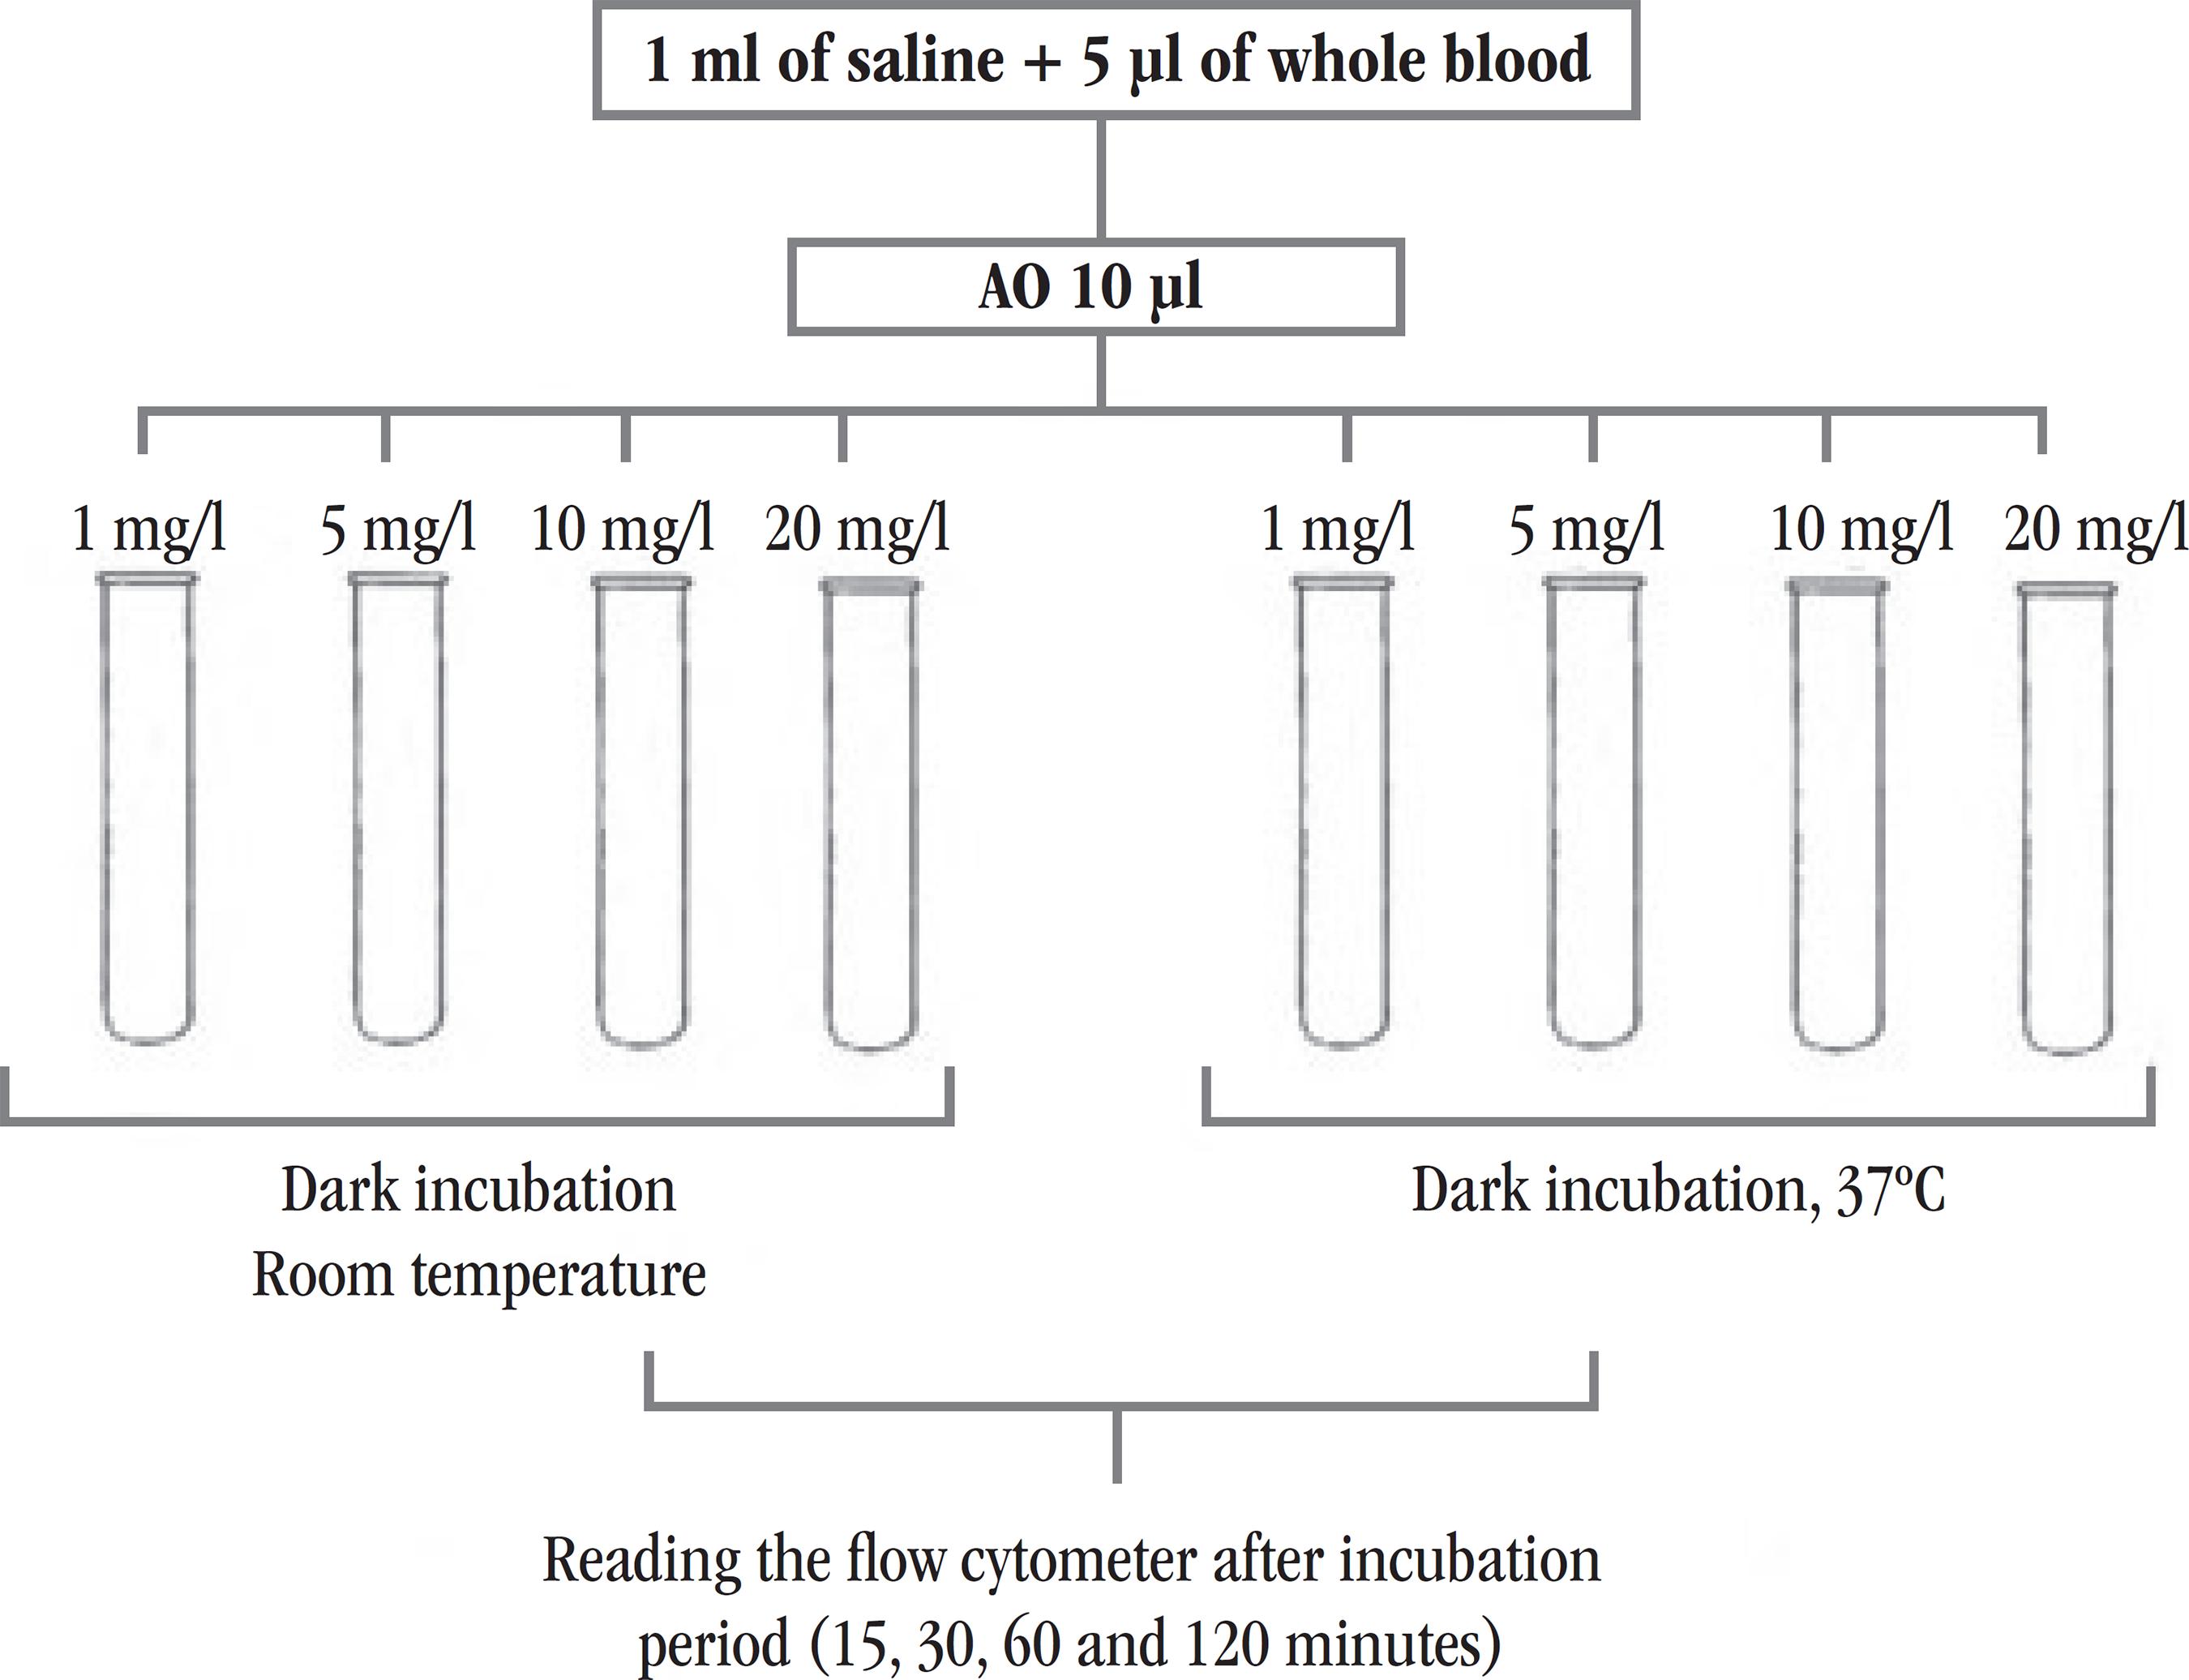
In the process for standardization of the FC reticulocyte counting using AO (new protocol), 32 samples were evaluated. Initially, eight polystyrene tubes of 12 × 75 mm were used for each sample. In all tubes we added 1 ml of saline solution (SS) and 5 µl of whole blood collected in EDTA. To determine the optimal concentration of AO, we added, in duplicate tubes, 10 µl of this reagent in four different concentrations (1 mg/l, 5 mg/l, 10 mg/l e 20 mg/l) for each concentration. Preparations were stored in the dark, but the tubes in which same concentrations of AO were added, were set at different temperatures: one at room temperature, and the other at 37ºC. Data acquisitions were then performed after 15 min of incubation, using FC, BD FACSCaliburTM . The same procedure was repeated three times after 30, 60, and 120 minutes of incubation. An outline of this experiment is shown in Figure 1. For each temperature and time of incubation, the "blank" of the evaluating sample was prepared in the same way as the forementioned description, but without the addition of fluorochrome. At this stage of the study, all samples processed in FC had their reticulocyte counts previously conducted by the manual method using brilliant cresyl blue (BCB) dye, all of them were performed by an experienced professional in Fundação Hemominas.
Design of the experiment used to define the best concentration of AO, time and temperature of incubation, to standardize the method of FC reticulocyte counting
FC: flow cytometry; AO: acridine orange.
The results of experiments, using AO at different concentrations and incubation at different times and temperatures, were compared with the results from manual counting performed by a professional in Fundação Hemominas. The comparison was made by graphic built in Excel and statistical analyzes using SPSS v.13.0 program, evaluating the correlation and linear regression line between the methods.
At the end of the analysis of the results obtained, we established a new protocol for FC reticulocytes enumeration using AO. The new protocol is described in the Methods section used for reticulocyte count, item B.
The parameters adjustment and samples reading using AO were performed considering fluorescence 3. Analysis of the data obtained by flow cytometry using AO were carried out as described below in the Methods section used for reticulocytes counting, items C and D.
Evaluation of standardized protocol (new protocol) (Phase 2)
Comparison between standardized reticulocyte counting protocol (new protocol) and manual method
To validate the new standardized protocol for the reticulocytes enumeration, 50 blood samples from healthy donors at Fundação Hemominas (Group C) were analyzed, with normal reticulocyte count (reference value [VR]: 0.5% a 2%). Blood samples from patient with anemia at outpatients Fundação Hemominas, especially sickle-cell disease (Hbss), with reticulocytosis, were also included in this study. From these patients, 50 samples with reticulocyte count were analysed, they ranged from 2.1% to 10% (Group PI), and 50 samples from patients with counts above 10% (Group PH) were also analyzed. Patients were classified within these ranges of percentage, according to the reticulocyte counts results obtained by the manual method.
Each sample was subjected to two reticulocytes counts using the manual method and only one using the automated method of new protocol which shall be validated in the study. The supravital dye BCB (Laborclin) was used in the manual method. The protocol which shall be valited was standardized in phase 1 of this study (new protocol), as well as the one used for reticulocyte counting by manual methods are described below (methods used for reticulocyte counting, items A, B, C).
Thus, we compared the sets of results obtained with the use of duplicate counting average by the manual method, and the results of the new protocol shall be validated; they counted only once each. Therefore, it was possible to evaluate the ability of the new protocol developed in this study to produce results consistent with those obtained by the standard routine method.
Methods used for reticulocytes counting
A) Reticulocyte counting using manual method
The reticulocyte count using conventional microscopy was performed according to standard protocol routinely employed at the Hematology Laboratory, Faculdade de Farmácia-UFMG.
For each sample, aliquots of 50 µl of whole blood collected in EDTA, and 50 µl of BCB dye 2% were added to polystyrene tube of 12 × 75 mm. The mixture was homogenized and incubated for 15 minutes in water-bath at 37ºC, protected from light. Then, blood films were prepared on glass slides for microscopy. Counting was performed using a microscope with 100× objective lens in immersion field, and the reticulocytes number was calculated considering the number of these cells in 1,000 erythrocytes evaluated. The results were expressed as percentage of reticulocytes.
B) FC reticulocyte counting using the fluorochrome AO (new protocol)
FC reticulocyte counting using AO was performed according to the new protocol previously established in phase 1 of this study.
For each sample, two polystyrene tubes 12 × 75 mm were used. In each tube we added 1 ml of saline and 5 µl of whole blood collected in EDTA. Just in one tube we added 10 µl of fluorochrome AO 5 mg/l. The mixtures were homogenized and left aside for 30 minutes at room temperature and protected from light. Immediately after this timeout, the preparation was obtained in FC. Firstly, the preparation of the tube without fluorochrome (blank) was obtained, and then, the tube containing the sample was prepared adding AO for reticulated cell staining.
Cells were acquired on BD FACSCaliburTM cytometer, and data were analyzed by Cell Quest Pro software. A total of 50,000 events were acquired employing the appropriate adjustments.
C) FC reticulocyte analysis strategy
The basic strategy of the analysis of data obtained by FC for reticulocytes enumeration using AO (Figure 2) was initially performed using punctual distribution ghraphs of Forward Scatter Channel (FSC) (size) versus Side Scatter Channel (SSC) (granularity), and fluorescence 1 (FL1) versus fluorescence 2 (FL2). The homogeneous distribution of the population in these graphs allowed the placement of windows on the corresponding erythrocyte lineage cells regions (R1 and R2). Combining R1 and R2 regions, the gate used to determine the percentage of reticulocytes in the sample was established, and the punctual distribution of FSC (size) versus AO (FL3) graphs were built. Therefore, quadrants were placed to determine the percentage of cells stained by AO. The percentage of reticulocytes was obtained by the difference between tube results; the tube of each sample in which the fluorochrome, AO, and "blank" was added.
Strategic analysis for FC reticulocytes enumeration using AO
(A) Selection of the population of interest based on morphometric aspects (R1); (B) selection of homogeneous population (R2), excluding possible interfering; (C) percentage quantification of positive cells in right upper quadrant for the selected cells population from the proposed gate (R1 e R2).
FC: flow cytometry; AO: acridine orange; SSC: side scatter channel; FSC: forward scatter channel.
D) Statistical analysis of the data for comparison of the evaluated methods
The obtained data were tabulated and analyzed using Excel and SPSS v.13.0 statistical software. To compare the methods, linear regression models were adjusted and the correlation between them was evaluated. Scatter plots were also built and the paired t test was performed, according to NCCLS, 2004.
Quality control for FC reticulocyte counting using AO protocol (new protocol)
To validate the FC reticulocyte counting protocol is required to determine several parameters according to NCCLS. Therefore, in compliance with the rules of that committee, in this study we evaluated the accuracy, method linearity, and carry-over. Experiments to assess the stability of the stained sample were timely included, to complement this study.
Accuracy
A) For one sample
The evaluation of the accuracy of the new protocol included samples from three patients with different levels of reticulocytes (Grupos C, PI e PH). For each sample, both the FC reticulocyte counting protocol using AO and the manual method were performed, each method was repeated 12 times for the same sample. As from data obtained from the 12 preparations for one sample, we calculated the coefficient of variation (CV) for the evaluated method.
B) Device
Samples of three other patients with different reticulocyte counts (Grupos C, PI e PH) were evaluated. Each sample was subjected to a single AO staining. The same preparation was acquired 12 times on BD FACSCaliburTM, in order to determine the reproducibility of the device. The CV was calculated for each sample tested in the device.
Linearity
A blood sample of with normal reticulocyte count (C) and other with a high count (PH) were used to linearity test. The samples were centrifuged at 2200 revolutions per minute (rpm) during 10 minutes; then, the supernatant (plasma) was disposed, and the sediment was washed in phosphate-buffered saline (PBS) solution. Finally, the cells were resuspended in 25 ml of PBS solution. Next, 11 tubes were identified in different numbering, namely: 0, 10, 20, 30, 40, 50, 60, 70, 80, 90, and 100. It was pipetted 0.00, 0.10, 0.20, 0.30, 0.40, 0.50, 0.60, 0.70, 0.80, 0.90, and 1.00 ml of the PH sample diluted solution to tubes identified from 0 to 100, respectively. A volume of 1.00, 0.90, 0.80, 0.70, 0.60, 0.50, 0.40, 0.30, 0.20, 0.10, 0.00 ml of the sample C diluted solution were pipetted to tubes 0 to 100, respectively. The tubes containing the samples were centrifuged, the supernatant (PBS) was discarded, and then, we added 0.060 ml (60 µl) of ABO plasma compatible to each tube. The preparations were homogenized and then, 5 µl of each one was withdrawn to perform the FC reticulocyte counting using AO, and other 5 µl for the "blank" preparation. Part of the sample was used to perform the red blood cells counting on hematology analyzer (Sysmex XE-2100).
After obtaining the results, the absolute reticulocytes values were calculated from the percentage provided by the evaluated method and the erythrocyte counts found for each prepared tube. The absolute reticulocyte values expected were calculated using the following equation (NCCLS, 2004):
Ear = ahr + (1 - a)lr
Where,
Ea r= absolute reticulocyte count expected (× 109/l);
a = fraction of samples with high reticulocyte count in the tube (eg. 0.00, 0.10, 0.25, ....., 1.00);
hr = absolute reticulocyte count in the sample with high reticulocyte count (PH);
lr = absolute reticulocyte count in the sample with normal reticulocyte count (C).
The linear regression graph: expected values of reticulocyte count × found values, was drawn to assess the linearity of the FC reticulocyte counting using AO protocol. The graph was created using the SPSS v.13.0 statistical software.
Carry-over
Two blood samples, one with high reticulocyte count (~ 8.72%) and the other with low reticulocyte count (~ 0.36%) were selected. The red blood cell count of each sample was measured by Sysmex XE 2100 device, and then, the new protocol to FC reticulocyte counting was conducted. The sample with high reticulocyte count was submitted to three consecutive counts (PH1, PH2 e PH3 followed by three consecutive counts of the sample with low counting (C1, C2 e C3). The percent carry-over to the absolute reticulocytes concentrations was determined according to the following equation:
Stability of the stained sample
The stability of the stained sample was assessed in blood samples from seven patients with different reticulocyte counts (Grupos C, PI e PH). For each sample counts after 0.5; 2.5; 5.5; 18.5; and 24.5 hours of incubation were performed. From these results, the stability profile for the stained sample to reticulocytes count was found. Data were analyzed using SPSS v.13.0 software, evaluating its distribution profile by normality tests. Depending on result, whether presenting data with normal distribution or not, we applied the appropriate test to compare groups.
RESULTS
Standardized protocol to flow cytometry reticulocyte counting using AO (Phase 1)
In order to determine the best parameters to be used in FC using AO as a dye, so that the results were comparable with the manual method (widely used by clinical laboratories), the results were analyzed together with those provided by Fundação Hemominas, which refer to manual counting.
A statistical analysis was performed in order to investigate the evaluated parameters that best correlated with the manual method. Thus, the results of linear regression analysis (test indicated by NCCLS evaluate comparability of methods). According to statistical analysis, the parameters previously established by a previous qualitative analysis of data (room temperature, 30 minutes of time, and AO 5 mg/l concentration) (Methods used to reticulocyte count, items B), showed good correlation with the manual method (r = 0.919, Y = 1.093 + 1.056 X).
Evaluation of standardized protocol (new protocol) (Phase 2)
Comparison between the standardized protocol reticulocyte count (new protocol) and the manual method
The comparison between the results of the protocol to FC using AO and the manual method was performed by the graphs built by Excel software, with confidence intervals (CI) of 95% for binomial random variables, which represent the standard error of the reference method. Linear regression analyzes and paired t test were also performed using SPSS v. 13.0 software.
The tests conducted with larger samples size (n = 150) sustained a good correlation between the new protocol and the manual method (0.955, Figure 3 shows the comparison between the evaluated FC protocol and the manual method (reference), according to as recommended by the NCCLS, as well as the straight lines of linear regression).
Reticulocyte count (%) by manual method and FC using AO (n = 150) Continuous lines; binomial CI 95%; dashed line: linear regression between the evaluated methods; Y = 0.524 + 0.899X; r2 = 0.912; r = 0.955.
FC: flow cytometry; AO: acridine orange.
The t test was performed with the results obtained of all analyzed samples (n = 150), no significant difference between the results of Manual groups × FC/AO (p = 0,100) was observed.
Quality control for protocol to FC reticulocyte counting using AO (new protocol)
Accuracy
The accuracy for reticulocyte counting, according to the new protocol, was performed by CV calculation.
A) For one sample
The samples from three patients with different counts of reticulocytes (C, PI, PH) were used for FC counting reticulocytes using AO, and the manual method; each method was repeated 12 times for each sample. The CVs were higher for all samples using the manual method. For samples with reticulocyte count of 2.1% to 10% and higher than 10%, CVs were lower when compared to the result obtained for the sample count ≤ 2.0% in both methods. The results of both the manual method and the FC reticulocyte counting using AO are shown in Tables 1 and 2, respectively.
B) Device
The samples from three patients with different reticulocyte counts were used. Each sample was subjected to the AO marking/staining (5 mg/l), for 30 minutes at room temperature, and then, 12 times acquired on BD FACSCaliburTM, in order to determine the reproducibility of the device. The results showed a high CV for the samples with reticulocyte counts within normal range (Table 3).
Linearity
The experiment allowed evaluation of the linearity of the automated protocol studied according to NCCLS, 2004. Thus, the linear regression line (values found × expected value) was calculated by SPSS v.13.0 software (Figure 4).
Linearity of the FC reticulocytes enumeration method (BD FACSCaliburTM), using AO (new protocol)
Y = -7319.39 + 1.030X; r2 = 0.982; r = 0.991. FC: flow cytometry; AO: acridine orange.
The method showed correlation coefficient equal to 0.991 (r2= 0.982; Y = -7319.39 + 1.030X).
Carry-over
Carry-over test was determined to evaluate the sample measuring effect on the subsequent samples measuring (Table 4). The carry-over calculation, considering the absolute count, was 1.1%.
Carry-over determination of the FC reticulocyte count (BD FACSCaliburTM) using AO (new protocol)
Estability of the stained sample
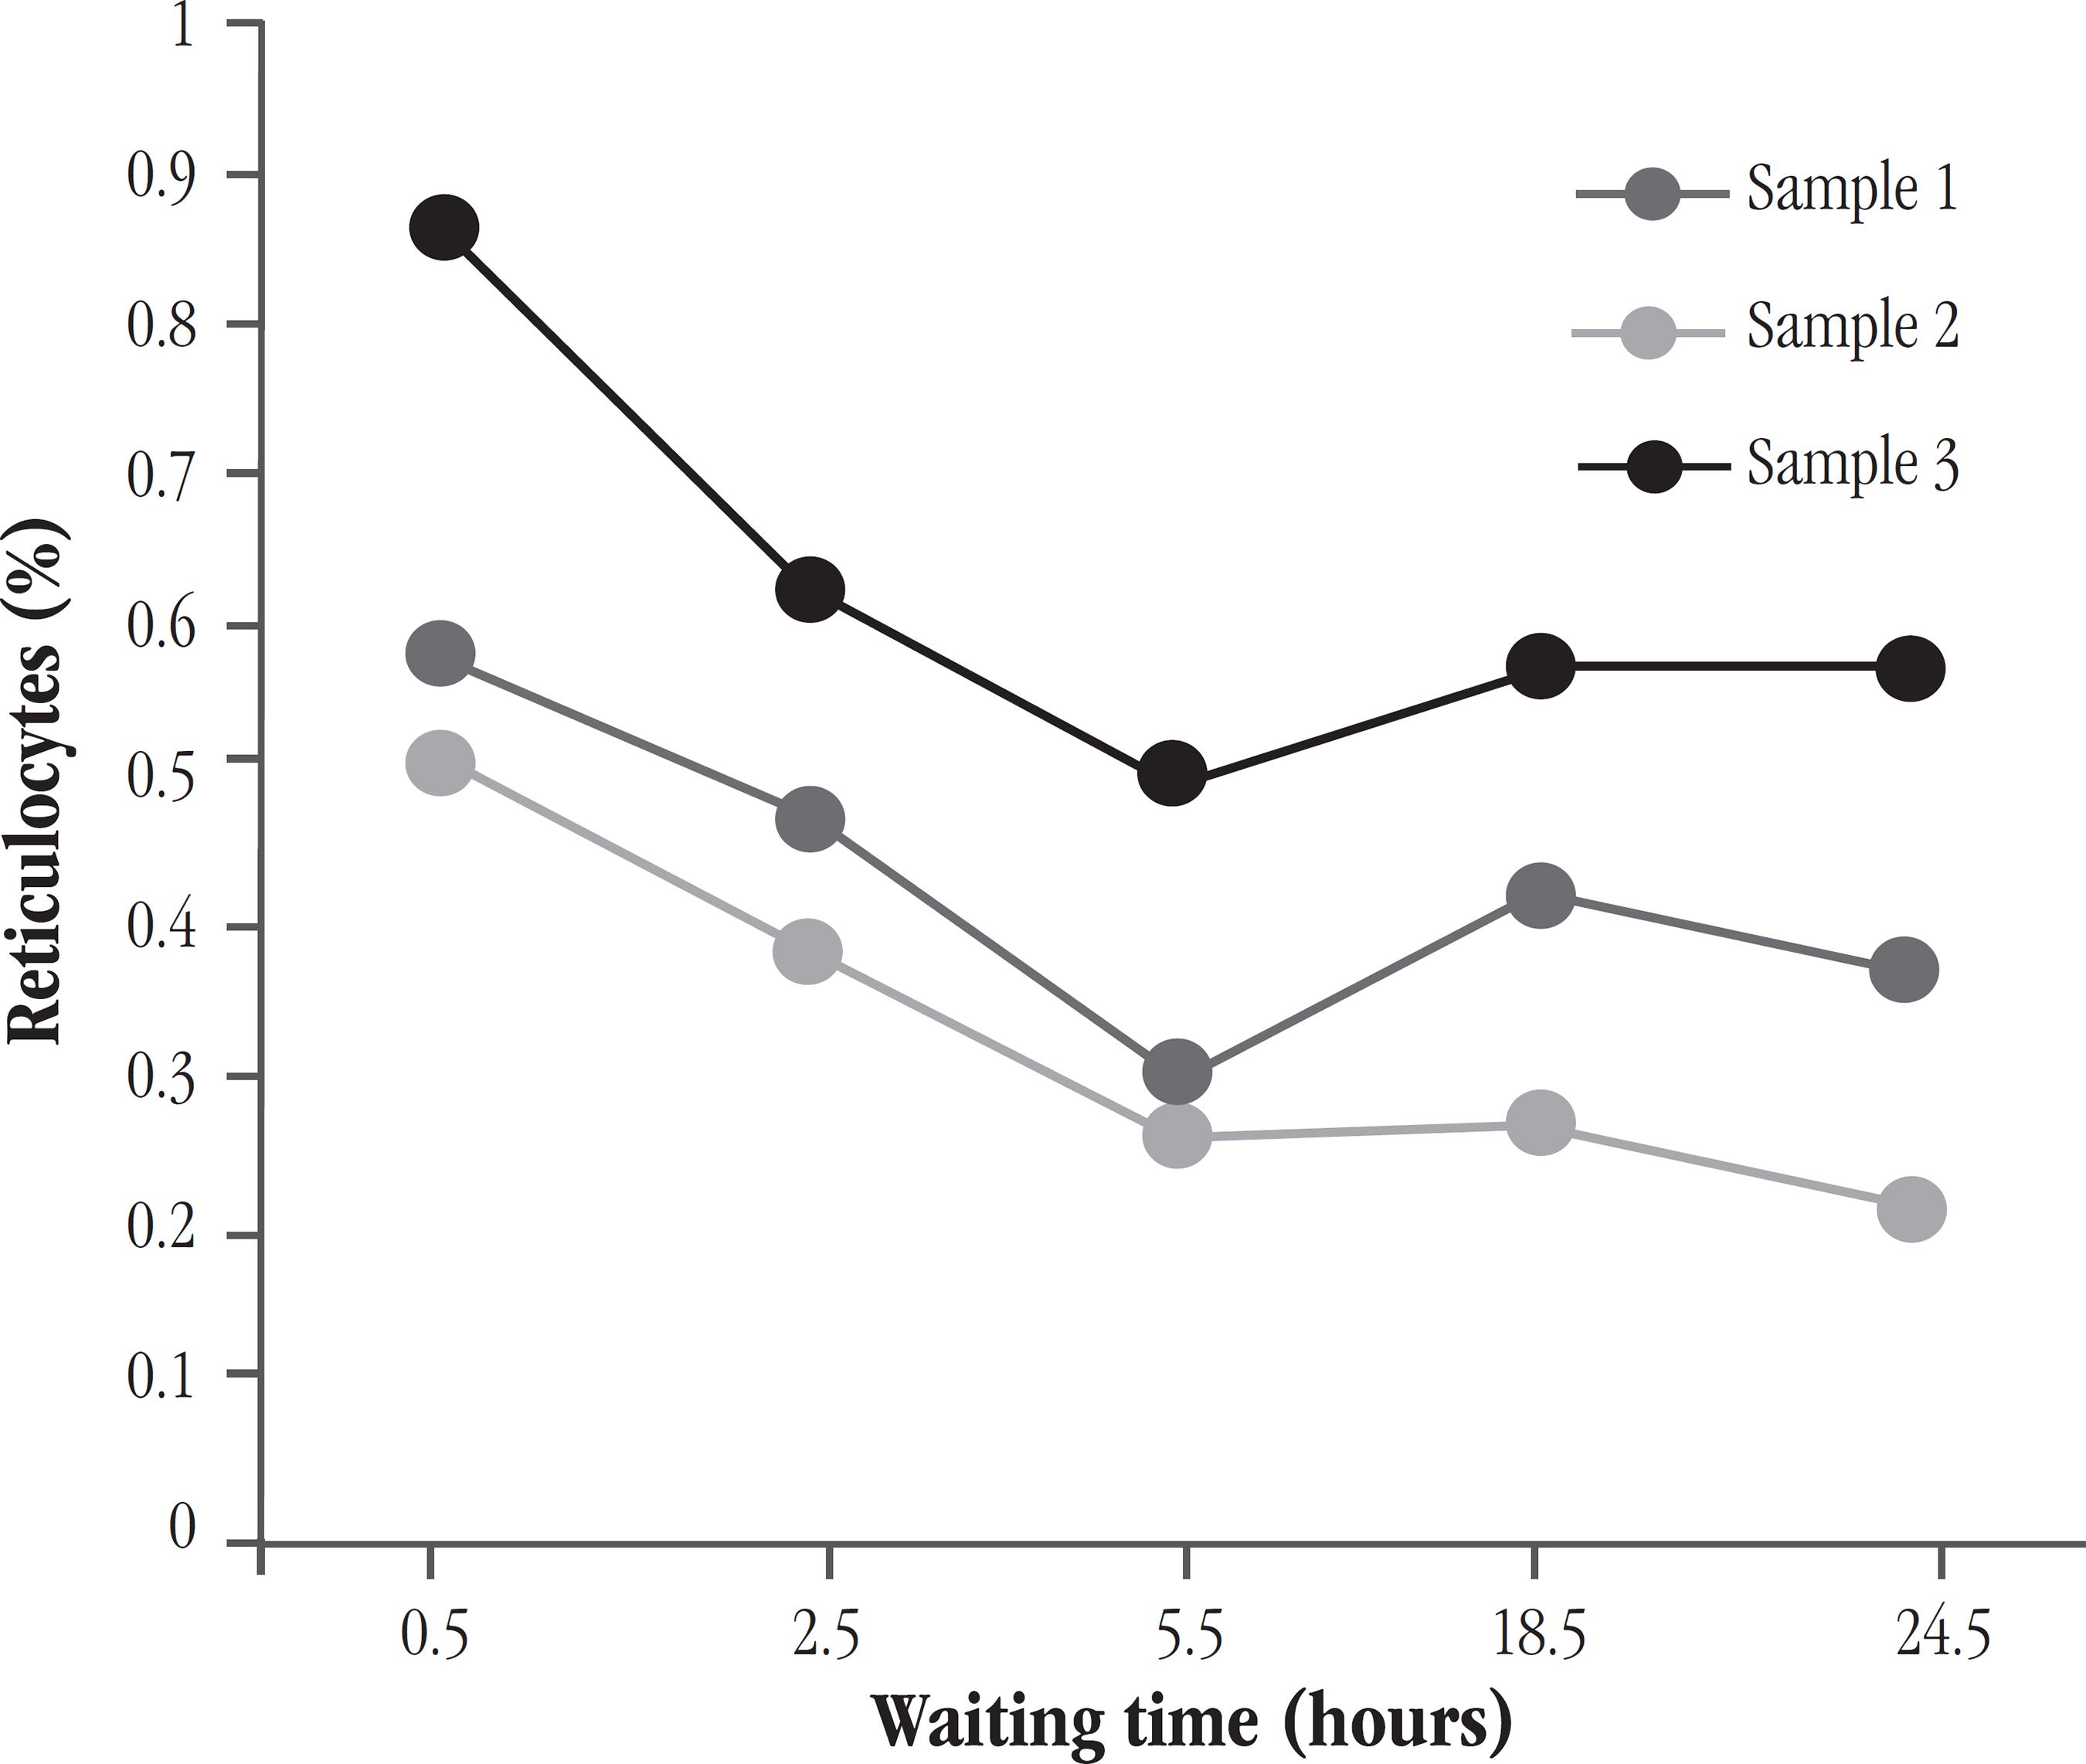
The stability of the stained sample was performed in blood samples from seven individuals, including normal donors and patients with different reticulocyte counts (C, PI e PH). For each sample, counts were performed after 0.5; 2.5; 5.5; 18.5; and 24.5 hours of waiting time.
Statistical analysis using the test comparison of means (paired t test) showed no significant difference between the values of manual counting and those obtained by FC using AO, for the 30 minutes (half an hour) to 150 minutes (2 and a half hours) waiting times (p = 0.675 and p = 0.104, respectively). For longer times, there was statistical difference compared to manual counting (p < 0.05). In general, there was reduction in reticulocyte count as the time of incubation of the sample with AO increased. Figure 5 illustrates the results obtained by FC for different times of incubation of blood samples with normal reticulocytes. Figure 6 shows the same results, but for samples with reticulocytosis.
Reticulocyte count (%) according to the waiting time (hours) for reading samples from donors, with normal reticulocyte value
Reticulocyte count (%) according to the waiting time (hours) for reading samples from patients with reticulocytosis
DISCUSSION OF RESULTS
Protocol standardization of FC reticulocyte counting using AO (Phase 1)
The established protocol is equally easy to perform when compared with BD Retic-COUNTTM commercial kit reticulocyte count, showing similarities to the time and temperature of incubation to carry out these methods.
Considering room temperature and time of 30 minutes, different concentrations of AO were tested for staining the samples. The result of the manual method showed a good correlation when 5 mg/l AO was used (r = 0.919). Besides this fact, the preparation of the AO solution with 5 mg/l was chosen in implementation of the new protocol, since it is economically more suitable, and more environmentally recommendable, once it reduces the amount of possible chemical waste. The College of American Pathologists (CAP) recommends that for new automated and manual methods proposed, the value of the intercept on the line in the linear regression should be equal to or less than 0.25(1212. SAVAGE, R. A.; SKOOG, D. P.; RABINOVITCH, A. Analytic inaccuracy and imprecision in reticulocyte counting: a preliminary report from College of American Pathologists Reticulocyte Project. Blood Cells, v. 11, p. 97-112, 1985.). In a small number of evaluated samples, none of the tested parameters reached this result, however, using 5 mg/l of AO, the lowest intercept was observed (a = 1.093).
Evaluation of the standardized protocol (new protocol) (Phase 2)
Comparison between the standardized protocol to reticulocyte count (new protocol) and other two methods
The evaluation of the FC reticulocyte counting using AO and the manual method, showed a coefficient of correlation 0.955 (Figure 3), that is very satisfactory and consistent with the results obtained for other automated methods in the literature reviews, when compared to manual counting. Rowan et al.(1010. ROWAN, R. M. Reference method, qualit control and automation of reticulocyte count. Pure and Applied Chemistry, v. 63, n. 8, p. 1141-5, 1991.), analyzed the correlation between the manual method and other automated method, using the equipment Sysmex R1000, in which it was applied fluorochrome Auramina O to reticulocyte counting; they found a correlation (r) of 0.943.
Blood samples analyzed in this study exhibited reticulocyte count values ranging from 0.5% to values higher than 10.0%. According to NCCLS, it is recommended that studies of comparable methods are done with representative samples, including normal samples with reticulocytosis and reticulocitopenia. However, the reference value of the reticulocyte count is already lower, very close to zero. Moreover, it was not possible to obtain samples of patients who had samples from patients with reticulocytosis reticulocitopenia, for example, patients with aplastic anemia or treated with chemotherapy. Thus, this study did not evaluate blood samples with values lower than normal reticulocyte count value. Therefore, one can not infer about the sensitivity of the method in case of intense reticulocitopenia.
Quality control on protocol to FC reticulocyte counting using AO (new protocol) shall be validated
Furthermore, to avoid interference resulting from exhaustive counting by the observer, it was set a maximum of 5 samples per day. As they were counted in duplicate, a total of 10,000 cells were the limit counting conducted each day. Despite the technical rigor used, the CV of the results of the manual count method was high, especially when the number of reticulocytes in the sample was low (Table 1).
The CVs obtained for all counting levels by automated protocol (Table 2) were always lower than the manual method. Only the counting for low value of reticulocytes in the sample had a value (16.76%) which exceeded that recommended by CAP, which is 15%. Nevertheless, the increase in accuracy of the results, especially in samples with low number of reticulocytes, is unquestionable.
It should be emphasized that the found CV is comparable to that obtained in other studies involving automated methods, such as Peng et al.(77. PENG, L.; YANG, H.; JIANG, H.; SU, J.; PENG, Z. Automated reticulocyte counting using the Sysmex RAM-1. Clin Lab Haem, v. 23, p. 97-102, 2001.). In this study, the authors reported the found results for reticulocyte count by automated method, but using Sysmex RAM-1 device and Auramina O. Using these parameters, it was found a CV of 3.51%, 5.89%, and 14.79% for high, medium, and low reticulocyte counts, respectively. The authors also evaluated an automated method, using FC (Elite ESP) and Retic-COUNT dye, they observed an average CV of 15.05%, unarguably with better accuracy than the manual method (29.57%). Same trend of results can be observed in the Carter et al.(33. CARTER, J. M.; McSWEENEY, P. A.; WAKEM, P. J.; NEMET, A. M. Counting reticulocytes by flow cytometry: use of thiazole orange. Clin Lab Haemat, v. 22, p. 267-71, 1989.) study, for a method using thiazole orange (TO), and cytometer FACS 420, CV = 3.1%, and intraobserver manual method, CV = 11.9%.
Buttarello et al.(11. BUTTARELLO, M.; BULIAN, P.; DE PRÀ, M.; BARBERA, P.; RIZZOTTI, P. Reticulocyte quantification by Coulter MAXM VCS (volume, conductivity, light scatter) technology. Clinical Chemistry, v. 42, n. 12, p. 1930-7, 1996.) results also agreed with those obtained in this study, in which the inaccuracy of the manual method increases with decreasing values of reticulocyte count. These researches found a CV of 67% for samples with reticulocitopenia, 28.9% for samples with reticulocytes normal value, and 13.0% for samples with reticulocytosis. Using automated method (Coulter MAXM analyser), found values were 16.1%, 16.9%, and 9.5%, respectively.
Hove et al.(55. HOVE, L. V.; GOOSSENS, W.; DUPPEN, V. V.; VERWILGHEN, R. L. Reticulocyte count thiazole orange. A flow cytometry method. Clin Lab Haemat, v. 12, p. 287-99, 1990.), observed for reticulocyte counting using Retic -COUNT reagent and FACScan, CVs of 19.0%, 4.5%, and 3.4% for samples that had an reticulocytes average of 0.4%, 3.7%, and 14.1%, respectively. To evaluate the CV of these samples, the researchers acquired 10,000 events; then it was observed that for low reticulocyte counts the CV decreases due to the increase in the number of cells analyzed. When 50,000 events for a sample with a mean of 0.49% reticulocytes were obtained, the CV was 8.10%.
Rowan et al.(1010. ROWAN, R. M. Reference method, qualit control and automation of reticulocyte count. Pure and Applied Chemistry, v. 63, n. 8, p. 1141-5, 1991.) reported that for the automated reticulocyte counting using Sysmex R1000, the reproducibility of the device was 15%, 7%, and 4% for samples with an average of 0.3%, 1.0%, and 5.0% reticulocytes, respectively. Rudensky(1111. RUDENSKY, B. Comparasion of a semi-automated new coulter methylene blue method with fluorescence flow cytometry in reticulocyte counting. Scand J Clin Lab Invest, v. 57, p. 291-6, 1997.) evaluated the CV reticulocyte count using Coulter semi-automated analyzer and methylene blue dye, and obtained results of 13.6%, 8.1%, and 6.1% for samples that had on average 0.9%, 5.3%, and 18.4% reticulocytes, respectively.
Savage et al.(1212. SAVAGE, R. A.; SKOOG, D. P.; RABINOVITCH, A. Analytic inaccuracy and imprecision in reticulocyte counting: a preliminary report from College of American Pathologists Reticulocyte Project. Blood Cells, v. 11, p. 97-112, 1985.), in a CAP project for evaluation of the accuracy of different methods of reticulocyte count, studied the performance of two different automated methods of reticulocyte count; one study referred to FC using AO. They observed satisfactory CV values, around 3.38 and 4.7% for a sample of about 7% of reticulocytes, the experiments were performed in duplicate. This trend occurs in relation to the CV was also observed regarding the reproducibility of the device, which showed CVs reduction in higher values of reticulocytes. Considering the higher CV shown by device to the three samples analyzed (Table 3), it can be inferred that the new protocol may is already technically reasonable, since the accuracy results are dependent on the device limitations.
The new protocol showed good linearity, r > 0.98, as recommended by the NCCLS (Figure 4). Other automated studies also presented good linearity, r = 0.997(77. PENG, L.; YANG, H.; JIANG, H.; SU, J.; PENG, Z. Automated reticulocyte counting using the Sysmex RAM-1. Clin Lab Haem, v. 23, p. 97-102, 2001.), 0.970(11. BUTTARELLO, M.; BULIAN, P.; DE PRÀ, M.; BARBERA, P.; RIZZOTTI, P. Reticulocyte quantification by Coulter MAXM VCS (volume, conductivity, light scatter) technology. Clinical Chemistry, v. 42, n. 12, p. 1930-7, 1996.), and 0.980(1313. WEARNE, A.; ROBIN, H.; JOSHUA, D. E.; KRONENBERG H. Automated enumaration of reticulocytes using acridine orange. Pathology, v. 17, p. 75-7, 1985.).
The carry-over (Table 4) obtained for the new protocol is within the range of values reported by Butarello et al.(22. BUTTARELLO, M. et al. Flow cytometric reticulocyte counting. Parallel evaluation of five fully automated analyzers: an NCCLS-ICSH approach. American Journal of Clinical Pathology, v. 115, n. 1, p.100-11, 2001.), who found insignificant results, ranging from 0.8% to tests performed with the equipment CD4000 and GEN-S, 1.8% with SE 9500 RET, 1.9% with ADVIA 120, and 3.5% with VEGA RETIC.
According to results of experiments performed using the temperature and the concentration of dye settled by the developed protocol, the blood sample can be up to approximately 2 and a half hours in the dark, after the AO addition, if it is not possible to make the acquisition in FC immediately after the 30 minutes of incubation required in the new protocol (Figures 5 e 6). Within this time, it was seen that the preparation remains suitable for reading and obtaining reliable results. This result is important to mention, since unexpected events may occur, delaying the reticulocyte count procedure. The use of Retic-COUNT reagent, according to the manufacturer, allows the acquisition of samples occurs within a period of 3 and half hours after 30 minute of incubation. Waiting times evaluated with the protocol using AO were different, allowing not saying that if the waiting time is longer, between 2.5 and 5.5 hours of incubation, it would be still appropriate to carry out the analysis. In the Hove et al.(55. HOVE, L. V.; GOOSSENS, W.; DUPPEN, V. V.; VERWILGHEN, R. L. Reticulocyte count thiazole orange. A flow cytometry method. Clin Lab Haemat, v. 12, p. 287-99, 1990.) study, the reticulocyte count remained similar for 2-7 hours of incubation at TO.
These results allow us to state that the new standardized protocol is in perfect accordance with the precepts established by the NCCLS, with regard to the quality of the automated reticulocyte counting using FC protocol.
It should be emphasized that most of the references used in this study are prior to 2000. This fact leads us to the idea that few studies are being developed to evaluate, and to propose strategies for improving the methods currently used in clinical laboratories, regarding to the enumeration of reticulocytes. Thus, further investigations aiming the improvement of reticulocyte count are desirable. In turn, our study evaluates a in-house reagent prepared, which use would decrease the costs of FC reticulocyte count performed, and also would keep the quality offered by the automated process.
CONCLUSION
This study established a new protocol for FC reticulocytes counting using AO with the following advantages:
-
easy and fast execution, favorable aspects to its application in clinical laboratories;
-
suitable for blood samples with reticulocytosis and with normal number of reticulocytes;
-
presents better accuracy than the manual method and is comparable with commercially available automated methods. Furthermore, it shows good correlation with the manual method, considered standard (r = 0.955);
-
shows quality requirements suitable for laboratory routine, such as preparation stability,and meet the NCCLS requirements, including accuracy studies, linearity, and carry-over.
-
SUPPORT Coordenação de Aperfeiçoamento de Pessoal de Nível Superior (Capes), Conselho Nacional de Desenvolvimento Científico e Tecnológico (CNPq), and Fundação de Amparo à Pesquisa do Estado de Minas Gerais (Fapemig).
REFERENCES
-
1BUTTARELLO, M.; BULIAN, P.; DE PRÀ, M.; BARBERA, P.; RIZZOTTI, P. Reticulocyte quantification by Coulter MAXM VCS (volume, conductivity, light scatter) technology. Clinical Chemistry, v. 42, n. 12, p. 1930-7, 1996.
-
2BUTTARELLO, M. et al. Flow cytometric reticulocyte counting. Parallel evaluation of five fully automated analyzers: an NCCLS-ICSH approach. American Journal of Clinical Pathology, v. 115, n. 1, p.100-11, 2001.
-
3CARTER, J. M.; McSWEENEY, P. A.; WAKEM, P. J.; NEMET, A. M. Counting reticulocytes by flow cytometry: use of thiazole orange. Clin Lab Haemat, v. 22, p. 267-71, 1989.
-
4FAILACE, R. Hemograma: manual de interpretacao. 5. ed. Porto Alegre: Artmed, 2009. 424p.
-
5HOVE, L. V.; GOOSSENS, W.; DUPPEN, V. V.; VERWILGHEN, R. L. Reticulocyte count thiazole orange. A flow cytometry method. Clin Lab Haemat, v. 12, p. 287-99, 1990.
-
6NCCLS. Methods for reticulocyte counting (automated blood cell counters, flow cytometry, and supravital dyes); approved guideline - second edition. NCCLS document H44-A2, v. 24, n. 8, 2004, 35p.
-
7PENG, L.; YANG, H.; JIANG, H.; SU, J.; PENG, Z. Automated reticulocyte counting using the Sysmex RAM-1. Clin Lab Haem, v. 23, p. 97-102, 2001.
-
8PIVA, E.; BRUGNARA, C.; CHIANDETTI, L.; PLEBANI, M. Automated reticulocyte counting: state of the art and clinical applications in the evaluation of erythropoiesis. Clin Chem Lab Med, v. 48, n. 10, p. 1369-80, 2010.
-
9RILEY, R. S.; BEN-EZRA, J. M.; TIDWELL, A.; ROMAGNOLI G. Reticulocyte analysis by flow cytometry and other techniques. Hematology/Oncology Clinics of North America, v. 16, p. 373-20. 2002.
-
10ROWAN, R. M. Reference method, qualit control and automation of reticulocyte count. Pure and Applied Chemistry, v. 63, n. 8, p. 1141-5, 1991.
-
11RUDENSKY, B. Comparasion of a semi-automated new coulter methylene blue method with fluorescence flow cytometry in reticulocyte counting. Scand J Clin Lab Invest, v. 57, p. 291-6, 1997.
-
12SAVAGE, R. A.; SKOOG, D. P.; RABINOVITCH, A. Analytic inaccuracy and imprecision in reticulocyte counting: a preliminary report from College of American Pathologists Reticulocyte Project. Blood Cells, v. 11, p. 97-112, 1985.
-
13WEARNE, A.; ROBIN, H.; JOSHUA, D. E.; KRONENBERG H. Automated enumaration of reticulocytes using acridine orange. Pathology, v. 17, p. 75-7, 1985.
-
14ZAGO, M. A.; FALCÃO, R. P.; PASQUINI, R. Hematologia: fundamentos e pratica. São Paulo: Atheneu, 2001. 1081p.
Publication Dates
-
Publication in this collection
May-Jun 2014
History
-
Received
29 Mar 2014 -
Reviewed
06 Apr 2014 -
Accepted
11 Apr 2014