Abstract
Recent studies underline that simple and non-invasive retrofit solutions can recover natural ventilation potential in existing buildings under temperate climate. Nonetheless, the efficiency of these solutions in dense urban contexts under hot and humid climate remains unclear. This paper aims to evaluate the thermal comfort gains caused by natural ventilation when retrofitting an office building in downtown Rio de Janeiro. Computational Fluid Dynamics (CFD) and thermal simulations are carried out on Ansys CFX and Design builder to assess indoor air flow before and after retrofit. The diagnosis of the current scenario indicates that the surrounding buildings block a significant part of the wind flow, and occupants experience only a few hours of thermal comfort during the year, especially on lower floors. To increase indoor air flow, the fixed upper windows were transformed into pivot windows and kept open permanently. This measure increases the annual hours of thermal comfort by 0.5-35%, depending on the floor and the adaptive comfort model. These findings suggest that natural ventilation itself may not be sufficient to ensure occupants' comfort throughout the year under the investigated context.
Keywords:
Natural ventilation; Urban canyon; Thermal comfort; Retrofit; Adaptive thermal comfort model
Resumo
Estudos recentes evidenciam que soluções arquitetônicas simples e não invasivas possibilitam recuperar o potencial de ventilação natural na reabilitação de edifícios em clima temperado. No entanto, a eficiência destas soluções em meios urbanos densos e clima quente e úmido ainda não foi investigada. Este artigo objetiva avaliar os benefícios para o conforto térmico decorrente da ventilação natural na reabilitação de um edifício de escritórios situado no centro do Rio de Janeiro. Simulações computacionais térmicas e fluidodinâmicas (CFD) são realizadas com os softwares Design builder e Ansys CFX para avaliar a circulação internas dos ventos antes e após reabilitação. O diagnóstico do cenário atual indica que o entorno bloqueia uma parcela significativa dos ventos, comprometendo o conforto térmico na maior parte do ano, sobretudo nos andares mais baixos. Para aumentar a vazão de ar interna, as bandeirolas fixas foram transformadas em janelas pivotantes e mantidas abertas permanentemente. Esta medida aumenta em 0,5-35% as horas anuais de conforto térmico, a depender do pavimento e do modelo de conforto adaptativo, o que indica que a ventilação natural por si só não é suficiente para garantir o conforto térmico dos usuários por todo o ano no contexto em questão.
Palavras-chave:
Ventilação natural; Cânions urbanos; Conforto térmico; Reabilitação; Modelo de conforto adaptativo
Introduction
Several studies demonstrate that city densification contributes to reducing urban environmental quality (LEITE, 2008LEITE, C. G. L. Alterações da ventilação urbana frente ao processo de verticalização de avenidas litorâneas: o caso da Avenida Litorânea de São Luis/MA. São Paulo, 2008. Dissertação ( Mestrado emArquitetura ) - Faculdade de Arquitetura e Urbanismo, Universidade de São Paulo, São Paulo, 2008. ; NG, 2010NG, E. (ed.) Designing high-density cities for social and environmental sustainability. London: Earthscan, 2010. ; GONÇALVES et al., 2011GONÇALVES, J. C. S. et al. The environmental performance of high-density urban living: with reference to the city centre of São Paulo. In: Conference of Passive and Low Energy Architecture, 27., Louvain-la-Neuve, 2011. Proceedings …Louvain-la-Neuve, 2011.). The lack of green areas and the increment of surfaces’ solar absorbance, anthropogenic heat, and urban canyons are just some factors that induce the heat island effect (NAKATA-OSAKI; SOUZA; RODRIGUES, 2016NAKATA-OSAKI, C. M.; SOUZA, L. C. L. de; RODRIGUES, D. S. Impacto da geometria do cânion urbano na intensidade de ilha de calor noturna: análise através de um modelo simplificado adaptado a um SIG. Ambiente Construído , Porto Alegre, v. 16, n. 3, p. 73-87, jul./set. 2016.; ALCHAPAR; PEZZUTO; CORREA, 2018ALCHAPAR, N. L.; PEZZUTO, C. C.; CORREA, E. N. Parámetros urbanos morfo-materiales y su correlación com las temperaturas de aire em verano. Ambiente Construído, Porto Alegre, v. 18, n. 4, p. 199-213, out./dez. 2018. ), which can increase the air temperature in 15ºC compared to rural areas (SANTAMOURIS et al., 2001SANTAMOURIS, M. et al. On the impact of urban climate on the energy consumption of buildings. Solar Energy, v. 70, n. 3, p. 201-216, 2001. ).
The expansion of high-rise buildings with reduced spacing tends to minimize the urban fabric air porosity (GONÇALVES et al., 2011GONÇALVES, J. C. S. et al. The environmental performance of high-density urban living: with reference to the city centre of São Paulo. In: Conference of Passive and Low Energy Architecture, 27., Louvain-la-Neuve, 2011. Proceedings …Louvain-la-Neuve, 2011.; TORK; TIBIRIÇÁ; TIBIRIÇÁ, 2017TORK, L. D.; TIBIRIÇÁ, A. C. G.; TIBIRIÇÁ, A. M. B. Análise da ventilação natural conforme planos diretores: resultados de pesquisa em Belém, PA. Ambiente Construido, Porto Alegre, v. 17, n. 1, p. 329-351, jan./mar. 2017.). As a result, air velocity and the differential pressure between facades are reduced, and stagnation zones become predominant in urban areas (NG; WONG, 2005NG, E.; WONG, H-H. Building heights and better ventilated design for high density cities. In: CONFERENCE ON PASSIVE AND LOW ENERGY ARCHITECTURE, 22., Beirut, 2005. Proceedings … Beirut, 2005. ; FONTENELLE; LORENTE; BASTOS, 2015FONTENELLE, M. R.; LORENTE, S.; BASTOS, L. E. G. Impact of urbanization on air flow pattern: the case of Rio de Janeiro. International Journal of Green Energy, v. 12, p. 908-916, 2015.). Santamouris et al. (2001SANTAMOURIS, M. et al. On the impact of urban climate on the energy consumption of buildings. Solar Energy, v. 70, n. 3, p. 201-216, 2001. ) attest that in certain regions, air velocity is reduced by up to 10 times. On the other hand, there are also evidences that some urban configurations may cause pedestrian discomfort due to high wind speed. Hu and Yoshie (2013HU, T.; YOSHIE, R. Indices to evaluate ventilation efficiency in newly-built urban area at pedestrian level. Journal of Wind Engineering & Industrial Aerodynamics, v. 112, p. 29-51, 2013.) underline the channeling effect produced by an air flow parallel to the street axis in uniform building height arrays.
The reduction of urban environmental quality has dramatically influenced buildings’ performance, inducing a gradual replacement of natural ventilation by air conditioning. Although the latter provides steady indoor air temperature, occupants may report more respiratory disease symptoms in refrigerated spaces (MENDELL, 1996MENDELL, M. J. et al. Elevated symptom prevalence associated with ventilation type in office building. Epidemiology, v. 7, n. 6, p. 583-589, 1996.; YU et al., 2009YU, B. F. et al. Review of research on air-conditioning systems and indoor air quality control for human health. International Journal of Refrigeration, v. 32, n. 1, p. 3-20, 2009.; CHEUNG; JIM, 2019CHEUNG, P. K.; JIM, C. Y. Impacts of air conditioning on air quality in tiny homes in Hong Kong. Science of the Total Environment, v. 684, p. 434-444, 2019. ) and become less tolerant of indoor and outdoor hygrothermal variations (HUMPHREYS; RIJAL; NICOL, 2013HUMPHREYS, M. A.; RIJAL, H. B.; NICOL, J. F. Updating the adaptive relation between climate and comfort indoors: new insights and an extended database. Building and Environment, v. 63, p. 40-55, 2013.; GONÇALVES; BODE, 2015GONÇALVES, J. C. S.; BODE, K. (org). Edifício ambiental. São Paulo: Oficina de Textos, 2015.). In addition, cooling systems consume respectively 20% and 40% of the total energy used in residential and commercial buildings in Brazil (ELETROBRAS, 2006aELETROBRAS. Avaliação do mercado de eficiência energética no Brasil. Pesquisa de posse de equipamento e hábitos de uso - ano base 2005. Classe residencial. Rio de Janeiro: ELETROBRAS, 2006a., 2006bELETROBRAS. Avaliação do mercado de eficiência energética no Brasil. Pesquisa de posse de equipamento e hábitos de uso - ano base 2005 . Classe comercial. Rio de Janeiro: ELETROBRAS , 2006b.).
Retrofitting is an essential practice to readapt the building stock to its constant surroundings’ transformations and recover its natural ventilation potential (FONTENELLE, 2016FONTENELLE, M. R. A ventilação natural na reabilitação de edifícios de escritório em meios urbanos densos: desafios e potencialidades. Rio de Janeiro, 2016. Phd thesis. Faculty of Architecture and Urbanism. Universidade Federal do Rio de Janeiro, Rio de Janeiro, 2016.). Nonetheless, recovering natural ventilation in existing buildings is a challenging task. In contrast to new constructions, several design variables are already defined in existing buildings, such as its placement and form, the position and dimension of openings, and internal layout. This task is even more complex when preserving the envelope’s original characteristics is a concern, as in historical buildings (TURI et al., 2017TURI, S. D. et al. Recovery of ancient bioclimatic strategies for energy retrofit in historical buildings: the case of the Infants’ Tower in the Alhambra. Energy Procedia, v. 133, p. 300-311, 2017.)
In the last 20 years, numerous studies have focused on passive strategies for existing buildings to reduce its energy consumption and the overheating effects in summer due to excessive thermal insulation. In projects such as IEA Annex 35 (INTERNATIONAL…, 2018aINTERNATIONAL ENERGY AGENCY. IEA Energy in Buildings and Community Programme (EBC). Available: http://www.iea-ebc.org/projects/project?AnnexID=35. Access: 18 jan. 2018a.
http://www.iea-ebc.org/projects/project?...
), Revival (GAUDIN; GAUDIN, 2006GAUDIN, T.; GAUDIN, G. Sustainable refurbishment of large tertiary buildings from the post-war: prioritizing of thermal comfort in summer. In: CLIMAMED - CONGRÈS MÉDITERRANÉEN DES CLIMATICIENS, Lyon, 2006. Proceedings … Lyon, 2006.), School Vent Cool (ERACOBUILD, 2018ERACOBUILD. School Vent Cool: Ventilation, Cooling and Strategies for high performance school renovations. Available: http://www.schoolventcool.eu. Access: 18 jan. 2018.
http://www.schoolventcool.eu...
), and IEA Annex 62 (INTERNATIONAL…, 2018bINTERNATIONAL ENERGY AGENCY. IEA Energy in Buildings and Community Programme (EBC) .Available: http://www.iea-ebc.org/projects/project?AnnexID=62. Access: 18 jan. 2018b.
http://www.iea-ebc.org/projects/project?...
), hybrid ventilation emerges as one of the most efficient systems for different climatic contexts, since it combines all the best features of natural and mechanical ventilation to promote thermal comfort and indoor air quality throughout the year.
However, recent studies still emphasize natural ventilation potential for existing buildings and the high performance and cost-efficiency of simple and non-invasive solutions such as the operation and upgrade of original windows (LINDEN et al., 2016LINDEN, P. et al. Natural ventilation for energy savings in California Commercial Buildings. Final Project Report. San Diego: UC San Diego, 2016.).
O’Donavan, O’Sullivan, and Murphy (2017O’DONOVAN, A.; O’SULLIVAN, P. D.; MURPHY, M. D. A field study of thermal comfort performance for a slotted louvre ventilation system in a low energy retrofit. Energy and Buildings , v. 135, p. 312-323, 2017.) present a refurbished office building in Ireland that reduced energy consumption by replacing its original glazing windows for a new model with slotted louvre opening sections. Without changing the window-to-wall ratio (WWR) and the facades’ main features, satisfactory indoor air change could be reached by the different possibilities of the louvre’s operation.
Turiet al. (2017TURI, S. D. et al. Recovery of ancient bioclimatic strategies for energy retrofit in historical buildings: the case of the Infants’ Tower in the Alhambra. Energy Procedia, v. 133, p. 300-311, 2017.) also highlight the influence of windows’ operation on recovering the natural ventilation efficiency of the Infants’ Tower in Alhambra. The study underlines the importance of the original celosías for the energy and thermal comfort upgrading during summer, and defend an in-depth investigation of passive strategies to reduce the installation of invasive plant solutions.
Calcerano, Cecchini, and Martinelli (2017CALCERANO, F.; CECCHINI, C.; MARTINELLI, L. Numerical analysis of passive strategies for energy retrofit of existing buildings in Mediterranean climate: thermal massa and natural ventilation combination. Sustainable Buildings, v. 2, n. 4, 2017. ) emphasize automatic control can increase natural ventilation efficiency if this system takes into consideration users’ needs, enabling to reduce over 68% of discomfort hours and energy consumption for different climatic conditions in Italy.
The mentioned studies assess the performance of natural ventilation solutions in urban or rural areas with high air porosity and under temperate climate. Nonetheless, the feasibility of recovering natural ventilation in the built stock of dense urban contexts under hot and humid climate remains unclear. Although the summer period is under investigation in most of these studies, the analyzed temperature range does not meet tropical climatic conditions.
When analyzing thermal comfort gains generated by natural ventilation strategies, one should pay attention to the adaptive thermal comfort model adopted for the investigation. The existing models differ significantly, especially in terms of the comfort temperature range extension, which can dramatically influence the interpretation of results.
Pereira and Assis (2010PEREIRA, I. M.; ASSIS, E. S. de. Avaliação de modelos de índices adaptativos para uso no projeto arquitetônico bioclimático. Ambiente Construído , Porto Alegre, v. 10, n. 1, p. 31-51, jan./mar. 2010. ) compare the adaptive models of Auliciems (1981AULICIEMS, A. Psycho-Pshysiological criteria flor global thermal zones of building design. International Journal of Biometeorology, v. 25, n. 2, p. 109-122 1981.), Humphreys (1978HUMPHREYS, M. A. Outdoor temperatures and comfort indoors. Building Research and Practice, v. 6 p. 92-105, 1978), Nicol and Humphreys (2002NICOL, J. F.; HUMPHREYS, M. A. Adaptive thermal comfort and sustainable thermal standards for buildings. Energy and Buildings , v. 34, n. 6, p. 563-572, jul. 2002.) and De Dear and Brager (2001DE DEAR, R.; BRAGER, G. S. The adaptive model of thermal comfort and energy conservation in the built environment. International Journal of Biometeorology , v. 45 p. 100-108, 2001. ) considering the results from regional Brazilian studies in different climatic regions (Fortaleza, Belo Horizonte, and Florianópolis). Although the Bioclimatic Zone 8 (which includes Rio de Janeiro and Fortaleza) was taken into consideration, the suitability of those models to Rio de Janeiro’s climatic context remains unknown.
In order to fill the underlined gaps, this paper aimed to evaluate the thermal comfort gains caused by natural ventilation when retrofitting the windows of an office building in a dense urban area under hot and humid climate. Three adaptive models were investigated to identify which one best suit Rio de Janeiro’s climatic context.
Materials and methods
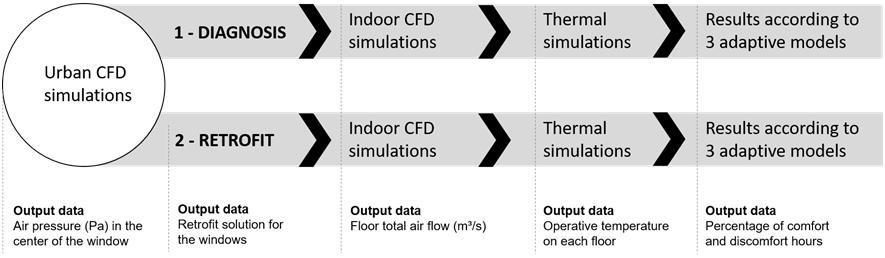
The methodology included two stages: diagnosis and retrofit. The diagnosis consists of assessing the air flow within the urban fabric and the building in the current scenario. Based on the diagnosis, a retrofit proposes an architectural solution to enhance building natural ventilation potential. The two stages included CFD and thermal simulations, considering the building itself and its surrounding buildings. In the diagnosis stage, urban CFD simulations were performed to identify the impact of surrounding obstacles on the air flow around the building. Based on the air pressure on facades (Pa), indoor CFD simulations were carried out to calculate air flow and air change rate within the building before and after the retrofit. The output data was used in thermal simulations to estimate operative temperatures on each floor (Figure 1).
Based on the operative temperature, three adaptive models were used to calculate the percentage of thermal comfort hours per floor before and after retrofit. The three adaptive comfort models were applied to verify which one best suits Rio de Janeiro’s climatic context.
Urban and indoor simulations were uncoupled due to the complexity of generating a mesh for two such different scales. The acceptable porosity rate - namely the effective opening for wind catchment in all facades, considering the windows opening systems - for uncoupling simulations varied between 20 and 25% (STRAATEN, 1967STRAATEN, V. Thermal performance of buildings. Amsterdam: Elsevier, 1967.; CARRILHO-DA-GRAÇA et al., 2002CARRILHO-DA-GRAÇA, G. et al. Simulation of Wind driven ventilative cooling systems for an apartment building in Beijing and Shanghai. Energy and Buildings, v. 34, n. 1, p. 1-11, 2002.). The building’s facades porosity is equal to 17%.
The next sections present the building and its climatic and urban context, the simulations input data, and the thermal adaptive comfort models that guided the analysis.
Case study
The object of this study consists of a ten-story office building constructed in stages between 1922 and 1959. The Galeria Building is located in downtown Rio de Janeiro, where buildings of varying heights (20-181 meters) compose urban canyons with aspect ratios (H/W) ranging from 3 to 7 (Figure 2).
An insurance company occupied the building until 2011, when a retrofit was carried out to convert it into an office building. Today, eight floors accommodate open-plan offices with total area ranging from 1,700 m² to 3,084 m² (Figure 3). The ground floor and the first floor are occupied by a mall, a reception, and some administrative offices, while a technical floor is located on the 10th floor.
-
before retrofit: original windows were kept open during occupation (8 AM until 7 PM); and
-
after retrofit: the fixed upper windows were transformed into pivot windows, which were kept open permanently. In this scenario, by increasing 33% (A) and 38% (B) of the opening permeable area, we expected to increase the air flow and dissipate heat gains at night.
The retrofit preserved many of its original architectural characteristics, including most of the windows. Although the building was designed to use natural ventilation, air conditioning is currently the primary thermal comfort strategy in the building.


To investigate other solutions to recover natural ventilation in all office floors, we proposed to assess the indoor air flow, considering two scenarios (Figure 4).

Climatic context
Rio de Janeiro (Latitude 22º54' S / Longitude 43º12' O, Bioclimatic Zone 8) presents a hot and humid climate, characterized by an average temperature ranging from 18°C to 30°C, and an average relative humidity between 77% and 80%. The mean thermal amplitude is 7ºC. These climatic characteristics offer a discomfort condition for almost 80% of the annual hours, from which 65% are due to heat. Natural ventilation and thermal mass are recommended for 61% and 15% of the annual hours, respectively, while air conditioning is indicated for only 3% of the year (GOULART; LAMBERTS; FIRMINO, 1998GOULART, S.; LAMBERTS, R.; FIRMINO, S. Dados climáticos para projeto e avaliação energética de edificações para 14 cidades brasileiras. Florianópolis: Núcleo de Pesquisa em Construção/UFSC, 1998.).
According to the annual meteorological data from Santos Dumont Airport (INSTITUTO…, 2015INSTITUTO NACIONAL DE PESQUISAS ESPACIAIS. Banco de dados dos ventos no Rio de Janeiro: estação Santos Dumont. Available: http://bancodedados.cptec.inpe.br/downloadBDM/consulta.jsp. Access: 10 jan. 2015.
http://bancodedados.cptec.inpe.br/downlo...
), located 900 m away from the study area, the prevailing wind comes from Southeast (azimuth 160º). It reaches an average speed of 5 m/s at 10m above ground level. This direction is more frequent in the afternoon in all seasons. In the morning, the prevailing wind comes from North (0° azimuth), reaching 2 to 3 m/s along the seasons. Between 12 AM and 2 PM, a transition occurs.
Urban CFD simulations
Through the commercial CFD code Ansys CFX 14.5, three-dimensional and stationary simulations of a single-phase incompressible flow were performed.
The choice among CFD methods considered a compromise between accuracy and computational demand. We adopted the standard k-ε turbulence model since it has proven to be quite stable for urban simulations (COST, 2007COST. Best practice guideline for the CFD simulation of flows in the urban environment. Brussels: COST OFFICE, 2007. ). It is known that the standard k-ε turbulence model overestimates the k value in the impinging region and cannot capture accurate separation and reattachment. Nonetheless, it requires less computational resources (SEIFERT et al., 2006SEIFERT, J. et al. Calculation of wind driven cross ventilation in building with large opening. Journal of Wind Engineering and Industrial Aerodynamics, v. 94, p. 925-947, 2006.). In this study, Navier-Stoke equations were discretized by the first-order method.
The geometry was modeled on CAD format and exported to Ansys CFX. To render simulation feasible, the urban fabric was simplified by gathering buildings set side by side in a single block. The volume height was calculated using the building weighted average height. Obstacles whose heights significantly exceed the average height of the block are represented separately and added to the main volume of its respective blocks (Figure 5).

Since simulations consider two wind directions, we adopted a circular domain, measuring 5085m of diameter and 912m high. As recommended by Cost (2007COST. Best practice guideline for the CFD simulation of flows in the urban environment. Brussels: COST OFFICE, 2007. ), the buildings set is placed 15Hmax from the boundary lateral and 5Hmax from the top, where Hmax is the maximum building height. This corresponds to a blockage area of 1%.
We assumed a wind profile based on the ASHRAE model (AMERICAN…, 2001AMERICAN SOCIETYOF HEATING, REFRIGERATINF AND AIR-CONDITIONING ENGINEERS. ASHRAE Handbook: fundamentals . Atlanta, 2001. ) and described by Equation 1.
Where:
UH is the approach wind speed at upwind wall height H (m/s);
Umet is the hourly wind speed from a nearby meteorological station (m/s);
δ is the wind boundary layer thickness for the local building terrain (m);
δmet is the wind boundary layer thickness for the meteorological station (m);
H is the height above the ground for the local building terrain (m);
Hmet is the meteorological station height (m);
α is the exponent for the local building terrain; and
αmet is the exponent for the meteorological station.
The wind speed and direction were obtained from Table 1 and the exponents' parameters α (0.33), αmet (0.14), δ (460) and δmet (270), from ASHRAE (AMERICAN…, 2001AMERICAN SOCIETYOF HEATING, REFRIGERATINF AND AIR-CONDITIONING ENGINEERS. ASHRAE Handbook: fundamentals . Atlanta, 2001. ).
A free slip condition was assumed for the top boundary, while a no-slip condition was considered for the buildings and the ground.
A tetrahedral mesh was created for the computational domain as a whole, while a prismatic mesh was applied for the ground and the building's faces (no-slip condition). An independence test was carried out to ensure acceptable mesh quality by varying the “inflation” parameters until air pressure, wind speed, and air flow rates reached stability and mesh quality metrics met all the recommendations established by ESSS (ENGINEERING…, 2013ENGINEERING SIMULATION AND SCIENTIFIC SOFTWARE. Introdução à simulação Fluidodinâmica: teoria de CFD e aplicações com ANSYS CFX. Rio de Janeiro: ESSS, 2013. ). The final mesh presented an orthogonal quality of 0.20, a skewness of 0.82, and an aspect ratio of 50.22. Yplus - the dimensionless distance from the wall - did not exceed 300, respecting recommendations from Blocken, Stathopoulos, and Carmeliet (2007BLOCKEN, B.; STATHOPOULOS, T.; CARMELIET, J. CFD Simulation of the Atmospheric boundary layer: wall function problems. Atmospheric Environment, v. 41, n. 2, p. 238-252, 2007.). The total number of elements was 2,900,000.
Table 1 presents eleven simulation scenarios obtained when grouping similar wind conditions. Simulations achieved a residual level of 1x10⁻⁴ after 90 iterations.
Indoor CFD simulations
Indoor CFD simulations were performed to assess indoor air flow on three floors: 2nd, 6th, and 9th. Each simulation analyzes the air flow on a floor at a time. In this step, we also carried out three-dimensional and stationary simulations of a single-phase incompressible flow, and we adopted the standard k-ε turbulence model.
The floor geometry, modeled in Autocad and exported to Ansys CFX, represents the indoor air volume, excluding the building core, stair, and columns (Figure 6). The facades' opening area is the only aspect that varied in simulations.
The computational domain corresponds to the floor volume itself. Walls, floors, and ceilings are indicated as non-slip condition, while windows faces are assumed as openings, where air intake and exhaustion occur.
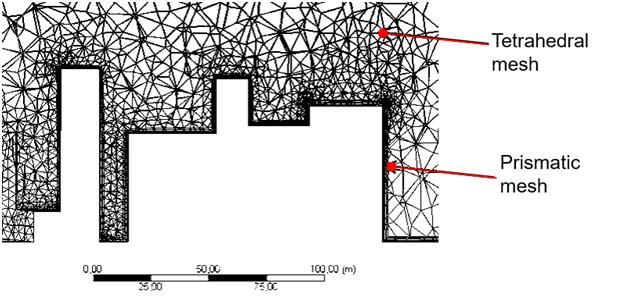
For each geometry, a tetrahedral mesh was generated for the entire domain, and a prismatic mesh was created near the no-slip condition faces (all faces excluding openings) (Figure 7). In this case, the "first layer thickness" parameter was used to generate the inflation layer (prisms), which enables to obtain a compromise between quality and good computational demand at this scale. An independence test was carried out to ensure acceptable mesh quality, following the same methodology of the urban simulations. The orthogonal quality was higher than 0.17 in all cases, while the skewness remained around 0.89, and the aspect ratio was between 48 and 69. These parameters are satisfactory, according to ESSS (ENGINEERING…, 2013ENGINEERING SIMULATION AND SCIENTIFIC SOFTWARE. Introdução à simulação Fluidodinâmica: teoria de CFD e aplicações com ANSYS CFX. Rio de Janeiro: ESSS, 2013. ). AYplus lower than 250 in the three cases also points out a good quality mesh (BLOCKEN; STATHOPOULOS; CARMELIET, 2007BLOCKEN, B.; STATHOPOULOS, T.; CARMELIET, J. CFD Simulation of the Atmospheric boundary layer: wall function problems. Atmospheric Environment, v. 41, n. 2, p. 238-252, 2007.). The total number of mesh was approximately 2,056,000 for the 2nd floor, 2,939,000 for 6th, and 3,217,000 for the 9th floor.


Air pressure (Pa) in facades, obtained from the urban simulations, were indicated for each window (opening condition). The wind direction was set as normal to the facade, even for cases in which the incidence occurs practically tangent to the opening since the software does not accept tangent direction. A tangent incidence promotes very complex entrance conditions and reduces the effective porosity area (GOULDING; LEWIS; STEEMERS, 1992GOULDING, J. R.; LEWIS, J. O.; STEEMERS, T. C. (ed.) Energy in architecture: the European passive solar handbook. London: Commission of European Communities, 1992. ). Nevertheless, it is known that when there is a pressure difference between exterior and interior, the wind penetrates the building.
Indoor CFD simulations provided the inlet mass flow rate (kg/s) per floor. This data was converted into volumetric flow (considering a specific mass of the air at 30ºC - 1,165 kg/m³) and then into air change rate (flow rate/floor level volume), which is required for thermal simulations.
Indoor thermal simulations
Thermal simulations were carried out using DesignBuilder 4.5, a software that performs building energy analysis, considering local climatic data and building attributes such as construction materials, occupancy, and operation.
For the thermal simulations, we modeled a geometry composed by Galeria Building and nearby obstacles. Surrounding buildings were taken into account only to consider the shading effects in Galeria facades. Therefore, they were indicated as adiabatic blocks.
To simulate both scenarios - before and after retrofit - all construction, occupancy, and operation parameters (Table 2) were kept constant, varying only the design of the openings and the air change rate in each zone, based on the results of indoor CFD simulations. Since natural ventilation is the only cooling strategy in the building, HVAC systems were all disabled.
Considering the low variation of air pressure values between the 2nd and the 5th floor, we indicated for all of them the air change rate calculated for the 2nd floor. Likewise, air change rates were equivalent for the 6th and 7th floor and the 8th and 9th floor. The 10th floor (technical floor) remained sealed. A schedule specified annual air change rate variation.
The primary output data was the hourly operative temperature on the 2nd, 6th, and 9th floor. Operative temperatures were compared to the neutral temperature ranges of three adaptive models of thermal comfort to calculate the number of hours per year in which natural ventilation by itself ensures thermal comfort for most of the occupants.
Adaptive models of thermal comfort
To analyze the percentage of annual hours before and after retrofit, we chose three different adaptive models: De Dear and Brager (2001DE DEAR, R.; BRAGER, G. S. The adaptive model of thermal comfort and energy conservation in the built environment. International Journal of Biometeorology , v. 45 p. 100-108, 2001. ), Humphreys, Rijal and Nicol(2013HUMPHREYS, M. A.; RIJAL, H. B.; NICOL, J. F. Updating the adaptive relation between climate and comfort indoors: new insights and an extended database. Building and Environment, v. 63, p. 40-55, 2013.), and Toe and Kubota model (2013TOE, D. H.; KUBOTA, T. Development of an adaptive thermal comfort equation for naturally ventilated buildings in hot-humid climates using ASHRAE RP-884 database. Frontiers of Architectural Research, v. 2, p. 278-291, 2013.). The first one guides ASHRAE 55 (AMERICAN…, 2004AMERICAN SOCIETYOF HEATING, REFRIGERATINF AND AIR-CONDITIONING ENGINEERS. ASHRAE Standard 55: Thermal Environmental Conditions for Human Occupancy. Atlanta, 2004. ), and it is largely adopted in thermal comfort studies. The second one is a revision of the original equation (HUMPHREYS, 1978HUMPHREYS, M. A. Outdoor temperatures and comfort indoors. Building Research and Practice, v. 6 p. 92-105, 1978), indicated by Pereira and Assis (2010PEREIRA, I. M.; ASSIS, E. S. de. Avaliação de modelos de índices adaptativos para uso no projeto arquitetônico bioclimático. Ambiente Construído , Porto Alegre, v. 10, n. 1, p. 31-51, jan./mar. 2010. ) as a suitable model for Fortaleza-CE (Bioclimatic Zone 8). The third one proposes a specific adaptive model to the hot and humid climate, based on the ASHRAE RP-884 database for this climatic context.
The De Dear and Brager model is described by Equation 2:
Tn is the Neutral temperature, and Tmm is the mean monthly outdoor air temperature. A variation of ± 3.5ºC and ± 2.5ºC from neutral temperature is accepted for 80 and 90% of the occupants, respectively. In this paper, the comfort temperature range corresponds to 80% of the occupants satisfied, which is equivalent to the average annual thermal amplitude of Rio de Janeiro (6.9ºC) (GOULART; LAMBERTS; FIRMINO, 1998GOULART, S.; LAMBERTS, R.; FIRMINO, S. Dados climáticos para projeto e avaliação energética de edificações para 14 cidades brasileiras. Florianópolis: Núcleo de Pesquisa em Construção/UFSC, 1998.).
Humphreys, Rijal and Nicol(2013HUMPHREYS, M. A.; RIJAL, H. B.; NICOL, J. F. Updating the adaptive relation between climate and comfort indoors: new insights and an extended database. Building and Environment, v. 63, p. 40-55, 2013.) model is based on Equations 3 and 4:
In this model, an exponentially weighted running mean temperature (Trm) is used to predict the neutral temperature, which is based on the influence of thermal experiences. Tm is the mean monthly outdoor air temperature. The neutral temperature range is calculated by multiplying ±0.02 and Trm instead of a fixed temperature range, as proposed by the previous model.
In Toe and Kubota’s (2013TOE, D. H.; KUBOTA, T. Development of an adaptive thermal comfort equation for naturally ventilated buildings in hot-humid climates using ASHRAE RP-884 database. Frontiers of Architectural Research, v. 2, p. 278-291, 2013.) model, the neutral temperature is calculated considering two variables: the daily mean outdoor air temperature (Tdm) and the indoor air velocity. The inclusion of this second factor comes from the observation that the occupants' tolerance at high temperatures increases with the air velocity due to the heat losses generated by evapotranspiration.
Three equations are proposed for different groups of air velocity:
Low air velocity (V < 0.3 m/s)(Equation 5):
Moderate air velocity (0.3 ≤ V < 0.65 m/s) (Equation 6):
High air velocity (V ≥ 0.65 m/s) (Equation 7):
WhereTdm - Daily mean outdoor air temperature, a 24h average of the observed outdoor air temperature for each day with a minimum of four observations per day.
In this study, the equation varies according to the average speed calculated in a horizontal plane at 0.75m from the ground (work plan).
In this model, an upper comfort operative temperature limit is recommended not to exceed 0.7ºC below the predicted neutral operative temperature so that at least 80% of the occupants are in comfort condition. No lower comfort limit is indicated for the hot-humid climate.
In this study, operative temperatures above the upper comfort line indicate a discomfort condition due to heat, whereas temperatures below the lower line point out discomfort due to cold.
Results and discussion
CFD urban simulations
The simulations indicated that, for the same wind direction, the wind speed at 10m high practically only influenced the results in quantitative terms. In this sense, results are presented through a single sequence of images, followed by different legends regarding each season. Due to their relevance, the simulations representing the occupation period (8 AM-7 PM, weekdays) were chosen to illustrate part of the results for urban CFD simulations.
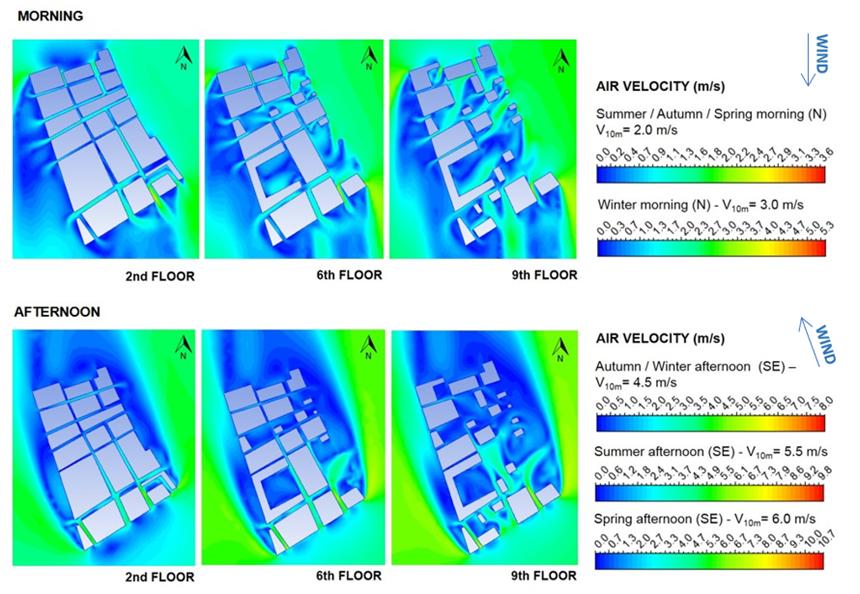
Urban CFD simulations pointed out that the surrounding obstacles affect the air velocity in the study area (Figure 8). On the 2nd floor level, it is clear that the average wind speed is higher in the morning compared to the afternoon, since oblique incoming wind flow benefits both longitudinal and transversal streets, as predicted by Lee and Wong (2014LEE, R-X.; WONG, N-H. A parametric study of Gross Building Coverage Ratio (GBCR) variation on outdoor ventilation in Singapore’s high-rise residential estates. Journal of Civil Engineering and Science, v. 3, n. 2, p. 92-116, 2014.). In the afternoon, the wind flow coincides with the longitudinal streets’ axis, forming a channeling effect that contrasts with the stagnation zones in transversal streets.
On the upper floors, wind speed reaches higher levels, as the urban fabric porosity increases. In contrast, courtyard configurations form stagnation zones, especially in the afternoon. A similar air flow pattern is described by Lee and Wong (2014LEE, R-X.; WONG, N-H. A parametric study of Gross Building Coverage Ratio (GBCR) variation on outdoor ventilation in Singapore’s high-rise residential estates. Journal of Civil Engineering and Science, v. 3, n. 2, p. 92-116, 2014.).
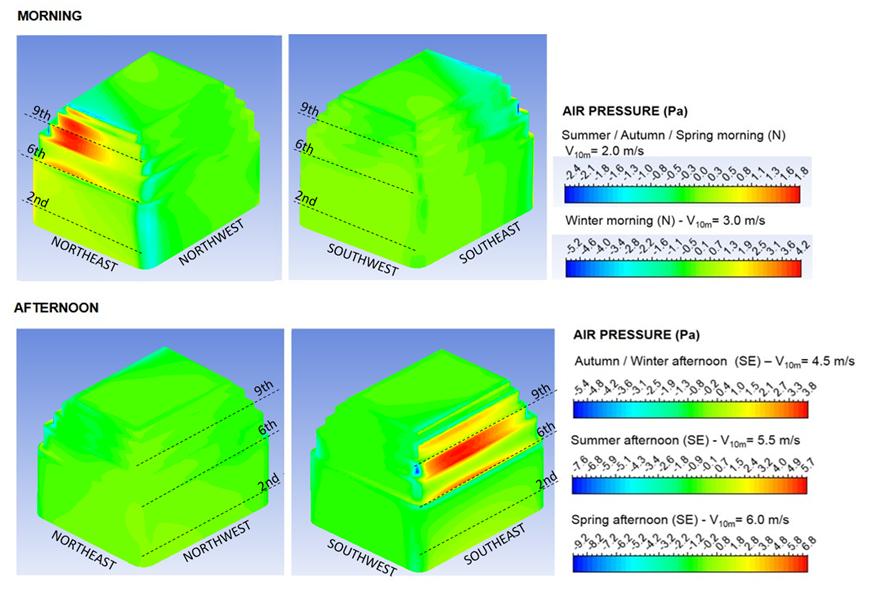
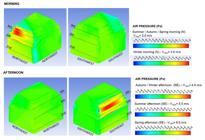
On the 6th and 9th floor level, some obstacles redirect the wind flow, causing an oblique incidence on Galeria facades (Figure 9). Surrounding buildings generate a visible air pressure contrast between windward facades both in the morning and in the afternoon. Also, the main windward facade varies on each floor: in the morning, more intense winds achieve Northwest facades on the 2nd and 6th floor, and Northeast facade on the 9th floor. These variations would not happen if the Galeria Building was isolated, which indicates the importance of contextualizing climate data during the diagnosis phase.
Table 3 indicates air pressure in all facades, considering a point in the center of each opening and the following periods: summer, autumn, and spring (morning) and autumn and winter (afternoon), during occupation (8 AM-7 PM). The maximum differential pressure ((P) between windward and leeward windows is 1.87 Pa (2nd floor), 1.59 Pa (6th floor) and 2.23 Pa (9th floor) in the morning, and 1.09 Pa (2nd floor), 3.46 Pa (6th floor) and 3.39 Pa (9th floor) in the afternoon. The air pressure also varies considerably in the horizontal axis, as observed in low-rise buildings (AMERICAN…, 1997AMERICAN SOCIETYOF HEATING, REFRIGERATINF AND AIR-CONDITIONING ENGINEERS. ASHRAE Handbook: fundamentals. Atlanta, 1997.).

A longitudinal section (Figure 10) highlights that in the morning, air flow is little affected on the 2nd floor, probably due to the channeling effect in Rosario Street (H/W=3) and the descending winds caused by Galeria Building, as described by Blocken and Carmeliet (2004BLOCKEN, B.; CARMELIET, J. Pedestrian wind environment around buildings: literature review and practical examples. Journal of thermal Envelope and Building Science, v. 28, n. 2, p. 107-159, 2004.). The height variation between windward surrounding buildings also favors the urban fabric porosity (NG; WONG, 2005NG, E.; WONG, H-H. Building heights and better ventilated design for high density cities. In: CONFERENCE ON PASSIVE AND LOW ENERGY ARCHITECTURE, 22., Beirut, 2005. Proceedings … Beirut, 2005. ).
In the afternoon, the high aspect ratio (H/W=7) in Ouvidor Street (Southeast facade) and the uniform height of windward surrounding buildings reduce air flow within the urban canyon. When reaching Galeria, the air flow divides into upward and downward directions. The latter reaches the 6th floor and then loses intensity when moving to the ground. Although the wind meets the9th floor without any obstruction, the air pressures are not much higher than that of the 6th floor due to the rising winds at the top of the building.
In summary, the urban simulations underline the high impact of surrounding buildings on the air flow around Galeria, which generates a different natural ventilation potential on each floor.
Indoor CFD simulations
Figure 11 presents the air flow (m³/s) on each floor level for different scenarios and periods. For weekdays, holidays, evenings, and nights, air flow before retrofit is negligible.
In the morning, there is practically no difference between the air flows on the 2nd and 6th floors, as the channeling effect near the Northwest façade and the descending winds caused by Galeria Building generate similar air pressure values for both floors. On the other hand, in the afternoon, a more significant obstruction in the windward facade caused by the height and proximity of surrounding buildings affects natural ventilation on the 2nd floor, as indicated in Figure 10.
In all scenarios, the 9th floor presents the highest air flow during occupation, as a consequence of the high porosity around the top of the building and the largest opening area on this floor. These findings reinforce the idea that in urban areas, air velocity increases with the height above ground, as it is less affected by the surfaces’ roughness (OKE, 1988OKE, T. R. Street design and urban canopy layer climate. Energy and Buildings , v. 11, p. 103-113, 1988.).


In general, the lowest air flow is observed in the morning for all floors, due to the low north wind speed and the incidence angle. When air velocity increases during the winter, the air flow rises at all levels.
In the afternoon, the air flow on the 2nd floor presents an inexpressive variation with the increase of the wind speed, which reveals a reduced coupling between the flow in the boundary layer and within the urban canyon, which usually happens for aspect ratios above 0.65 (OKE, 1988OKE, T. R. Street design and urban canopy layer climate. Energy and Buildings , v. 11, p. 103-113, 1988.).
The air velocity rises by 50% on winter mornings, which increments the office air flow in at least 40%. Winter is the only season where the morning air flow surpasses that of the afternoon on the 2nd and 9th floors.
After retrofit, the air flow increases between 11 to 41% during occupation, as the envelope’s permeable area expands in 33 and 38% when replacing the fixed upper portion by pivot windows. In the mornings and afternoons, the air flow is directly proportional to the distance from the ground in all scenarios. On the other hand, when the building is not occupied, an air flow reduction from the 2nd to the 9th floor is observed.
During occupation, the WWR differences between floors are inexpressive, as the lower number of windows on the upper floors is compensated by a reduced blockage from the surrounding buildings. The 9th floor, for example, presents an opening area 6% lower than the other floors. Therefore, during occupation, the increase of the urban fabric porosity on the upper floors is a preponderant factor in the opening area.
When the building is not occupied, the only windows that remain open (the pivot ones) present the same surface. In this sense, the porosity on the 9th floor is 38% lower than the other floors. This factor becomes preponderant concerning the surrounding buildings' obstruction on the upper floors and results in an air flow reduction of 10-15% comparing the 9th to the 2nd floor. The only exception occurs on weekends and holidays, when the increased air velocity generates higher pressure on the windward facade, recovering the preponderance of the height above ground on the indoor air flow.
Indoor thermal simulations
As expected, thermal simulations attest that natural ventilation generates a frequent oscillation of indoor temperatures, as a direct result of the outdoor thermal variations. Throughout the year, the operative temperature is generally higher than the outdoor temperature and ranges from 18 to 38 °C.
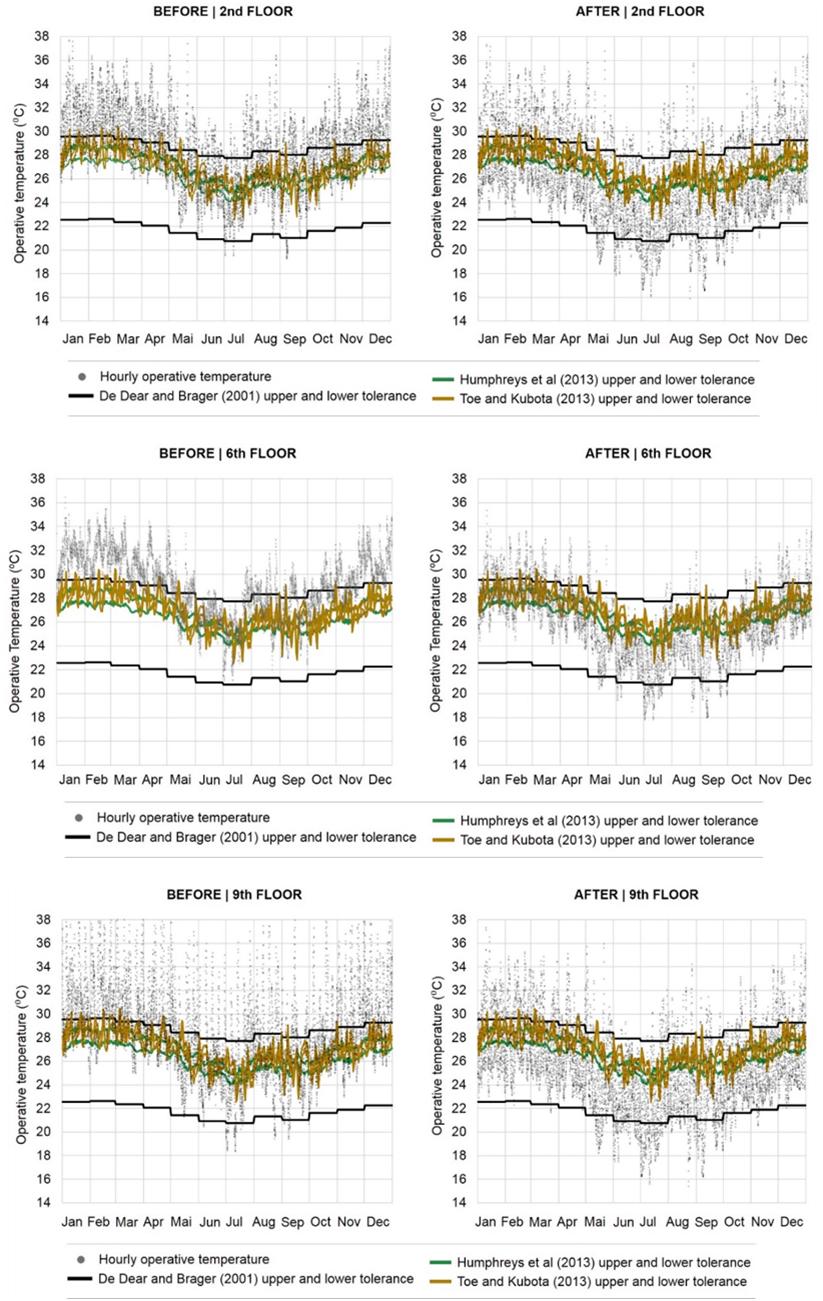
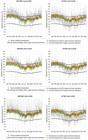
The adoption of night ventilation in the Galeria Building increased the thermal comfort hours during occupation. As indicated in Figure 12, operative temperatures dropped toward comfort temperature ranges after retrofit due to the expansion of the envelope’s permeable area. This is more evident for the De Dear and Brager model, as a result of its wider temperature range. The maximum and minimum operative temperature decreased by 1 and 3ºC, respectively. Thus, discomfort hours by cold increased on all floors, especially during the autumn and the winter.
Figure 13 indicates that after retrofit, comfort hours increased 15-35% for De Dear and Brager model, 2-12% for Humphreys, Rijal and Nicol(2013HUMPHREYS, M. A.; RIJAL, H. B.; NICOL, J. F. Updating the adaptive relation between climate and comfort indoors: new insights and an extended database. Building and Environment, v. 63, p. 40-55, 2013.) model, and 0.5-10% for Toe and Kubota (2013TOE, D. H.; KUBOTA, T. Development of an adaptive thermal comfort equation for naturally ventilated buildings in hot-humid climates using ASHRAE RP-884 database. Frontiers of Architectural Research, v. 2, p. 278-291, 2013.) model.
Natural ventilation benefits are more visible on the 6th floor, which presents an increase of 47% of comfort hours, according to De Dear and Brager’s model. Nevertheless, it also offers an increment of discomfort hours due to cold, especially for Humphreys, Rijal and Nicol(2013HUMPHREYS, M. A.; RIJAL, H. B.; NICOL, J. F. Updating the adaptive relation between climate and comfort indoors: new insights and an extended database. Building and Environment, v. 63, p. 40-55, 2013.) model and Toe and Kubota model, since these models present a narrow comfort temperature range. According to these models, discomfort by cold rose 40 and 51%, respectively.
The operative temperatures decrease generated inexpressive benefits for the 9th floor, according to Humph Humphreys, Rijal and Nicol(2013HUMPHREYS, M. A.; RIJAL, H. B.; NICOL, J. F. Updating the adaptive relation between climate and comfort indoors: new insights and an extended database. Building and Environment, v. 63, p. 40-55, 2013.) (3%) and Toe and Kubota (2013TOE, D. H.; KUBOTA, T. Development of an adaptive thermal comfort equation for naturally ventilated buildings in hot-humid climates using ASHRAE RP-884 database. Frontiers of Architectural Research, v. 2, p. 278-291, 2013.) (1.5%).
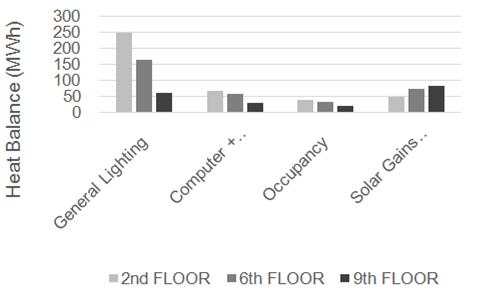
The best performance of the 6th compared to the 9th floor can be justified by the high solar gains at the top of the building (rooftop and facades). The solar gains on the 9th floor are 21% higher than on the 6th floor. The consequent reduction of artificial lighting does not compensate heat absorption by the envelope (Figure 14).


Benefits are less significant on the 2nd floor, which indicates that the increase of the opening area is not advantageous when the outdoor obstruction is considerable.
When comparing the adaptive comfort models, it is clear that De Dear and Brager (2001DE DEAR, R.; BRAGER, G. S. The adaptive model of thermal comfort and energy conservation in the built environment. International Journal of Biometeorology , v. 45 p. 100-108, 2001. ) model is the one that indicates the more significant number of hours within the comfort temperature range. According to this model, discomfort occurs in most cases due to heat.
In contrast, for Humphreys, Rijal and Nicol(2013HUMPHREYS, M. A.; RIJAL, H. B.; NICOL, J. F. Updating the adaptive relation between climate and comfort indoors: new insights and an extended database. Building and Environment, v. 63, p. 40-55, 2013.) and Toe and Kubota (2013TOE, D. H.; KUBOTA, T. Development of an adaptive thermal comfort equation for naturally ventilated buildings in hot-humid climates using ASHRAE RP-884 database. Frontiers of Architectural Research, v. 2, p. 278-291, 2013.) models, a discomfort condition dominates, not only due to heat but also to cold. For these models, relatively high temperatures, such as 24-26 °C, are below the comfort temperature range, indicating thermal discomfort due to cold. This situation occurs even on the 2nd floor, where natural ventilation is more deficient, as indicated by indoor simulations.
The three models indicate a low percentage of comfort hours during the summer, especially on the lower floors. In winter, a divergence between the models is more evident. The De Dear and Brager (2001DE DEAR, R.; BRAGER, G. S. The adaptive model of thermal comfort and energy conservation in the built environment. International Journal of Biometeorology , v. 45 p. 100-108, 2001. ) model indicates up to 73% of comfort hours during this season, while the other ones point out a maximum of 16%, mostly due to cold.
The discomfort condition due to cold indicated by Toe and Kubota (2013TOE, D. H.; KUBOTA, T. Development of an adaptive thermal comfort equation for naturally ventilated buildings in hot-humid climates using ASHRAE RP-884 database. Frontiers of Architectural Research, v. 2, p. 278-291, 2013.) and Humphreys, Rijal and Nicol(2013HUMPHREYS, M. A.; RIJAL, H. B.; NICOL, J. F. Updating the adaptive relation between climate and comfort indoors: new insights and an extended database. Building and Environment, v. 63, p. 40-55, 2013.) models diverges from Rio de Janeiro's bioclimatic chart (LAMBERTS; DUTRA; PEREIRA, 1997LAMBERTS, R.; DUTRA, L.; PEREIRA, F. O. R. Eficiência energética na arquitetura. São Paulo: PW Editores, 1997. ), which establishes a comfort zone limited by dry bulb temperatures varying from 18 to 29 ºC. This range points out tolerance to temperatures lower than those applied by the two models.
Conclusions
This paper emphasized how small interventions on building facades may increase indoor air flow and contribute to dissipating daily heat gains, without renouncing the original envelope characteristics. Its main contributions lie in discussing natural ventilation under three complexities - retrofit, dense urban environments, and hot and humid climate - and indicating a suitable adaptive comfort model to Rio de Janeiro’s climatic context.
In the case study, windows retrofit increased air flow between 11 to 41% during occupation, which raised the thermal comfort hours in 0.5-35%, depending on the adaptive comfort model in question. Night ventilation is a valuable solution in this challenging context since it provides heat gains dissipation and air renewal without interfering occupants' productivity.
Although natural ventilation cannot itself ensure thermal comfort conditions all year round, this strategy must not be neglected, as it offers significant benefits to occupants' health and well-being and may reduce energy consumption. Therefore, hybrid ventilation is a more efficient solution to adapt buildings to annual thermal variations, ensuring its energy efficiency.
The results point out that the floors’ natural ventilation potential should be assessed individually to balance thermal performance between pavements. In other words, uniform cooling solutions should be avoided for buildings in dense urban areas.
The comparative analysis of the three adaptive comfort models emphasizes that it has a massive impact on the interpretation of the thermal simulation results. The De Dear and Brager model adopted by ASHRAE 55 (AMERICAN…, 2004AMERICAN SOCIETYOF HEATING, REFRIGERATINF AND AIR-CONDITIONING ENGINEERS. ASHRAE Standard 55: Thermal Environmental Conditions for Human Occupancy. Atlanta, 2004. ) is, among the three studied, the most appropriate for Rio de Janeiro's climatic context, as its temperature comfort range is similar to the city's thermal amplitude (6.9ºC). Furthermore, this model tends to indicate discomfort conditions more compatible with that reported in Rio de Janeiro's bioclimatic chart.
Acknowledgments
The authors would like to thank CAPES/COFECUB Program (693/10) and FAPERJ for supporting this research.
References
- ALCHAPAR, N. L.; PEZZUTO, C. C.; CORREA, E. N. Parámetros urbanos morfo-materiales y su correlación com las temperaturas de aire em verano. Ambiente Construído, Porto Alegre, v. 18, n. 4, p. 199-213, out./dez. 2018.
- AMERICAN SOCIETYOF HEATING, REFRIGERATINF AND AIR-CONDITIONING ENGINEERS. ASHRAE Handbook: fundamentals. Atlanta, 1997.
- AMERICAN SOCIETYOF HEATING, REFRIGERATINF AND AIR-CONDITIONING ENGINEERS. ASHRAE Handbook: fundamentals . Atlanta, 2001.
- AMERICAN SOCIETYOF HEATING, REFRIGERATINF AND AIR-CONDITIONING ENGINEERS. ASHRAE Standard 55: Thermal Environmental Conditions for Human Occupancy. Atlanta, 2004.
- AULICIEMS, A. Psycho-Pshysiological criteria flor global thermal zones of building design. International Journal of Biometeorology, v. 25, n. 2, p. 109-122 1981.
- BLOCKEN, B.; CARMELIET, J. Pedestrian wind environment around buildings: literature review and practical examples. Journal of thermal Envelope and Building Science, v. 28, n. 2, p. 107-159, 2004.
- BLOCKEN, B.; STATHOPOULOS, T.; CARMELIET, J. CFD Simulation of the Atmospheric boundary layer: wall function problems. Atmospheric Environment, v. 41, n. 2, p. 238-252, 2007.
- CALCERANO, F.; CECCHINI, C.; MARTINELLI, L. Numerical analysis of passive strategies for energy retrofit of existing buildings in Mediterranean climate: thermal massa and natural ventilation combination. Sustainable Buildings, v. 2, n. 4, 2017.
- CARRILHO-DA-GRAÇA, G. et al Simulation of Wind driven ventilative cooling systems for an apartment building in Beijing and Shanghai. Energy and Buildings, v. 34, n. 1, p. 1-11, 2002.
- CHEUNG, P. K.; JIM, C. Y. Impacts of air conditioning on air quality in tiny homes in Hong Kong. Science of the Total Environment, v. 684, p. 434-444, 2019.
- COST. Best practice guideline for the CFD simulation of flows in the urban environment. Brussels: COST OFFICE, 2007.
- DE DEAR, R.; BRAGER, G. S. The adaptive model of thermal comfort and energy conservation in the built environment. International Journal of Biometeorology , v. 45 p. 100-108, 2001.
- ECOTECH. Galeria Building executive project (dwg file). Rio de Janeiro, 2011.
- ELETROBRAS. Avaliação do mercado de eficiência energética no Brasil. Pesquisa de posse de equipamento e hábitos de uso - ano base 2005. Classe residencial. Rio de Janeiro: ELETROBRAS, 2006a.
- ELETROBRAS. Avaliação do mercado de eficiência energética no Brasil. Pesquisa de posse de equipamento e hábitos de uso - ano base 2005 . Classe comercial. Rio de Janeiro: ELETROBRAS , 2006b.
- ENGINEERING SIMULATION AND SCIENTIFIC SOFTWARE. Introdução à simulação Fluidodinâmica: teoria de CFD e aplicações com ANSYS CFX. Rio de Janeiro: ESSS, 2013.
- ERACOBUILD. School Vent Cool: Ventilation, Cooling and Strategies for high performance school renovations. Available: http://www.schoolventcool.eu Access: 18 jan. 2018.
» http://www.schoolventcool.eu - FONTENELLE, M. R. A ventilação natural na reabilitação de edifícios de escritório em meios urbanos densos: desafios e potencialidades. Rio de Janeiro, 2016. Phd thesis. Faculty of Architecture and Urbanism. Universidade Federal do Rio de Janeiro, Rio de Janeiro, 2016.
- FONTENELLE, M. R.; LORENTE, S.; BASTOS, L. E. G. Impact of urbanization on air flow pattern: the case of Rio de Janeiro. International Journal of Green Energy, v. 12, p. 908-916, 2015.
- GAUDIN, T.; GAUDIN, G. Sustainable refurbishment of large tertiary buildings from the post-war: prioritizing of thermal comfort in summer. In: CLIMAMED - CONGRÈS MÉDITERRANÉEN DES CLIMATICIENS, Lyon, 2006. Proceedings … Lyon, 2006.
- GONÇALVES, J. C. S. et al The environmental performance of high-density urban living: with reference to the city centre of São Paulo. In: Conference of Passive and Low Energy Architecture, 27., Louvain-la-Neuve, 2011. Proceedings …Louvain-la-Neuve, 2011.
- GONÇALVES, J. C. S.; BODE, K. (org). Edifício ambiental. São Paulo: Oficina de Textos, 2015.
- GOOGLE. Galeria building. Available: https://www.google.com.br/maps Access: 20 jan. 2017.
» https://www.google.com.br/maps - GOULART, S.; LAMBERTS, R.; FIRMINO, S. Dados climáticos para projeto e avaliação energética de edificações para 14 cidades brasileiras. Florianópolis: Núcleo de Pesquisa em Construção/UFSC, 1998.
- GOULDING, J. R.; LEWIS, J. O.; STEEMERS, T. C. (ed.) Energy in architecture: the European passive solar handbook. London: Commission of European Communities, 1992.
- HU, T.; YOSHIE, R. Indices to evaluate ventilation efficiency in newly-built urban area at pedestrian level. Journal of Wind Engineering & Industrial Aerodynamics, v. 112, p. 29-51, 2013.
- HUMPHREYS, M. A. Outdoor temperatures and comfort indoors. Building Research and Practice, v. 6 p. 92-105, 1978
- HUMPHREYS, M. A.; RIJAL, H. B.; NICOL, J. F. Updating the adaptive relation between climate and comfort indoors: new insights and an extended database. Building and Environment, v. 63, p. 40-55, 2013.
- INSTITUTO NACIONAL DE PESQUISAS ESPACIAIS. Banco de dados dos ventos no Rio de Janeiro: estação Santos Dumont. Available: http://bancodedados.cptec.inpe.br/downloadBDM/consulta.jsp Access: 10 jan. 2015.
» http://bancodedados.cptec.inpe.br/downloadBDM/consulta.jsp - INTERNATIONAL ENERGY AGENCY. IEA Energy in Buildings and Community Programme (EBC). Available: http://www.iea-ebc.org/projects/project?AnnexID=35 Access: 18 jan. 2018a.
» http://www.iea-ebc.org/projects/project?AnnexID=35 - INTERNATIONAL ENERGY AGENCY. IEA Energy in Buildings and Community Programme (EBC) .Available: http://www.iea-ebc.org/projects/project?AnnexID=62 Access: 18 jan. 2018b.
» http://www.iea-ebc.org/projects/project?AnnexID=62 - LAMBERTS, R.; DUTRA, L.; PEREIRA, F. O. R. Eficiência energética na arquitetura. São Paulo: PW Editores, 1997.
- LEE, R-X.; WONG, N-H. A parametric study of Gross Building Coverage Ratio (GBCR) variation on outdoor ventilation in Singapore’s high-rise residential estates. Journal of Civil Engineering and Science, v. 3, n. 2, p. 92-116, 2014.
- LEITE, C. G. L. Alterações da ventilação urbana frente ao processo de verticalização de avenidas litorâneas: o caso da Avenida Litorânea de São Luis/MA. São Paulo, 2008. Dissertação ( Mestrado emArquitetura ) - Faculdade de Arquitetura e Urbanismo, Universidade de São Paulo, São Paulo, 2008.
- LINDEN, P. et al Natural ventilation for energy savings in California Commercial Buildings. Final Project Report. San Diego: UC San Diego, 2016.
- MENDELL, M. J. et al Elevated symptom prevalence associated with ventilation type in office building. Epidemiology, v. 7, n. 6, p. 583-589, 1996.
- NAKATA-OSAKI, C. M.; SOUZA, L. C. L. de; RODRIGUES, D. S. Impacto da geometria do cânion urbano na intensidade de ilha de calor noturna: análise através de um modelo simplificado adaptado a um SIG. Ambiente Construído , Porto Alegre, v. 16, n. 3, p. 73-87, jul./set. 2016.
- NG, E. (ed.) Designing high-density cities for social and environmental sustainability. London: Earthscan, 2010.
- NG, E.; WONG, H-H. Building heights and better ventilated design for high density cities. In: CONFERENCE ON PASSIVE AND LOW ENERGY ARCHITECTURE, 22., Beirut, 2005. Proceedings … Beirut, 2005.
- NICOL, J. F.; HUMPHREYS, M. A. Adaptive thermal comfort and sustainable thermal standards for buildings. Energy and Buildings , v. 34, n. 6, p. 563-572, jul. 2002.
- O’DONOVAN, A.; O’SULLIVAN, P. D.; MURPHY, M. D. A field study of thermal comfort performance for a slotted louvre ventilation system in a low energy retrofit. Energy and Buildings , v. 135, p. 312-323, 2017.
- OKE, T. R. Street design and urban canopy layer climate. Energy and Buildings , v. 11, p. 103-113, 1988.
- PEREIRA, I. M.; ASSIS, E. S. de. Avaliação de modelos de índices adaptativos para uso no projeto arquitetônico bioclimático. Ambiente Construído , Porto Alegre, v. 10, n. 1, p. 31-51, jan./mar. 2010.
- SANTAMOURIS, M. et al On the impact of urban climate on the energy consumption of buildings. Solar Energy, v. 70, n. 3, p. 201-216, 2001.
- SEIFERT, J. et al Calculation of wind driven cross ventilation in building with large opening. Journal of Wind Engineering and Industrial Aerodynamics, v. 94, p. 925-947, 2006.
- STRAATEN, V. Thermal performance of buildings. Amsterdam: Elsevier, 1967.
- TOE, D. H.; KUBOTA, T. Development of an adaptive thermal comfort equation for naturally ventilated buildings in hot-humid climates using ASHRAE RP-884 database. Frontiers of Architectural Research, v. 2, p. 278-291, 2013.
- TORK, L. D.; TIBIRIÇÁ, A. C. G.; TIBIRIÇÁ, A. M. B. Análise da ventilação natural conforme planos diretores: resultados de pesquisa em Belém, PA. Ambiente Construido, Porto Alegre, v. 17, n. 1, p. 329-351, jan./mar. 2017.
- TURI, S. D. et al Recovery of ancient bioclimatic strategies for energy retrofit in historical buildings: the case of the Infants’ Tower in the Alhambra. Energy Procedia, v. 133, p. 300-311, 2017.
- YU, B. F. et al Review of research on air-conditioning systems and indoor air quality control for human health. International Journal of Refrigeration, v. 32, n. 1, p. 3-20, 2009.
Publication Dates
-
Publication in this collection
05 Mar 2021 -
Date of issue
Apr-Jun 2021
History
-
Received
27 May 2020 -
Accepted
05 Aug 2020

 Source: adapted from
 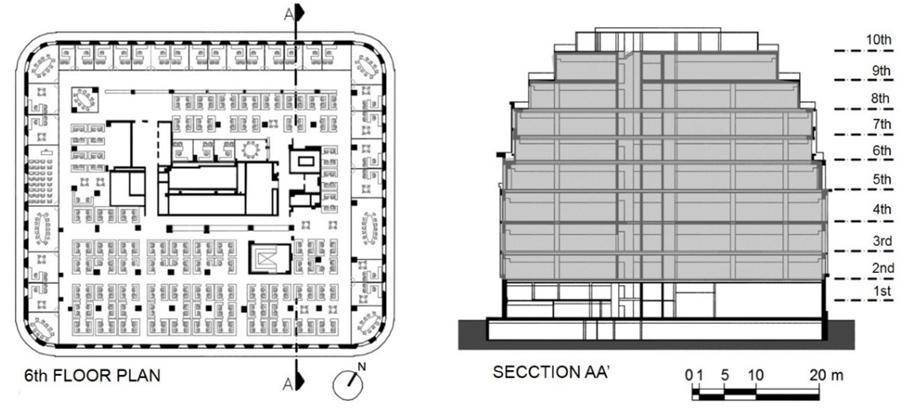 Source: adapted from