Abstract
Background:
The nutritional requirements of honeybees (Apis mellifera) for their complete development need to be supplied through food sources available in the environment, since honeybees are insects that depend directly on blossoming food sources. However, at certain times a food-supply reduction can promote nutritional stress, thus necessitating food supplementation for maintenance or production stimulus of the colonies. Thus, the determination of optimal energy supplementation can assist in the maintenance and production of colonies.
Methods:
Twenty Apis mellifera beehives were used (with five beehives per treatment): CTL, control (without feeding); SJ, sugarcane juice; SS, sugar syrup; and IS, inverted sucrose. We evaluated the food consumption, population development, and physiological state (expression of vitellogenin and hexamerin 70a genes) of each colony.
Results:
The results showed that the supplementation of colonies with sugar syrup resulted in an intermediate consumption level (894.6 ± 291 mL) and better development (384.9 ± 237.3 and 158.3 ± 171.6 cm2, sealed and open brood, respectively). Furthermore, this diet ensured that the colonies were in a good physiological state, as bees fed this diet presented the highest relative expression levels of vitellogenin and hexamerin 70a among all the diets tested.
Conclusions:
Therefore, sugar syrup is concluded to be the best artificial energetic food for use in the supplementation of honeybee colonies.
Keywords:
Beekeeping; Apis mellifera; Energetic foods; Gene expression; Nutritional stress
Background
All of the nutritional needs of honeybees (Apis mellifera) for their complete development, maintenance, reproduction, production and longevity need to be supplied through food sources available in the environment [11. Vaudo AD, Tooker JF, Grozinger CM, Patch HM. Bee nutrition and floral resource restoration. Curr Opin Insect Sci. 2015 Aug;10:133-41.]. In nature, A. mellifera bees meet all their nutritional needs through the ingestion of nectar and pollen [22. DeGrandi-Hoffman G, Chen Y. Nutrition, immunity and viral infections in honey bees. Curr Opin Insect Sci. 2015 Aug;10:170-6. ]. Nectar has an undeniable importance to colony development, since it is the main source of energetic food for bees and permits their survival [33. Seeley TD. The wisdom of the hive: the social physiology of honey bee colonies. Londres: Harvard University Press.; 1995.]. So, nutritional stress caused by food shortages or the availability of only foods of low nutritional value may lead to a reduction in the metabolic activity of the bees [44. Crailsheim K. The protein balance of the honey bee worker. Apidologie. 1990;21(5):417-29., 55. Wang Y, Kaftanoglu O, Brent CS, Page RE, Amdam GV. Starvation stress during larval development facilitates an adaptive response in adult worker honey bees (Apis mellifera L.). J Exp Biol. 2016 Apr;219(Pt 7):949-59.]. It has also been observed that when there is little available natural food, there are reductions in the number of worker bees in the hive, queen’s egg-laying and survival rates of individuals, and increases in escape or abandonment rates [66. Paiva JPLM, Paiva HM, Esposito E, Morais MM. On the effects of artificial feeding on bee colony dynamics: A mathematical model. PLoS One. 2016;11(11):1-18.], dramatically affecting the production of colonies.
Production of bee venom has been an increasingly profitable activity due to its use by the chemical and pharmaceutical industries. In addition, the venom is used for the production of antivenoms against Africanized honeybee stings [77. Barbosa AN, Boyer L, Chippaux JP, Medolago NB, Caramori CA, Paixão AG, et al. A clinical trial protocol to treat massive Africanized honeybee (Apis mellifera) attack with a new apilic antivenom. J Venom Anim Toxins incl Trop Dis. 2017 Mar 16;23(14). doi: 10.1186/s40409-017-0106-y.
https://doi.org/10.1186/s40409-017-0106-...
]. Thus, the nutritional and physiological statuses of the colonies are important to bee venom production [77. Barbosa AN, Boyer L, Chippaux JP, Medolago NB, Caramori CA, Paixão AG, et al. A clinical trial protocol to treat massive Africanized honeybee (Apis mellifera) attack with a new apilic antivenom. J Venom Anim Toxins incl Trop Dis. 2017 Mar 16;23(14). doi: 10.1186/s40409-017-0106-y.
https://doi.org/10.1186/s40409-017-0106-...
], given the possible occurrence of seasonal variations in the composition of the venoms [88. Ferreira Jr RS, Sciani JM, Marques-Porto R, Lourenço Junior A, Orsi RO, Barraviera B et al. Africanized honey bee (Apis mellifera) venom profiling: Seasonal variation of melittin and phospholipase A2 levels. Toxicon. 2010 Sep 1;56(3):355-62.]. As in the production of honey and other derivatives, colonies should be populous and well nourished to absorb the stress caused by the alarm pheromones released during venom harvest [88. Ferreira Jr RS, Sciani JM, Marques-Porto R, Lourenço Junior A, Orsi RO, Barraviera B et al. Africanized honey bee (Apis mellifera) venom profiling: Seasonal variation of melittin and phospholipase A2 levels. Toxicon. 2010 Sep 1;56(3):355-62.].
The nutritional stress can cause alterations in the bees’ metabolic pathways that influence several biological processes, including the expression of such genes as vitellogenin and hexamerin 70a. These genes are considered storage genes because they give rise to proteins that are produced during the larval stage and remain stored in the hemolymph and/or in the fat body [99. Martins JR, Nunes FMF, Luz Paulino Simões Z, Maria Gentile Bitondi M. A honeybee storage protein gene, hex 70a, expressed in developing gonads and nutritionally regulated in adult fat body. J Insect Physiol. 2008 May;54(5):867-77.].
Vitellogenin is important to the immune system and longevity of bees because this protein is a zinc carrier, and thus protects many cell lines against oxidative stress and apoptosis. Decreased expression of this gene product due to high expression levels of juvenile hormone was also previously shown to be related to reductions in the numbers of functional hemocytes in forager bees due to decreases in the quantity of zinc carried by vitellogenin [1010. Falchuk KH. The molecular basis for the role of zinc in developmental biology. Mol Cell Biochem. 1998 Nov;188(1-2):41-8., 1111. Pinto LZ, Bitondi MMG, Simões ZLP. Inhibition of vitellogenin synthesis in Apis mellifera workers by a juvenile hormone analogue, pyriproxyfen. J Insect Physiol. 2000 Feb;46(2):153-60., 1212. Amdam GV, Simões ZLP, Hagen A, Norberg K, Schrøder K, Mikkelsen Ø, et al. Hormonal control of the yolk precursor vitellogenin regulates immune function and longevity in honeybees. Exp Gerontol. 2004 May;39(5):767-73., 1313. Harwood GP, Ihle KE, Salmela H, Amdam G. Regulation of Honeybee Worker (Apis mellifera) Life Histories by Vitellogenin. In Non-Mammalian Hormone-Behavior Systems. Vol. 2. Elsevier. p. 403-420. 2016.].
Hexamerin 70a is a gene related to storage, which is expressed in the larval, pupal, and adult stages of workers, queens, and drones, and is the only protein with a hexamerin subunit present in significant quantities in the fat body and adult hemolymph of A. mellifera. The synthesis of hexamerins, specifically the subunit 70a, like that of vitellogenin, is directly related to the quantity and quality of food intake. In older worker bees, such as forager bees, the levels of this protein are reduced due to the fact that such bees ingest a low-protein diet, since they do not collect and / or consume much pollen and instead preferentially consume nectar [99. Martins JR, Nunes FMF, Luz Paulino Simões Z, Maria Gentile Bitondi M. A honeybee storage protein gene, hex 70a, expressed in developing gonads and nutritionally regulated in adult fat body. J Insect Physiol. 2008 May;54(5):867-77.].
In a field experiment Carrillo [1414. Carrillo MP, Kadri SM, Veiga N, de Oliveira Orsi R. Energetic feedings influence beeswax production by Apis mellifera L. honeybees. Acta Sci - Anim Sci. 2015;37(1):73-6. ] supplied A. mellifera colonies during an off-season with sugar syrup, sugarcane juice and inverted sucrose, and analyzed how it influences beeswax production. From this study they concluded that sugar syrup is directly correlated with an increase of beeswax production, showing that the source of sugar solution can directly influence the colony.
Beekeepers often provide artificial food to their colonies to lessen the negative effects that bee colonies suffer during this period in which food resources are drastically reduced, and thus ensure the survival and good performance of the colony [1515. Manning R. Artificial feeding of honeybees based on an understanding of nutritional principles. Anim Prod Sci. 2018;58(4):689-703.]. Therefore, this study aimed to select the best energetic food to provide to bee colonies for optimizing their maintenance and growth. This was done while taking into account the food consumption, population development, and physiological state of the colony in relation to gene expression of vitellogenin and hexamerin 70a as a function of different foods provided to bee colonies.
Methods
Field experiment
For the field experiment, 20 Apis mellifera colonies in Langstroth beehives were selected, and the numbers of brood and food frames were standardized one month before the experiment with four brood, two food and two empty honeycomb frames. All experimental colonies were maintained in the apiary of the School of Veterinary Medicine and Animal Science (FMVZ), UNESP, on Lageado Experimental Farm, Botucatu, SP, Brazil. Queens were replaced in all colonies two months before the experiment. The food treatments used were the following: control (CTL), in which no artificial food was provided; feeding with sugarcane juice (SJ) produced in an electric cane mill at a research laboratory; feeding with sugar syrup (SS) prepared using pre-boiled filtered water and sucrose (50% sugar and 50% water, produced freshly on the same day it was offered to the colonies); and feeding with inverted sucrose (IS) purchased from Atrium Food Group, Campinas, São Paulo, Brazil (76 % sugar and 24% water).
Food was supplied twice a week in the amount 0.5 L per hive (1 L colony/per week) for a period of 60 days by means of a Boardman artificial feeder. The experiment was carried out in June and July of 2015. During the experimental period, food consumption was measured weekly.
Population development, including the numbers of open and sealed areas in one central nest structure, was measured monthly in the hives throughout the experimental period using the methods used and described by Ali [1616. Ali MAM. Comparative study for evaluating two honey bee races, Apis mellifera jementica (indigenous race) and Apis mellifera carnica (carniolan race) in brood production, population development and foraging activity under the environmental conditions of the central region of the Kingdom of Saudi Arabia. Ann Agric Sci. 2011;56(2):127-34.]. The numbers of brood and food frames were quantified weekly, and were considered a brood or frame of food when 70% or more was occupied. Physicochemical analyses of the food provided were performed according to the following references. Total sugar reduction was performed according to Welke [1717. Welke JE, Reginatto S, Ferreira D, Vicenzi R, Soares JM. Caracterização físico-química de méis de Apis mellifera L. da região noroeste do Estado do Rio Grande do Sul. Cienc Rural. 2008;38(6):1737-41.], calorimetric and dry matter analysis according to Sodré [1818. Sodré GDS, Marchini LC, Moreti ACDCC, Otsuk IP, de Carvalho CAL. Physico-chemical characteristics of honey produced by Apis mellifera in the Picos Region, State of Piauí, Brazil. Rev Bras Zootec. 2011;40(8):1837-43.], and ash content according to Sodré [1919. Sodré GS, Marchini LC, Moreti ACDCC, Otsuk IP, De Carvalho CAL. Caracterização físico-química de amostras de méis de Apis mellifera L. (Hymenoptera: Apidae) do Estado do Ceará. Cienc Rural. 2007;37(4):1139-44.].
Honeybee collection
The bees for use in the analysis of the relative expression levels of the selected genes were collected on day 0, and were used as the experimental control. Collections were also carried out on day 30 and 60. Five worker bees were collected from the central frame, and were identified as intern bees (I); 5 worker bees were also collected that were carrying pollen in their corbicle, and in turn were identified as forager bees (F). During the experimental period, all of the colonies receiving the SJ treatment died, which made it impossible to collect these bees for analysis. After collection, the bees were immediately stored in a freezer at -80 °C for future RNA extraction.
Relative expression of storage genes
To analyze the expression of vitellogenin and hexamerin 70a, 5 forager and 5 intern bees were randomly collected from each experimental colony and immediately frozen at -80 °C on days 0, 30, and 60. Total RNA was extracted from the heads of 5 bees of each type [2020. Scharlaken B, de Graaf DC, Goossens K, Peelman LJ, Jacobs FJ. Differential gene expression in the honeybee head after a bacterial challenge. Dev Comp Immunol. 2008;32(8):883-9.] using 500 μL of TRIzol® Reagent (Life Technologies) for each sample according to the manufacturer’s instructions. The extraction product was visualized on 1% agarose gel and quantified using a NanoDrop Instrument (ND-1000 Spectrophotometer). The RNA was treated with DNase I, incubated for 60 min at 37 °C and then for 10 min at 75 °C. Next, a solution was prepared of 0.75 mM oligo dT, 0.15 mM random oligos, 0.75 mM deoxynucleotide triphosphates and 1 μL of RNA, which was then incubated at 65 °C for 5 min and placed on ice for 1 min. We added 1× buffer dithiothreitol 0.005, RNaseOUT (40 U/μL), and 100 U SuperScript® III Reverse Transcriptase (Invitrogen) to this preparation. Complementary DNA synthesis was performed at 50 °C for 60 min, followed by 15 min at 70 °C.
Amplification was performed by real-time quantitative polymerase chain reaction (RT-qPCR) in a 25µL reaction mixture using the SYBR® Green PCR Master Mix (Applied Biosystems) and 0.2 μM of each primer. The sequences and details of the primers used are provided in Table 1. The RT-qPCR reactions were performed using ABI 7300 (Applied Biosystems) equipment under the following conditions: 1 cycle at 50 °C for 2 min; 1 cycle at 94 °C for 10 min; and 40 cycles of 94 °C for 15 s and 60 °C for 1 min. The dissociation curve was obtained under the following conditions: at 95 °C for 15 s, 60 °C for 30 s, and 95 °C for 15 s. The determination of the expression levels of vitellogenin and hexamerin 70a was performed in triplicate, and the expression of the actin gene was utilized as the control [2020. Scharlaken B, de Graaf DC, Goossens K, Peelman LJ, Jacobs FJ. Differential gene expression in the honeybee head after a bacterial challenge. Dev Comp Immunol. 2008;32(8):883-9.]. For each reaction, a negative control consisting of a mixture of reagents and water was also used.
The efficiency of the oligonucleotides (E) was calculated from 4 dilutions of complementary DNA samples (1:5, 1:25, 1:125, and 1:625) using the formula E = 10 (-1/inclination). The quantification of a gene’s relative expression (R) was determined according to Pfaffl [2121. Pfaffl MW. A new mathematical model for relative quantification in real-time RT-PCR. Nucleic Acids Res. 2001 May 1;29(9):e45.], defining the crossing point as the point at which the detected fluorescence was appreciably above the background fluorescence, using the formula:
Statistical analyses
The data obtained for food consumption, population development, and gene expression were first tested for normality (Anderson-Darling test) and homogeneous variances (Levene’s test). When significant deviations (p < 0.05) from these assumptions were detected, the data were compared using the non-parametric Mann-Whitney test, and the median and interquartile intervals (Q1_Q3) were presented. When no significant deviations from normality or homoscedasticity were detected, the data were analyzed with one-way ANOVA, and the mean ± standard deviation values were presented. P-values below 0.05 were considered significant. All statistical analyses were performed using the statistical software Minitab.
Results
The respective weekly consumptions of SJ, SS, and IS were 0.994.8 ± 310, 894.6 ± 291, and 433.9 ± 227.6 mL. During the experimental period four colonies under SJ treatments absconded.
The results of the physicochemical analyses of the different foods are presented in Table 2. Significant differences were observed in the analysis of SJ ash (0.27 ± 0.02%), whose value differed significantly from that of SS (0.01 ± 0.001%), but not from that of IS (0.11 ± 0.04%).
The calorimetric analysis of the foods showed that SS presented the highest energetic value (4,155 kcal kg-1) of all the foods tested (3,903 kcal kg-1 for SJ and 3,895 kcal kg-1 for IS). The dry matter values of SJ and SS were lower than that of IS, indicating their higher moisture content. The analysis of the total reducing sugars in each food type found a higher SS value (41.52 ± 2.8%), which differed significantly from those detected for SJ (21.15 ± 1.6%) and IS (0.82 ± 0.01%).
The data displayed in Table 3 represent the number of brood and food frames in colonies under different treatments. The number of brood frames was higher in colonies under the SS and IS treatments (3.60 ± 0.67 and 3 ± 1.10, respectively) compared to those in the CTL and SJ treatments (2.00 ± 0.90 and 1.90 ± 0.31, respectively). However, the number of food frames did not differ among treatments. The data shown in Table 4 represent the areas of open and sealed brood areas (cm²) observed in colonies subjected to different treatments. The treatments SS and IS presented larger sealed brood areas than the other treatments did. The largest of the open brood areas was recorded in the IS treatment.
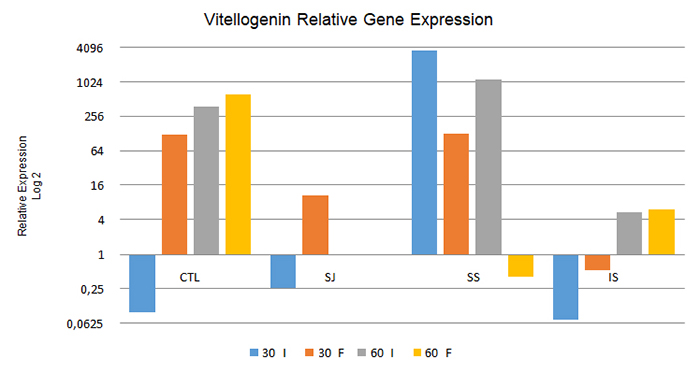
As to the relative expression of the vitellogenin gene, from the comparison between intern and forager bees at 30 and 60 days (Figure 1), the intern bees in the CTL, SJ, and IS treatments at 30 days and in the CTL and IS treatments at 60 days presented significantly lower relative expression levels compared to foragers at the same collection (p < 0.05). However, the contrary was observed in the SS treatment bees analyzed at both 30 and 60 days (p < 0.05), in which the intern bees expressed this gene at levels 2,862 times greater than those in the forager bees.

Relative expression of the vitellogenin gene in intern bees (I) and forager bees (F) under the different treatments used after 30 days and 60 days. CTL: control; SJ: sugarcane juice; SS: sugar syrup; IS: inverted sucrose. 60 I and 60 F: Data not obtained due to death of the colonies during the experimental period.
At 30 days, when analyzing only the intern bees in relation to the diets provided, the treatments CTL, SJ, and IS resulted in the downregulation of this gene (i.e., a decrease in the relative expression level of the gene in comparison to that in the control group), whereas in the SS treatment the upregulation of this gene (i.e. increased relative expression) was noted. Among the forager bees sampled at the same time, only those treated with IS presented downregulation of this gene, which showed that gene expression patterns differed between the intern and forager bees.
When analyzing intern bees at 60 days, the expression of this gene was upregulated in all treatment groups, although the CTL and SS treatments presented relatively higher expression levels compared to those in the IS treatment (67.92 and 205.63 times more than in the IS treatment, respectively). The bees fed SS showed greater expression of this gene in comparison to those in the other treatments, similarly to the intern bees collected at 30 days. However, among the forager bees collected at the same time, only those treated with SS presented downregulation of this gene in relation to the control.
When changing the focus of the data analysis and comparing the results obtained from intern and forager bees between 30 and 60 days under the different treatments to check for changes in the gene expression pattern after 60 days of feeding, it was observed that all the analyzed treatments differed in their relative expression levels (p < 0.05). In the CTL and IS treatments, both intern and forager bees showed increased expression of the vitellogenin gene during the experiment (P<0.05). However, the contrary occurred under the SS treatment, namely greater relative expression at 30 than at 60 days in both intern and forager bees.
Comparing the intern and forager bees at 30 and 60 days, in all treatments except SS there were lower relative expression levels of the hexamerin 70a gene (Figure 2) in the intern bees than in the forager bees at 30 days, which indicates its downregulation in the intern bees and its upregulation in the forager bees. To the contrary, in the SS treatment the intern bees presented greater relative expression levels of hexamerin 70a than did the forager bees, while the intern bees displayed a very sharp upregulation. Specifically, the expression of this gene reached a value 33,483 times higher than that in intern bees at 30 days, whereas in the forager bees this gene’s expression was downregulated.

Relative expression of the hexamerin 70a gene in intern bees (I) and forager bees (F), after 30 days and 60 days, under the different treatments. CTL: control; SJ: sugarcane juice; SS: sugar syrup; IS: inverted sucrose. 60 I and 60 F: Data not obtained due to death of the colonies during the experimental period.
At 60 days, this gene presented upregulation in both the forager and intern bees in all treatments, but the intern bees showed relatively higher expression levels of the hexamerin 70a gene than the forager bees in all treatments.
Discussion
Feeding artificial energetic foods to honeybee colonies during the off-season ensures the correct annual operation of the colony. For this to be effective, it is necessary to choose the best energetic food to offer the bees to ensure the proper development of a colony for the beekeeper. The lower consumption of inverted sucrose in the present study can be linked to the higher dry matter percentage and lower water content (24% water), since bees collect nectar as a natural energetic source whose water content exceeds 24% [2222. Lichtenberg-Kraag B. Evidence for correlation between invertase activity and sucrose content during the ripening process of honey. J Apic Res. 2014 Jul;53(3):364-73.].
The dry matter data followed contrary trends among treatments in relation to the different food types, since the moisture content of the food is inversely proportional to dry matter [2323. Yanniotis S, Skaltsi S, Karaburnioti S. Effect of moisture content on the viscosity of honey at different temperatures. J Food Eng. 2006 Feb;72(4):372-7., 2424. Cui ZW, Sun LJ, Chen W, Sun DW. Preparation of dry honey by microwave-vacuum drying. J Food Eng. 2008 Feb;84(4):582-90.]. Therefore, sugar syrup and sugarcane juice contained more moisture, which may have favored their consumption since nectar, a natural energetic food of bees, has high humidity [2525. Garcia JM, Chambers IVE, Matta Z, Clark M. Viscosity measurements of nectar- and honey-thick liquids: Product, liquid, and time comparisons. Dysphagia. 2005;20(4):325-35., 2626. Hazlehurst JA, Karubian JO. Nectar robbing impacts pollinator behavior but not plant reproduction. Oikos. 2016;125(11):1668-76.]. Furthermore, the greater reduction of sugar and caloric content and the lower ash content of sugar syrup detected in the analyses carried out in this study, along with this food’s adequate dry matter content, indicated that this was the food that we supplied to the bees that most closely resembled honey, which is the main natural source of energy reserves for bee colonies. Thus, because it has a composition closer to that of the bees’ natural food, it was, at least in bromatological terms, the best source of artificial food for bees that was tested in this study.
Castagnino [2727. Castagnino GL, Arboitte MZ, Lengler S, Garcia GG, Glasenapp De Menezes LF. Development of nuclei Apis mellifera fed with the vitaminic amino acid supplement Promotor L. Cienc Rural. 2006;36(2):685-8. ] showed that energetic supplementation during the off-season increases the queen’s egg-laying. In addition to supplying an energetic diet, a protein diet is also essential for colony maintenance and improving the queen’s egg-laying [2828. Frias BED, Barbosa CD, Lourenço AP. Pollen nutrition in honey bees (Apis mellifera): impact on adult health. Apidologie. 2016;47(1):15-25.]. However, under the conditions of this experiment, the colonies had bee-bread reserves, and thus no protein supplementation was required. In this case, the energetic supplementation provided assisted in the maintenance of the colonies, and was able to account for the greater number of brood frames observed in the SS and IS treatments, suggesting that these energetic foods provided the necessary energetic support for the queen’s egg-laying during this period. Castagnino [2727. Castagnino GL, Arboitte MZ, Lengler S, Garcia GG, Glasenapp De Menezes LF. Development of nuclei Apis mellifera fed with the vitaminic amino acid supplement Promotor L. Cienc Rural. 2006;36(2):685-8. ] obtained a large brood area in colonies fed sugar syrup, which was similar to the results of the present study. The energy provided by the consumption of the sugar syrup and inverted sucrose probably stimulated the queen’s egg-laying.
The loss of four colonies subjected to the SJ treatment over the experimental period probably occurred because the sugarcane juice (the diet offered to bees in the SJ treatment) may have undergone fermentation at ambient temperature [2929. Pedroso AF, Nussio LG, Paziani SF, Loures DRS, Igarasi MS, Coelho RM, et al. Fermentation and epiphytic microflora dynamics in sugar cane silage. Sci Agric. 2005;62(5):427-32.]. Given this, it was not possible to obtain data on the relative expression of the tested genes at 60 days in the intern and forager bees in this treatment.
The analysis of intern bees at 30 days demonstrated an upregulation in vitellogenin expression in the SS treatment only. At the same moment and treatment the hexamerin 70a relative expression obtained a much greater value when compared with other treatments. This shows that sugar syrup had a more direct influence on intern bees than the other foods provided throughout the experimental period. This result may be related to several factors, such as energetic value and the maintenance of food integrity and quality at room temperature.
The vitellogenin expression levels observed after 60 days of feeding suggested that the SS treatment had a greater influence on the expression of this gene than the other diets, and it also facilitated better population development of the colony since the values of almost all of the performance parameters assessed were higher in this treatment compared to those in the other treatments. The forager bees, which live for approximately 21 days, presented less relative expression of this gene than the intern bees, which were less than 15 days old, at both 30 and 60 days. This may have been due to the fact that there was a higher concentration of juvenile hormone in the hemolymph of the older bees, which may have influenced their biosynthesis of vitellogenin. As noted earlier, vitellogenin is a protein related to the prevention of oxidative stress since it is a zinc carrier, while low levels of this protein can compromise the immune system [3030. Dallacqua RP, Simões ZLP, Bitondi MMG. Vitellogenin gene expression in stingless bee workers differing in egg-laying behavior. Insectes Soc. 2007;54(1):70-6.].
Conclusion
The results of this study demonstrated that the supplementation of honeybee colonies in the field during the off-season with sugar syrup results in an intermediate level of consumption of this food by them and greater colony development, and also ensured that the bees were in a better physiological state. Therefore, it is demonstrated that sugar syrup is the most beneficial artificial energetic food tested in this study.
Abbreviations
CTL: control; F: forager bees; I: intern bees; S: inverted sucrose; RT-qPCR: real-time quantitative polymerase chain reaction; SJ: sugarcane juice; SS: sugar syrup.
Acknowledgments
The authors are grateful to Fundação de Amparo à Pesquisa do Estado de São Paulo (FAPESP) for the scientific initiation scholarship provided (FAPESP process: 2017/12001-2).
References
- 1. Vaudo AD, Tooker JF, Grozinger CM, Patch HM. Bee nutrition and floral resource restoration. Curr Opin Insect Sci. 2015 Aug;10:133-41.
- 2. DeGrandi-Hoffman G, Chen Y. Nutrition, immunity and viral infections in honey bees. Curr Opin Insect Sci. 2015 Aug;10:170-6.
- 3. Seeley TD. The wisdom of the hive: the social physiology of honey bee colonies. Londres: Harvard University Press.; 1995.
- 4. Crailsheim K. The protein balance of the honey bee worker. Apidologie. 1990;21(5):417-29.
- 5. Wang Y, Kaftanoglu O, Brent CS, Page RE, Amdam GV. Starvation stress during larval development facilitates an adaptive response in adult worker honey bees (Apis mellifera L.). J Exp Biol. 2016 Apr;219(Pt 7):949-59.
- 6. Paiva JPLM, Paiva HM, Esposito E, Morais MM. On the effects of artificial feeding on bee colony dynamics: A mathematical model. PLoS One. 2016;11(11):1-18.
- 7. Barbosa AN, Boyer L, Chippaux JP, Medolago NB, Caramori CA, Paixão AG, et al. A clinical trial protocol to treat massive Africanized honeybee (Apis mellifera) attack with a new apilic antivenom. J Venom Anim Toxins incl Trop Dis. 2017 Mar 16;23(14). doi: 10.1186/s40409-017-0106-y.
» https://doi.org/10.1186/s40409-017-0106-y - 8. Ferreira Jr RS, Sciani JM, Marques-Porto R, Lourenço Junior A, Orsi RO, Barraviera B et al. Africanized honey bee (Apis mellifera) venom profiling: Seasonal variation of melittin and phospholipase A2 levels. Toxicon. 2010 Sep 1;56(3):355-62.
- 9. Martins JR, Nunes FMF, Luz Paulino Simões Z, Maria Gentile Bitondi M. A honeybee storage protein gene, hex 70a, expressed in developing gonads and nutritionally regulated in adult fat body. J Insect Physiol. 2008 May;54(5):867-77.
- 10. Falchuk KH. The molecular basis for the role of zinc in developmental biology. Mol Cell Biochem. 1998 Nov;188(1-2):41-8.
- 11. Pinto LZ, Bitondi MMG, Simões ZLP. Inhibition of vitellogenin synthesis in Apis mellifera workers by a juvenile hormone analogue, pyriproxyfen. J Insect Physiol. 2000 Feb;46(2):153-60.
- 12. Amdam GV, Simões ZLP, Hagen A, Norberg K, Schrøder K, Mikkelsen Ø, et al. Hormonal control of the yolk precursor vitellogenin regulates immune function and longevity in honeybees. Exp Gerontol. 2004 May;39(5):767-73.
- 13. Harwood GP, Ihle KE, Salmela H, Amdam G. Regulation of Honeybee Worker (Apis mellifera) Life Histories by Vitellogenin. In Non-Mammalian Hormone-Behavior Systems. Vol. 2. Elsevier. p. 403-420. 2016.
- 14. Carrillo MP, Kadri SM, Veiga N, de Oliveira Orsi R. Energetic feedings influence beeswax production by Apis mellifera L. honeybees. Acta Sci - Anim Sci. 2015;37(1):73-6.
- 15. Manning R. Artificial feeding of honeybees based on an understanding of nutritional principles. Anim Prod Sci. 2018;58(4):689-703.
- 16. Ali MAM. Comparative study for evaluating two honey bee races, Apis mellifera jementica (indigenous race) and Apis mellifera carnica (carniolan race) in brood production, population development and foraging activity under the environmental conditions of the central region of the Kingdom of Saudi Arabia. Ann Agric Sci. 2011;56(2):127-34.
- 17. Welke JE, Reginatto S, Ferreira D, Vicenzi R, Soares JM. Caracterização físico-química de méis de Apis mellifera L. da região noroeste do Estado do Rio Grande do Sul. Cienc Rural. 2008;38(6):1737-41.
- 18. Sodré GDS, Marchini LC, Moreti ACDCC, Otsuk IP, de Carvalho CAL. Physico-chemical characteristics of honey produced by Apis mellifera in the Picos Region, State of Piauí, Brazil. Rev Bras Zootec. 2011;40(8):1837-43.
- 19. Sodré GS, Marchini LC, Moreti ACDCC, Otsuk IP, De Carvalho CAL. Caracterização físico-química de amostras de méis de Apis mellifera L. (Hymenoptera: Apidae) do Estado do Ceará. Cienc Rural. 2007;37(4):1139-44.
- 20. Scharlaken B, de Graaf DC, Goossens K, Peelman LJ, Jacobs FJ. Differential gene expression in the honeybee head after a bacterial challenge. Dev Comp Immunol. 2008;32(8):883-9.
- 21. Pfaffl MW. A new mathematical model for relative quantification in real-time RT-PCR. Nucleic Acids Res. 2001 May 1;29(9):e45.
- 22. Lichtenberg-Kraag B. Evidence for correlation between invertase activity and sucrose content during the ripening process of honey. J Apic Res. 2014 Jul;53(3):364-73.
- 23. Yanniotis S, Skaltsi S, Karaburnioti S. Effect of moisture content on the viscosity of honey at different temperatures. J Food Eng. 2006 Feb;72(4):372-7.
- 24. Cui ZW, Sun LJ, Chen W, Sun DW. Preparation of dry honey by microwave-vacuum drying. J Food Eng. 2008 Feb;84(4):582-90.
- 25. Garcia JM, Chambers IVE, Matta Z, Clark M. Viscosity measurements of nectar- and honey-thick liquids: Product, liquid, and time comparisons. Dysphagia. 2005;20(4):325-35.
- 26. Hazlehurst JA, Karubian JO. Nectar robbing impacts pollinator behavior but not plant reproduction. Oikos. 2016;125(11):1668-76.
- 27. Castagnino GL, Arboitte MZ, Lengler S, Garcia GG, Glasenapp De Menezes LF. Development of nuclei Apis mellifera fed with the vitaminic amino acid supplement Promotor L. Cienc Rural. 2006;36(2):685-8.
- 28. Frias BED, Barbosa CD, Lourenço AP. Pollen nutrition in honey bees (Apis mellifera): impact on adult health. Apidologie. 2016;47(1):15-25.
- 29. Pedroso AF, Nussio LG, Paziani SF, Loures DRS, Igarasi MS, Coelho RM, et al. Fermentation and epiphytic microflora dynamics in sugar cane silage. Sci Agric. 2005;62(5):427-32.
- 30. Dallacqua RP, Simões ZLP, Bitondi MMG. Vitellogenin gene expression in stingless bee workers differing in egg-laying behavior. Insectes Soc. 2007;54(1):70-6.
-
Availability of data and materials
The datasets generated during and/or analyzed during the current study are available from the corresponding author on reasonable request. -
Funding
The present study was supported by São Paulo Research Foundation (FAPESP), process n. 2017/12001-2. -
Ethics approval
Not applicable. -
Consent for publication
Not applicable.
Publication Dates
-
Publication in this collection
15 May 2020 -
Date of issue
2020
History
-
Received
09 Jan 2020 -
Accepted
19 Apr 2020