Abstracts
The purpose of the current study was to supply the first information on age and growth for Thunnus obesus caught in the equatorial south-western Atlantic using dorsal spines, an approach that has been successfully employed for ageing tuna species. The study was conducted using a multi-model inference based on information theory for back-calculated and observed length-at-age data. Uncertainty associated with the parameter estimation was verified and results were compared to other accounts on the species, considering both the statistical and methodological contexts. Samples were collected in Natal city (Rio Grande do Norte State, Brazil) from February 1999 to January 2000, of tuna vessels and from surveys, aimed at providing information on the Brazilian Exclusive Economic Zone (EEZ) in the area around São Pedro and São Paulo Archipelago. Validation using marginal increment indicated that one ring is deposited per year. Mean length-at-age ranged of 54.3 to 177.5 cm (fork length) for ages 1 to 9 years. Von Bertalanffy, Richards, and Gompertz models were considered suitable for the bigeye tuna. Hence, the model-averaged asymptotic length ¯L∞ was estimated. The averaged model generated in the present study by back-calculation was considered appropriate for describing the growth of T. obesus.
Ageing techniques; Dorsal-fin spine; Growth parameters; Multi-model inference
A proposta do presente estudo foi fornecer a primeira informação sobre idade e crescimento de Thunnus obesus, capturado no Atlântico sudoeste equatorial usando espinhos dorsais, uma abordagem que tem sido utilizada com sucesso na determinação de idade de espécies de atuns. O estudo foi conduzido usando uma inferência de multi-modelos baseada na teoria de informação avaliada para dados de comprimento por idade retrocalculados e observados. Incertezas associadas aos parâmetros foram verificadas e os resultados foram comparados aos de outros estudos realizados para esta espécie, considerando os contextos estatísticos e metodológicos. As amostras foram coletadas na cidade de Natal (estado do Rio Grande do Norte, Brasil) de fevereiro de 1999 a janeiro de 2000, provenientes de embarcações comerciais e também prospecções, cujo objetivo foi prover informações sobre a Zona Econômica Exclusiva (ZEE) na área do entorno do Arquipélago de São Pedro e São Paulo. A validação usando incremento marginal indicou a deposição de um anel anual. Os comprimentos médios por idade variaram entre 54.3 a 175.7 cm (comprimento furcal) para idades de 1 a 9 anos. Os modelos Von Bertalanffy, Richards e Gompertz foram considerados adequados para a albacora bandolim e, desta forma, o comprimento assintótico para um modelo médio (¯L∞) foi estimado. O modelo médio gerado no presente estudo a partir dos comprimentos retrocalculados foi considerado apropriado para descrever o crescimento de T. obesus capturada no Atlântico.
Age and growth estimation of bigeye tuna, Thunnus obesus (Teleostei: Scombridae) in the southwestern Atlantic
Paulo Duarte-NetoI, II; Fábio M. HigaI; Rosangela P. LessaI
IUniversidade Federal Rural de Pernambuco (UFRPE), Laboratório de Dinâmica de Populações Marinhas-DIMAR,. Av. Dom Manuel Medeiros s/n, Dois Irmãos, Recife 52171-900, PE, Brazil
IIUniversidade Federal Rural de Pernambuco (UFRPE), Unidade Acadêmica de Garanhuns, 55292-270 Garanhuns, PE, Brazil. pjduarteneto@gmail.com
ABSTRACT
The purpose of the current study was to supply the first information on age and growth for Thunnus obesus caught in the equatorial south-western Atlantic using dorsal spines, an approach that has been successfully employed for ageing tuna species. The study was conducted using a multi-model inference based on information theory for back-calculated and observed length-at-age data. Uncertainty associated with the parameter estimation was verified and results were compared to other accounts on the species, considering both the statistical and methodological contexts. Samples were collected in Natal city (Rio Grande do Norte State, Brazil) from February 1999 to January 2000, of tuna vessels and from surveys, aimed at providing information on the Brazilian Exclusive Economic Zone (EEZ) in the area around São Pedro and São Paulo Archipelago. Validation using marginal increment indicated that one ring is deposited per year. Mean length-at-age ranged of 54.3 to 177.5 cm (fork length) for ages 1 to 9 years. Von Bertalanffy, Richards, and Gompertz models were considered suitable for the bigeye tuna. Hence, the model-averaged asymptotic length ¯L∞ was estimated. The averaged model generated in the present study by back-calculation was considered appropriate for describing the growth of T. obesus.
Key words: Ageing techniques, Dorsal-fin spine, Growth parameters, Multi-model inference.
RESUMO
A proposta do presente estudo foi fornecer a primeira informação sobre idade e crescimento de Thunnus obesus, capturado no Atlântico sudoeste equatorial usando espinhos dorsais, uma abordagem que tem sido utilizada com sucesso na determinação de idade de espécies de atuns. O estudo foi conduzido usando uma inferência de multi-modelos baseada na teoria de informação avaliada para dados de comprimento por idade retrocalculados e observados. Incertezas associadas aos parâmetros foram verificadas e os resultados foram comparados aos de outros estudos realizados para esta espécie, considerando os contextos estatísticos e metodológicos. As amostras foram coletadas na cidade de Natal (estado do Rio Grande do Norte, Brasil) de fevereiro de 1999 a janeiro de 2000, provenientes de embarcações comerciais e também prospecções, cujo objetivo foi prover informações sobre a Zona Econômica Exclusiva (ZEE) na área do entorno do Arquipélago de São Pedro e São Paulo. A validação usando incremento marginal indicou a deposição de um anel anual. Os comprimentos médios por idade variaram entre 54.3 a 175.7 cm (comprimento furcal) para idades de 1 a 9 anos. Os modelos Von Bertalanffy, Richards e Gompertz foram considerados adequados para a albacora bandolim e, desta forma, o comprimento assintótico para um modelo médio (¯L∞) foi estimado. O modelo médio gerado no presente estudo a partir dos comprimentos retrocalculados foi considerado apropriado para descrever o crescimento de T. obesus capturada no Atlântico.
Introduction
The bigeye tuna, Thunnus obesus (Lowe, 1839), has ubiquitous distribution across all oceans between 45º N and 40º S, attaining up to 230 cm in length and 250 kg in weight (Collette & Nauen, 1983; Cayré et al., 1993). It is a commercially important species of tuna inhabiting the warm waters of the Atlantic, Indian, and Pacific Oceans, highly prized and one of the most valuable species for the Asian market, where it is consumed fresh as sashimi (Hanamoto, 1987; Sun et al., 2001). According to the last assessment conducted by The International Commission for the Conservation of Atlantic Tunas (ICCAT, 2010), this species is currently caught close to the maximum sustainable yield and is threatened as vulnerable by the IUCN red list (Collette et al., 2011).
For the Atlantic Ocean, most of the available information comes from the northern and southeastern portions and concerns stock identity (Bard & Stretta, 1981; Alvarado-Bremer et al., 1998; Schaefer, 1999); distribution and abundance (Saito, 1975; Hanamoto, 1987; Holland et al., 1998; Brill et al., 2005; Gonzalez et al., 2008; Hazin et al., 2011) and reproduction (Pereira, 1987; Zhu et al., 2011). Based on genetics and tagging-recapture information (Chow et al., 2000; Durand et al., 2005; ICCAT, 2005; Gonzalez et al., 2008), it is now accepted that this species composes a unique stock in the Atlantic Ocean, with varying environmental factors across the distribution area contributing to differences in population parameters.
In Brazil, the species is not targeted by any local fleets and the little information available comes from the by-catch of vessels targeting tuna and swordfish in the Brazilian Exclusive Economic Zone (EEZ), including the area around São Pedro and São Paulo Archipelago (Vaske-Jr. et al., 2004). Samplings from leased vessels based in Natal (RN) and Santos (SP) have provided information on morphometrics, age and growth, diet, and size structure (Zavala-Camin, 1978; Fagundes et al., 2001). More recently, the bigeye tuna was abundantly recorded in experimental fisheries carried out from 2000 to 2002 in the area from 02 to 05º N, where the CPUE was 22 Kg/100 hooks, composing 38.7 % of the overall tuna catch (Asano-Filho et al., 2004).
Age and growth information represents the base for several methods applied to fisheries assessment, from a simple growth and mortality rates to complex methods as virtual population analysis (Campana, 2001). For T. obesus in the Atlantic Ocean, this type of information has been available since the 1970s as the result of three main ageing methods: length-frequency analysis (Champagnat & Pianet, 1974; Marcille et al., 1978; Weber, 1980; Pereira, 1984; Fagundes et al., 2001; Zhu et al., 2009), tagging data (Cayré & Diouf, 1984; Hallier et al., 2005) and hard part readings, such as vertebrae (Alves et al., 2002), rays (Gaikov et al., 1980; Draganik & Pelczarski, 1984; Delgado de Molina & Santana, 1986) and otoliths (Hallier et al., 2005). Despite the number of studies conducted, growth parameters for the bigeye tuna are not well defined yet (ICCAT, 2005), as highly dissimilar values have been provided in consequence of the different approaches estimation employed throughout the distribution area (Brown, 2005; Hallier et al., 2005).
The purpose of the current study is to supply the first information on age and growth for Thunnus obesus caught in the equatorial south-western Atlantic using dorsal spines, an approach that has been successfully employed for ageing tuna species (Cayré & Diouf, 1983; Compéan-Jimenez & Bard, 1983; Megalofonou, 2000; Sun et al., 2001; Lessa & Duarte-Neto, 2004). Distinct growth models were used (Cailliet et al., 2006; Katsanevakis, 2006) and the uncertainty associated with parameter estimations was verified by a multi-model inference that considered both statistical and biological contexts. Also, the reasons for the great variability of growth parameters among various studies were discussed.
Material and Methods
Samples were collected in Natal city (Rio Grande do Norte State, Brazil) from February 1999 to January 2000, during landings of 17 commercial vessels (20 to 25 m in length), equipped with ~30 km multifilament longline gear, using the Brazilian sardine (Sardinella brasiliensis) and squids (Loligo spp.) as bait. Samples were also taken from vessels operating within the scope of the Renewable Resources Assessment Program (REVIZEE), aimed at providing information on the Brazilian EEZ in the area around São Pedro and São Paulo Archipelago (0º 59'N, 30º 0'W). Vessels operated in the area from 1º N to 14 º S/ 29.5 º to 37º W, beyond the 1000 m isobath (Fig. 1). However, most captures occurred either around the São Pedro and São Paulo Archipelago or in the vicinity of seamounts of the Fernando de Noronha Chain. The overall sample totaled 2098 specimens, from which total length (TL, cm), fork length (FL, cm) and weight (when possible) were taken without sex distinction.
First dorsal-fin spines from 523 individuals were excised, frozen and stored in 4% formaldehyde or alcohol 98% for up to 6 months. After drying, spine lengths were measured and cross-sections were taken at 5 and 30% of the spine length above de condyle. Cross-sections were embedded in polyester resin and sectioned using a low-speed saw with a thickness of 0.75 to 1.00 mm. The sections that provided the best contrast of growth zones were mounted on glass slides using the synthetic resin ENTELLANTM and viewed with transmitted light in a binocular microscope equipped with an ocular micrometer. Measurements were made under 10 x magnifications (1 micrometer unit = 1.0 mm).
The spine diameter (measured in micrometers) was defined as the horizontal distance to the outside margin above the posterior notch, where the least band curvature occurred (Fig. 2). To avoid errors due to the loss of material from the vascularized core area, measurements were taken from the outside edge of each translucent zone to the opposite edge of the cross-section (Antoine et al., 1983, Lessa & Duarte-Neto, 2004). Opaque zones (assumed to represent fast growth) were separated by translucent zones (TZ), which were often present in clusters or groups of two or more and were interpreted as representing periodic events indicative of slow growth, as in other tuna species (Cayré & Diouf, 1983; Compéan-Jimenez & Bard, 1983; Megalofonou, 2000; Lessa & Duarte-Neto, 2004). The total number of TZ and their diameter (considered only when they were continuous around the section perimeter) was determined twice by a single reader with a 6-month gap between readings and no knowledge of the individual size or previous count. The coefficient of variation (CV) (Chang, 1982) was calculated to compare the reproducibility of the two readings:
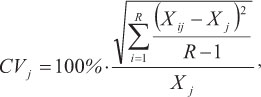
where CVj is the reading precision estimate for the jth fish, Xij is the ith reading of the jth fish, Xj is the mean reading estimate of the jth fish, and R is the number of readings.
The periodicity of TZ deposition was verified through marginal increment ratio (MIR) analysis for all individuals, according to Skomal (1990):

where SD is the spine diameter, Dn is the diameter of the last complete TZ and Dn-1 is the diameter of the penultimate complete TZ. Mean MIR (± Standard Deviation = S.D.) was plotted monthly in order to locate a periodic tendency in TZ formation. Analysis of variance (ANOVA) and the posteriori Tukey test were performed to detect significance differences throughout the year.
The number of lost TZ (due a vascularized core area that increases with size) was estimated based on their position and number in young fish (Cayré & Diouf, 1983; Compéan-Jimenez & Bard, 1983; Sun et al., 2001; Lessa & Duarte-Neto, 2004). The proportionality between structure (spine diameter) and fish size (fork length) was verified through regression analysis, testing linear and curvilinear models. Fork length was then back-calculated for each TZ with the Fraser-Lee equation (Carlander, 1981):

where Lt = the fork length at the deposition of nth translucent zone, a = correction factor corresponding to the intercept, Dn = distance between the translucent zone and the spine edge, SD = the spine diameter, and Lc = fork length at capture. Only the back-calculated lengths of the last ring of each spine were used in the subsequent analysis.
Four models (mi) were fitted both to back-calculated (BCLA) and observed (OLA) length-at-age data, using non-linear least-squares estimation with the Levenberg-Marquard minimization algorithm on the STATISTICA 7.0 program (Stat Soft, Inc.):
(m1) - von Bertalanffy model (von Bertalanffy, 1938):

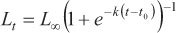
(m2) = Gompertz model (Gompertz, 1825):

(m3) = Logistic model (Ricker, 1975):
(m4) = Richards model (Richards, 1959):
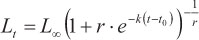
where Lt is the predicted length at age t, Loo is the asymptotic length, k is a relative growth rate parameter, t0 is the age when length is theoretically zero, and r is a dimensionless factor.
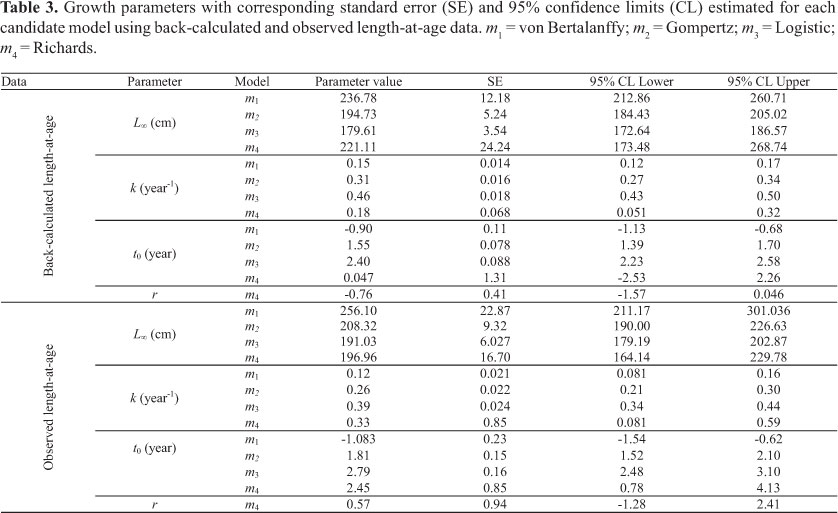
The uncertainty associated with parameter estimation for each model was determined using BCLA and OLA data, comparing the 95% confidence intervals (C.I.), the asymptotic standard error estimated for these parameters and the adjusted R2. Further analyses were carried out using length-at-age data. Model selection was determined using the information theory (Akaike, 1973; Burnham & Anderson, 2002). The model with the smallest Akaike information criterion (AIC) value was chosen as the best. The AIC for the least square is (Katsanevakis, 2006):
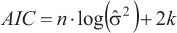
where n is the number of observations and k is the number of parameters estimated including, which is calculated as  , and RSS is the residual least square.
The sustenance of the remaining models was appraised using the AIC differences, for each i candidate model (Burnham & Anderson, 2002). According to the last-cited authors, models with ∆i < 2 have substantial empirical support; models with 4 < ∆i < 7 have considerably less support; and models with ∆i > 10 have essentially none and were not considered for further analysis. Average model were determining by averaging the L(t) across the m sustainable models, using their respective Akaike weiths (wi) (Burnham & Anderson, 2002), calculated as:

According the MMI approach described in Katsanevakis (2006), the model-averaged asymptotic length  was calculated by:

and its unconditional standard error was estimated as described by the lastly quoted author.
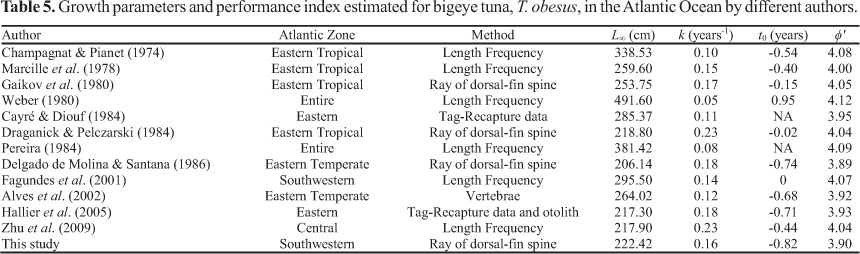
Finally, various sets of growth parameters estimated by different authors for Atlantic Ocean were compared using the performance growth index Φ' (Pauly & Munro, 1984):

Performance index were plotted against minimum and maximum observed lengths of each study and labeled with the respective methodology (calcified structure - CS, length frequency - LF, and tagging data - TD) used to determine the growth parameters, aiming to clarified the reasons for growth parameters variability of bigeye tuna. Size at recapture was not published, the performance index calculated using the parameters estimated by Cayré & Diouf (1984) was not plotted.
Results
Spine sections were taken from 523 individuals measuring between 50.0 and 179.0 cm of FL, showing one to three complete bands in each section with a well-developed absorbed area (Fig. 2). Average CV was 9.6 %, ranging from 9.3 to 9.8 %. Seven spine sections were discarded due to the bad quality that resulted in unrecognized annulus. The relationship between SD and FL was obtained using multiplicative and linear models. The two models were significant in the ANOVA test, presenting F values and determination coefficients (R2) of the same magnitude (Table 1) and no tendency in the distribution of residuals. As both models were appropriate for describing such a relationship, the linear model was chosen for the sake of simplicity (Fig. 3).
The variation of monthly mean MIR had a sinusoidal form, with the lowest value in July and highest in March (Fig. 4). This indicated that there were significant differences throughout the year (ANOVA, p < 0.05). The Tukey test indicated differences between July and March, suggesting that one translucent zone is deposited in spines annually.
The Table 2 displays mean back-calculated length-at-age (BCLA) and observed length-at-age (OLA). Both were similar; except for age one, which corresponded to the smallest value for back-calculated length. In general, the average growth increment decreased with age, with the exception of ages 3 to 4 in observed lengths, which presented a small increase.
Parameter estimation in all models using back-calculated length-at-age data was more consistent than observed data (Table 3). The 95% CI for parameters derived using OLA were wider than those estimated using BCLA and standard errors were usually two times higher. Moreover, adjusted R2 for all models using OLA were lower (for OLA: 0.830,
  ,
,  0.832 and
  not available; for BCLA:
  = 0.919, = 0.916,
  , and
, and  . Thus, only BCLA data were considered in all further analyses.
The Table 4 displays the corresponding adjusted R2, AIC and ∆i for each model. The VGBF was found to be the best model. Richards and Gompertz models presented essential support (Table 4). Hence, the model-averaged asymptotic length  calculated based on this three selected models was 226.25 cm (SE = 20.77). The averaged growth curve is shown in Figure 5. The k and t0 (Table 5) of the VBGF related to were estimated by fitting this function to the back-calculated data fixing the value, which was used for further comparison.
The average growth performance index for the Atlantic T. obesus was 4.01 (±0.08). This index presented no correlations with minimum and maximum observed values, as well as with fishing areas. However, a clear segregation between techniques was observed in Figure 6. Higher values were obtained using parameters estimated from length frequency analysis and lower values from calcified structure techniques (Table 5; Fig. 6).
Discussion
As the hypothesis of a unique bigeye tuna stock in the Atlantic Ocean is the most acceptable (Chow et al., 2000; Durand et al., 2005; ICCAT, 2005), small differences in growth parameters would be expected for different areas. However, the L4 values observed for T. obesus in the Atlantic range from 206.14 to 491.60 cm (fork length), k values range from 0.054 to 0.23 year-1 and t0 range from -0.817 to 0.952 years. Differences are usually attributed to the different ageing approaches employed (Hallier et al. 2005; Brown, 2005).This was also demonstrated here when growth parameters and performance index were compared between techniques (Table 5; Fig. 6).
The most varying results are those estimated by length frequency analysis (Champagnat & Pianet, 1974; Weber, 1980; Pereira, 1984; Fagundes et al., 2001; Zhu et al., 2009), which presents high Loo and low k values. This method is frequently criticized for the overlap of lengths modes, leading to age underestimation, schools based on size rather than on age, spawning not occurring during a discrete period of the year, cohorts developing under different environmental conditions with different growth rates and size-frequency deficiencies when year classes are absent or underrepresented (Lessa & Duarte-Neto 2004). Thus, the approach has been indicated as a method for the corroboration of estimations based on hard structures (Campana, 2001), since some of these potential biases are always present. For instance, analyzing Fagundes et al. (2001) for T. obesus from the southwestern Atlantic, biases due to the under-representation of some modes may have occurred for individuals less than 100 cm FL. Biases due to the subjectivity of mode selection and their overlap may have also been present.
Moreover, the majority of Loo values estimated by frequency analysis for the Atlantic bigeye tuna seem unreliable, as their estimated values may attain up to 491.6 cm (Weber, 1980). As estimated k and Loo values are highly correlated, an unrealistic Loo leads to an unrealistic k value. Also, all studies that used this method presented growth performance index higher than 4.0, reaching 4.12, while calcified structures were grouped below this range (Fig. 6). It seems that growth parameter estimation based on length frequency analysis usually overestimate the growth performance of the Atlantic T. obsesus, that could be dangerous for a species with a high level of exploitation. In contrast, Zhu et al. (2009) observed similar performance index between length frequency and calcified structure techniques for the bigeye tuna caught in the Pacific Ocean, and attributed the reasons for some different results to the minor and major sizes observed in the samples, despites of the similar range of the growth performance for the species in the two oceans.
For the 1997 and 2000 assessments of the Atlantic bigeye tuna (ICCAT, 2005), the growth curve derived by Cayré & Diouf (1984) using tagging and recovered data was considered. However, limitations due to the use these ageing methodologies for highly migratory species were pointed out. Moreover, the low number of recaptured fish and the small range of sizes included in the growth curve were criticized (ICCAT, 2005). This kind of deficiency led to a growth curve established on the basis of specimens whose fast growth rates were extrapolated for all age groups, providing a biased low value for Loo and a high value for the k.
The most similar results were those estimated using hard parts. However, Gaikov et al. (1980) and Draganick & Pelczarski (1984) used readings of first dorsal-fin spines, but considered two translucent zones deposited per year. This led to rather large Loo and low k values, when compared to the present study, and placed their growth performance values near to that estimated by length frequency analysis (Table 5; Fig. 6)
Validation of the periodicity of ring formation, which is essential for understanding the growth process and is critical when hard parts are used (Wilson et al., 1983; Cailliet et al., 1986), was only attempted by Hallier et al. (2005) (using OTC marked otolith) and Gaikov et al. (1980). The latter authors analyzed the relative frequency of the translucent edge, considering the analysis inconclusive due to the absence of year-round data. Although their analysis suggested an annual deposition of one ring, the authors assumed two annual rings by comparing their growth rates with those estimated by Aloncle & Delaporto (1978), who used tag-recapture data.
In the current study, age validation was carried out through MIR analysis, which led to one band formed annually. As required (Campana, 2001; Lessa et al., 2006), a sinusoidal cycle is depicted with values close to zero when a band is completely formed and values close to one (with small standard deviations) when a band begins to form. The deposition of one translucent zone was also obtained for T. obesus caught in the Pacific Ocean by Sun et al. (2001), who observed the tendency of the percentage of terminal translucent zones by month.
According to Cailliet et al. (2006) and Katsanevakis (2006) multi-model inference has become an important tool for age and growth studies. Thus, the information theory (Akaike, 1983; Burnhan & Anderson, 2002) was applied indicating the VBGF as the best model for describing bigeye tuna growth in the Atlantic Ocean. Katsanevakis (2006) recommends this procedure for model selection when studying growth due to its effectiveness in finding a parsimonious approximating model. Since more than one model shows substantial support to describe species growth, the author recommends the use of multi-model inference through model-averaging based on Akaike weights for performing robust parameter estimations and dealing with model selection uncertainty. Contrary to Hallier et al. (2005), Richards and Gompertz models were also considered suitable for described growth of T. obesus, and an averaged model was obtained.
ICCAT (2005) suggests that discrepancies in sex ratios and natural mortality between females and males may be related to differences in growth between sexes. It was not possible to determine growth curves by sex, as gonads were not available during the samplings. However, respectively studying bigeye tuna in the Atlantic and Pacific, Alves et al. (2002) and Sun et al. (2001) did not detect any significant difference between sexes, which led them to propose a pooled growth curve.
Summing up, this study is the first using a hard structure for ageing T. obesus caught in Southwestern Atlantic, which was demonstrated to be the most suitable approach. This is also the first study to employ the multi-model inference leading to more robust growth parameters. The averaged model derived from back-calculation was deemed appropriate for describing the growth of the T. obesus.
Acknowledgements
Authors benefitted of grants (Proc. 301048-OC; 304027-OC; 303604-OC) and Scolarships provided by Conselho Nacional de Desenvolvimento Científico e Tecnológico (CNPq). The research was funded by Ministério do Meio Ambiente (MMA) and Secretaria da Comissão Interministerial para os Recursos do Mar (SECIRM) in the scope of Programa de Avaliação do Potencial Sustentável dos Recursos Vivos da Zona Economica Exclusiva (REVIZEE) and Programa Arquipélago de São Pedro e São Paulo (CNPq/SECIRM). We are indebted to Norte Pesca SA and to the crew of vessels who collaborated in data collection.
Literature Cited
von Bertalanffy, L. 1938. A quantitative theory of organic growth. Human Biology, 10:181-213.Brill, R. W., K. A. Bigelow, M. K. Musyl, K. A. Fritsches & E. J. Warrant. 2005. Bigeye tuna (Thunnus obesus) behavior and physiology and their relevance to stock assessments and fishery biology.
Submitted May 20, 2011
Accepted January 18, 2012
Published March 30, 2012
- Akaike, H. 1973. Information theory as an extension of the maximum likelihood principle. Pp. 267-281. In: Petrov, B. N. & F. Csaki (Eds.). Proceedings of the Second International Symposium on Information Theory. Budapest, Akademiai Kiado.
- Aloncle, H. & F. Delaporte. 1978. Informations sur les captures de petits patudos (Thunnus obesus) effectuces par "La Pelagia" dans parages des acores. ICCAT Collective Volume of Scientific Papers, 7: 94-96.
- Alvarado-Bremer, J. R., B. Stequert, N. W. Robertson & B. Ely. 1998. Genetic evidence for inter-oceanic subdivision of bigeye tuna (Thunnus obesus Lowe) populations. Marine Biology, 132: 547-557.
- Alves. A., P. de Barros & M. R. Pinho. 2002. Age and growth studies of bigeye tuna Thunnus obesus from the Madeira using vertebrae. Fisheries Research, 54: 389-393.
- Antoine, L., J. Mendoza & M. Cayré. 1983. Progress of age and growth assessment of Atlantic skipjack tuna, Euthynus pelamis, from dorsal fin spine. NOAA Technical Reports, NMFS 8: 91-97.
- Asano-Filho, M., F. C. A. Fonteles Holanda, F. J. da Silva Santos, F. Lucena & G. S. L. Pantaleão. 2004. A short note on the catch composition and weight-length relationship of tunas, billfish and sharks of North Brazil. Brazilian Journal of Oceanography, 5: 249-253.
- Bard, F. X. & J. M. Stretta. 1981. Résumé des connaissances actuelles sur la biologie et la pêche des thons tropicaux en Atlantique. Archives Scientifiques du Centre de Recherches Océanografphiques, Abidjan Orstom, 7: 1-37.
- Brown, C. 2005. An overview of Atlantic bigeye tuna (Thunnus obesus) growth studies and implications for age-structured stock assessment. ICCAT Collective Volume of Scientific Papers, 57: 94-114.
- Burnham, K. P. & D. R. Anderson. 2002. Model selection and multimodel inference: a practical information-theoretic approach, 2nd edn. New York, Springer, 488 p.
- Cailliet, G. M., R. L. Radke & B. A. Welden. 1986. Elasmobranch age determination and verification: a review. Pp. 345-360. In: Uyeno, T., R. Arai, T. Taniuchi & K. Matsuura (Eds.). Indo-Pacific fish biology: proceedings of the second international conference on Indo-Pacific fishes. Tokyo, Ichthyology Society of Japan, 985p.
- Cailliet, G. M., W. D. Smith, H. F. Mollet & K. J. Goldman. 2006. Age and growth studies of chondrichthyan fishes: the need for consistency in terminology, verification, validation, and growth function fitting. Environmental Biology of Fishes, 77: 211-228.
- Campana, S. E. 2001. Accuracy, precision, and quality control in age determination, including a review of the use and abuse of age validation methods. Journal of Fish Biology, 59: 197-242.
- Carlander, K. D. 1981 . Caution on the use of the regression method of back-calculating lengths from scale measurements . Fisheries 6: 2-4.
- Cayré, P., J. B. Amon Kothias, T. Diouf & J. M. Stretta. 1993. Biology of tuna. Pp. 147-244. In: Fonteneau, A. & J. Marcille (Eds.). Resources, fishing and biology of the tropical tunas of the Eastern Central Atlantic. Rome, FAO Fisheries Document Paper no 292, FAO, 354 p.
- Cayré, P. & T. Diouf. 1983. Estimating age and growth of little tunny (Euthynnus alleteratus) of the coast of Senegal using dorsal spines sections. Pp 105-110. In: Prince, E. D. & L. M. Pulos (Eds.). Proceedings of the International Workshop on Age determination of Oceanic Pelagic Fishes: Tunas, Billfishes and Sharks. NOAA Technical Reports, NMFS 8, 211p.
- Cayré, P. & T. Diouf.1984. Growth of Atlantic bigeye tuna (Thunnus obesus) according to tagging results. ICCAT Collective Volume of Scientific Papers, 20: 180-187.
- Champagnat, C. & R. Pianet. 1974. Croissance du patudo (Thunnus obesus) dans les régions de Dakar et de Pointe Noire. ICCAT Collective Volume of Scientific Papers, 2: 141-144.
- Chang, W. Y. B. 1982. A statistical method for evaluating the reproducibility of age determination. Canadian Journal of Fisheries and Aquatic Sciences, 39: 1208-1210.
- Chow, S., H. Okamoto, N. Miyabe, K. Hiramatsu & N. Barut. 2000. Genetic divergence between Atlantic and Indo-Pacific stocks of bigeye tuna (Thunnus obesus) and admixture around South Africa. Molecular Ecolology, 9: 221-227.
- Collette, B., A. Acero, A. F. Amorim, A. Boustany, C. Canales Ramirez, G. Cardenas, K. E. Carpenter, S. -KChang, W. Chiang, N. de Oliveira Leite Jr., A. Di Natale, D. Die, W. Fox, F.L. Fredou, J. Graves, F. H. Viera Hazin, M. Hinton, M. Juan Jorda, C. Minte Vera, N. Miyabe, R. Montano Cruz, R. Nelson, H. Oxenford, V. Restrepo, K. Schaefer, J. Schratwieser, R. Serra, C. Sun, L. P. T. Lessa, P. E. Pires Ferreira Travassos, Y. Uozumi, Y. & E. Yanez. 2011. Thunnus obesus In: IUCN 2011. IUCN Red List of Threatened Species. Version 2011.2. www.iucnredlist.org Downloaded on 18 November 2011.
- Collette, B. B. & C. E. Nauen. 1983. FAO species catalogue. Scombrids of the world. An annotated and illustrated catalogue of tunas mackerels, bonitos and related species know to date. FAO Fisheries Synopsis 2, 137p.
- Compéan-Jimenez, G. & F. X. Bard. 1983. Growth increments on dorsal spines of eastern Atlantic bluefin tuna, Thunnus thynnus, and their possible relation to migration patterns. Pp. 77-86. In: Prince, E. D. & L. M. Pulos (Eds.). Proceedings of the International Workshop on Age determination of Oceanic Pelagic Fishes: Tunas, Billfishes and Sharks. NOAA Technical Reports, NMFS 8, 211p.
- Delgado de Molina, A. & J. C. Santana. 1986. Age and growth determination of bigeye tuna (Thunnus obesus, Lowe, 1939) caught in the Canary Islands. ICCAT Collective Volume of Scientific Papers, 25: 130-137.
- Draganick, B. & W. Pelczarski. 1984. Growth and age of bigeye and yellowfin tuna in the central Atlantic as per data gathered by R/V Wieczno. ICCAT Collective Volume of Scientific Papers, 20: 96-103.
- Durand, J. D., A. Collet, S. Chow, B. Guinand & P. Borsa. 2005. Nuclear and mitochondrial DNA markers indicate unidirectional gene flow of Indo-Pacific to Atlantic bigeye tuna (Thunnus obesus) populations, and their admixture off southern Africa. Marine Biology, 147: 313-322.
- Fagundes, L., C. A. Arfelli & A. F. Amorim. 2001. Parâmetros de crescimento e de mortalidade da albacora-bandolim, Thunnus obesus, capturada no litoral sudeste-sul do Brasil (1977-95). Boletim do Instituto de Pesca, 27: 175-184.
- Gaikov, V., V. N. Chur, V. L. Zharov & Y. P. Fedoseev. 1980. On age and growth of the Atlantic bigeye tuna. ICCAT Collective Volume of Scientific Papers, 9: 294-302.
- Gompertz, B. 1825. On the nature of the function expressive of the lawof human mortality and on a new mode of determining the value of life contingencies. Philosophical Transactions of the Royal Society of London, 115: 515-585.
- Gonzalez, E. G., P. Beerli & R. Zardoya1. 2008. Genetic structuring and migration patterns of Atlantic bigeye tuna, Thunnus obesus (Lowe, 1839). BMC Evolutionary Biology, 8: 252.
- Hallier, J. P., B. Stequert, O. Maury & F. X. Bard. 2005. Growth of bigeye tuna (Thunnus obesus) in the eastern Atlantic Ocean from tagging-recapture data and otolith readings. ICCAT Collective Volume of Scientific Papers, 57: 181-194.
- Hanamoto, E. 1987. Effect of oceanographic environment on bigeye tuna distribution. Bulletin of the Japanese Society of Fishery Oceanography, 51: 203-216.
- Hazin, H. G., T. Fredou, F. Hazin & P. Travassos. 2011. Standardized CPUE series of bigeye tuna, Thunnus obesus, caught by brazilian tuna longline fisheries in the Southwestern Atlantic Ocean (1980-2008). ICCAT Collective Volume of Scientific Papers, 66: 387-398.
- Holland, K. N., P. Kleiber & S. M. Kajiura. 1999. Different residence times of yellowfin tuna, Thunnus albacares, and bigeye tuna, T. obesus, found in mixed aggregations over a seamount. Fishery Bulletin, 97: 392-395.
- ICCAT. 2005. 2004 ICCAT bigeye tuna year program symposium. ICCAT Collective Volume of Scientific Papers, 57: 3-60.
- ICCAT. 2010. Report of the 2010 ICCAT bigeye tuna stock assessment session. ICCAT, Pasaia, Gipuzkoa, Spain, July 5 to 9, 133p.
- Katsanevakis, S. 2006. Modelling fish growth: Model selection, multi-model inference and model selection uncertainty. Fisheries Research, 81: 229-235.
- Lessa, R. & P. Duarte-Neto. 2004. Age and growth of yellowfin tuna (Thunnus albacares) in the western equatorial Atlantic, using dorsal fin spines. Fisheries Research, 69: 157-170.
- Lessa, R., Santana, F. M. & P. Duarte-Neto. 2006. A critical appraisal of marginal increment analysis for assessing temporal periodicity in band formation among tropical sharks. Environmental Biology of Fishes, 77: 309-315.
- Marcille, J., C. Champagnat & N. Amada. 1978. Croissance du patudo (Thunnus obesus) de l'océan atlantique intertropical oriental. Archives Scientifiques du Centre de Recherches Océanografphiques, Abidjan Orstom, 9: 73-81.
- Megalofonou, P. 2000. Age and growth of Mediterranean albacore. Journal of Fish Biology, 57: 700-715.
- Pauly, D. & J. L. Munro. 1984. A simple method for comparing the growth of fishes and invertebrates. Fishbyte, 1: 5-6.
- Pereira, J. 1984. Croissance du patudo (Parathunnus obesus) de l'Atlantique. International Commission for the Conservation of Atlantic Tunas, JTT/84/18.
- Pereira, J. 1987. Maturité sexuelle et sex ratio dês patudos capturés aux Açores. ICCAT Collective Volume of Scientific Papers, 26: 168-173.
- Richards, F. J. 1959. A flexible growth function for empirical use. Journal of Experimental Botany, 10: 290-300.
- Ricker, W. E. 1975. Computation and interpretation of biological statistics of fish populations. Bulletin of the Fisheries Research Board of Canada, 191: 1-382.
- Saito, S. 1975. On the depth of capture of bigeye tuna by further improved vertical long-line in the tropical Pacific. Bulletin of the Japanese Society of Scientific Fisheries, 41: 831-841.
- Schaefer, K. M. 1999. Comparative study of some morphological features of yellowfin (Thunnus albacares) and bigeye (Thunnus obesus) tunas. Inter-American Tropical Commission Bulletin, 21: 489-525.
- Skomal, G. B. 1990. Age and growth of the blue shark, Prionace glauca, in the North Atlantic. Unpublished M.Sc. Dissertation, University of Rhode Island, Kingston, RI. 82p.
- Sun, C. L., C. L. Huang & S. Z. Yeh. 2001. Age and growth of the bigeye tuna, Thunnus obesus, in the western Pacific Ocean. Fishery Bulletin, 99: 502-509.
- Vaske-Jr., T., R. P. Lessa, M. de Nóbrega, S. Montealegre-Qijano, F. M. Santana & J. L. Bezerra Jr.. 2004. A checklist of fishes from Saint Peter and Saint Paul Archipelago, Brazil. Journal of Applied Ichthyology, 20: 1-5.
- Weber, E. 1980. An analysis of Atlantic bigeye tuna (Thunnus obesus) growth. ICCAT Collective Volume of Scientific Papers, 9: 303-307.
- Wilson, C. A., E. D. Brothers, J. M. Casselman, C. L. Smith & A. Wild. 1983. Glossary. Pp. 207-208. In: Prince, E. D. & L. M. Pulos (Eds.). Proceedings of the International Workshop on Age determination of Oceanic Pelagic Fishes: Tunas, Billfishes and Sharks. NOAA Technical Reports, NMFS 8, 211p.
- Zavala-Camin, L. A. 1978. Frecuencia mensual de tallas y sew ratio del patudo (Thunnus obesus) capturado el sudeste y sur del Brasil (1976 Agosto 1977). ICCAT Collective Volume of Scientific Papers, 7: 105-6.
- Zhu, G., Y. Zhou, L. Xu & X. Dai. 2009. Growth and mortality of bigeye tuna Thunnus obesus (Scombridae) in the eastern and central tropical Pacific Ocean. Environmental Biology of Fishes, 85: 127-137.
- Zhu, G., X. Dai, L. M. Song & L. Xu. 2011. Size at sexual maturity of bigeye tuna Thunnus obesus (Perciformes: Scombridae) in the tropical waters: a comparative analysis. Turkish Journal of Fisheries and Aquatic Sciences, 11: 149-156.
Publication Dates
-
Publication in this collection
18 Apr 2012 -
Date of issue
2012
History
-
Received
20 May 2011 -
Accepted
18 Jan 2012