Abstracts
We tested the hypothesis that streams in deforested areas shelter different fish communities to nearby forested areas, and that these disparities are due to environmental parameters that limit or benefit different species according to their functional traits. We compared the community composition of three south east Brazilian streams flanked by riparian forest with three nearby streams in deforested areas. The following functional traits were considered: diet, habitat use, water flow preference, size, and hypoxia tolerance. Differentiation between forested and deforested streams corresponded with the different contributions of three functional groups. Species reported in the literature to be hypoxia tolerant, and exhibiting a variable combination of the other traits prevailed in deforested streams, although we did not find substantial differences in oxygen levels between forested and deforested streams. In forested streams, benthic species associated with a high water flow and an insectivorous diet were dominant. Changes in streams induced by deforestation which are associated with habitat availability, food resources, and physicochemical conditions appear to restrict the occurrence of specialized species and instead benefit tolerant generalists.
Community ecology; Deforestation; Functional diversity; Traits
A hipótese de que as alterações ambientais causadas pelo desmatamento nos riachos podem restringir a ocorrência de espécies a partir de suas características funcionais foi testada. Comparamos a composição das comunidades de três riachos do sudeste do Brasil providos de floresta riparia nas suas margens com três riachos da mesma região com zona ripária desmatada. Os seguintes atributos funcionais foram considerados: dieta, uso de hábitat, preferência por fluxo, tamanho e tolerância à hipóxia. A diferenciação dos riachos, em especial entre os riachos florestados e desmatados, foi maior do que o esperado ao acaso e correspondeu à contribuição diferencial de três grupos funcionais. As espécies indicadas na literatura como sendo tolerantes à hipóxia e que apresentaram combinação variável das outras características foram mais abundantes nos riachos desmatados, embora não tenhamos observado diferenças substanciais nos níveis de oxigênio dissolvido entre os riachos florestados e desmatados. Nos riachos florestados predominaram espécies de hábitos especializados, bentônicas, associadas com alta velocidade de água e dieta insetívora. As alterações nos riachos provocadas pelo desmatamento relacionadas com a disponibilidade de hábitat, recursos alimentares e condições físico-químicas restringem a ocorrência de grupos de espécies especializadas e beneficiam espécies tolerantes e generalistas.
Introduction
Riparian deforestation exerts profound negative effects on rivers and streams. By altering abiotic conditions, such as temperature and dissolved oxygen, deforestation has long predicted to influence recruitment and survival of Neotropical aquatic organisms (Lowe-McConnell, 1987Lowe-McConnell, R. H. 1987. Ecological studies in tropical fish communities. Cambridge, Cambridge University Press. 382p. (Cambridge tropical biology series).). Riparian deforestation may also influence the input of allochthonous material, which provides food, shelter and breeding sites for aquatic animals (Fausch & Northcote, 1992Fausch, K. D. & T. G. Northcote. 1992. Large woody debris and salmonid habitat in a small coastal British Columbia stream. Canadian Journal of Fisheries and Aquatic Sciences, 49: 682-693.; Schneider & Winemiller, 2008Schneider, K. N. & K. O. Winemiller. 2008. Structural complexity of woody debris patches influences fish and macroinvertebrate species richness in a temperate floodplain-river system. Hydrobiologia, 610: 235-244.). The loss of shade from riparian forest canopy may also alter the growth of photosynthesizing aquatic organisms (Lorion & Kennedy, 2009Lorion, C. M. & B. P. Kennedy. 2009. Riparian forest buffers mitigate the effects of deforestation on fish assemblages in tropical headwater streams. Ecological Applications, 19: 468-479.). Deforestation may also reduce the input or retention of sediment and other material from the surrounding terrestrial environment (Pusey & Arthington, 2003Pusey, B. J. & A. H. Arthington. 2003. Importance of the riparian zone to the conservation and management of freshwater fish: a review. Marine and Freshwater Research, 54: 1-16.), in turn influencing water quality and substrate composition (Cruz et al., 2013Cruz, B. B., L. E. Miranda & M. Cetra. 2013. Links between riparian landcover, instream environment and fish assemblages in headwater streams of south-eastern Brazil. Ecology of Freshwater Fish, 22: 607-616.). Finally, riparian deforestation may favour marginal grass and weed proliferation (Pusey & Arthington, 2003; Rocha et al., 2009Rocha, F. C., L. Casatti, F. R. Carvalho & A. M. Silva. 2009. Fish assemblages in stream stretches occupied by cattail (Typhaceae, Angiospermae) stands in Southeast Brazil. Neotropical Ichthyology, 7: 241-250.), which benefits some fish species (Rocha et al., 2009).
Changes in species abundance are expected to be strongly influenced by ecological characteristics, i.e, functional traits of the species in question. For example, Casatti et al. (2012)Casatti, L. & R. M. C. Castro. 1998. A fish community of the São Francisco River headwaters riffles, southeastern Brazil. Ichthyological Exploration of Freshwaters, 9: 229-242. showed that the dominant species in streams of south-eastern Brazil exhibited different functional traits along a gradient of riparian forest degradation, demonstrating a correlation between the functional properties of species, and local environmental conditions. In addition, Teresa & Casatti (2012)Teresa, F. B. & L. Casatti. 2012. Influence of forest cover and mesohabitats types on functional and taxonomic diversity of fish communities in Neotropical lowland streams. Ecology of Freshwater Fish, 21: 433-442. found that deforested mesohabitats harboured greater functional and species diversity due to the increased abundance of opportunistic species that are able to explore new ecological niches consequent to deforestation. The trait-habitat relationship shown in these studies highlights the influences of environmental constraints on community composition (Poff, 1997Poff, N. L. R. 1997. Landscape filters and species traits: towards mechanistic understanding and prediction in stream ecology. Journal of the North American Benthological Society, 16: 391-409.). Trait-based frameworks are a promising way to explore changes in the structure of fish communities following environmental change (Cruz et al., 2013).
In this study, we compare the community composition of streams running through forested and nearby deforested areas of south-eastern Brazil. We hypothesized that communities in the forested and deforested streams are composed of different groups of species with contrasting functional traits. The analytical strategy we used was adapted from Pavoine et al. (2009aPavoine, S., A. B. Dufour & D. Chessel. 2004. From dissimilarities among species to dissimilarities among communities: a double principal coordinate analysis. Journal of Theoretical Biology, 228: 523-537.), who proposed a partitioning of phylogenetic diversity along phylogenetic branches to assess the significance of phylogenetic lineages in the differentiation of communities. Because functional dendrograms have the same topological structure as a phylogenetic tree, we argue that Pavoine et al. (2009a) approach can be modified for exploring whether species groups that share functional traits (i.e., functional groups) are important for differentiating communities - in this case from forested versus deforested streams.
Material and Methods
Study area. This study was undertaken in the rio São José dos Dourados basin, upper rio Paraná system, southeastern Brazil (Fig. 1). Since the second half of the 19th century, this region has experienced high rates of deforestation (Monbeig, 1998Monbeig, P. 1998. Pioneiros e fazendeiros de São Paulo. 2.ed. São Paulo, Hucitec. 392p. (Geografia: teoria e realidade, v. 11).), and currently, only 4% of the original vegetation cover remains in the region (Nalon et al., 2008Nalon, M. A., I. S. A. Matto & G. A. D. C. Franco. 2008. Meio físico e aspectos da vegetação. Pp. 12-21. In: Rodrigues, R. R. & V. L. R. Bononi (Orgs.). Diretrizes para conservação e restauração da biodiversidade no estado de São Paulo. São Paulo, Secretaria do Meio Ambiente, Instituto de Botânica, Fapesp, Programa Biota/Fapesp.). The soil of the region is characterized by sandy and unconsolidated clay sediments that have a high erosive potential (IPT, 2000IPT (Instituto de Pesquisas Tecnológicas do Estado de São Paulo), 2000. Diagnóstico da situação atual dos recursos hídricos e estabelecimento de diretrizes técnicas para a elaboração do plano da Bacia Hidrográfica do São José dos Dourados. Relatório nº 40675. Fundo Estadual de Recursos Hídricos, São Paulo.). The climate is tropical, with maximum temperatures between 31 and 32ºC, minimum temperatures between 13 and 14ºC and annual rainfall between 1,300 and 1,800 mm (Silva et al., 2007Silva, A. M., L. Casatti, C. A. Álvares, A. M. Leite, L. A. Martinelli & S. F. Durrant. 2007. Soil loss risk and habitat quality in streams of a meso-scale river basin. Scientia Agricola, 64: 336-343.). It has two well-defined climatic periods: a dry season with lower rainfall, between June and August, and a wet season with higher rainfall, between January and February (IPT, 2000).
Map of the study area, showing: the state of São Paulo (A); and the rio São José dos Dourados basin (B), where the forested streams (black circles), which were located in the largest forest fragments of the river basin (grey areas), and the deforested streams (grey circles) were located (C).
We sampled the ichthyofauna during daytime in the dry season (from September to October 2009 and from April to July 2010), in approximately 300-m sections of forested and deforested streams (2nd or 3rd order). The forested streams (n = 3) were located in the largest forest fragment of the river basin (seasonal semi-deciduous forest > 1600 ha). The deforested streams (n = 3) exhibited no forested vegetation in the riparian buffer and were located in a region dominated by pasture (Fig. 1). There were no forest fragments upstream or downstream from the deforested sections larger than 10 ha. The sampled streams were non-randomly distributed within the study area due to the difficulty of finding deforested streams that were comparable to forested ones in depth and width. A potential limitation of the study (imposed by the availability of forest remnants) is that all the deforested sites were upstream of the forested sites. Nonetheless, the altitude above sea level for the forested sites (mean 385.6, SD 8.4 meters) is not greatly different to the altitude of the deforested sites (mean 463.0, SD 23.38 meters). Moreover, hydrological variables such as water flow, width and depth are also similar between forested and deforested stream (see results), demonstrating that the streams in the forested and deforested sites have similar gradients and general structure. An additional limitation of the study is that the deforested streams are closer to each other than the forested ones. However, a prior study noted that distance alone is not a major determinant of species composition variation within this river basin (Casatti et al., 2012).
Ichthyofaunal sampling. We sampled the ichthyofauna in 126 5-meters long sections, ranging from 16 and 24 sections per stream, for a total of 64 sections in forested streams and 62 sections in deforested streams. For a given stream, the sections were distributed within a 300-m stretch and were chosen to represent mesohabitat variability (riffles, pools and runs, etc.). Prior to sampling, each section was isolated up- and downstream with block nets. Sampling was undertaken with electric fishing gear (alternating current generator, 220 V, 50-60 Hz, 3.4-4.1 A, 1,000 W) by successively sweeping electrodes and dip nets along the section. We terminated sampling in each section when no further fish were captured after a dip net sweep. For gut content analyses, whole fish were euthanized humanely, and then fixed in a solution of formalin (10%) and preserved in 70% ethanol.
Sample unit characterization. We measured the surface width, and depth (measured at five points equidistant from one shore to the other), and estimated the proportion of stable substrate that allows colonization by benthic fauna (consolidated clay, gravel, pebble, and rock) (Casatti et al., 2006). We measured the volume occupied by submerged vegetation in each transect. Presence of leaf litter was measured as the proportion of channel area covered. The abundance of benthic macrophytes and tree trunks or branches was measured as the proportion of sections in a given stream where these structures were present. We measured water velocity with a General Oceanics2, model 2030, mechanical flowmeter at approximately 60% of the total depth at the center of each section. The following metrics were recorded at the midpoint of each stream stretch. Dissolved oxygen (DO) was measured using an oximeter (LT Lutron, model DO 5510) and conductivity, pH, turbidity and temperature were measured using a water quality checker (Horiba, model U-10) in the morning (09h00-11h00 am), approximately at the middle of the channel.
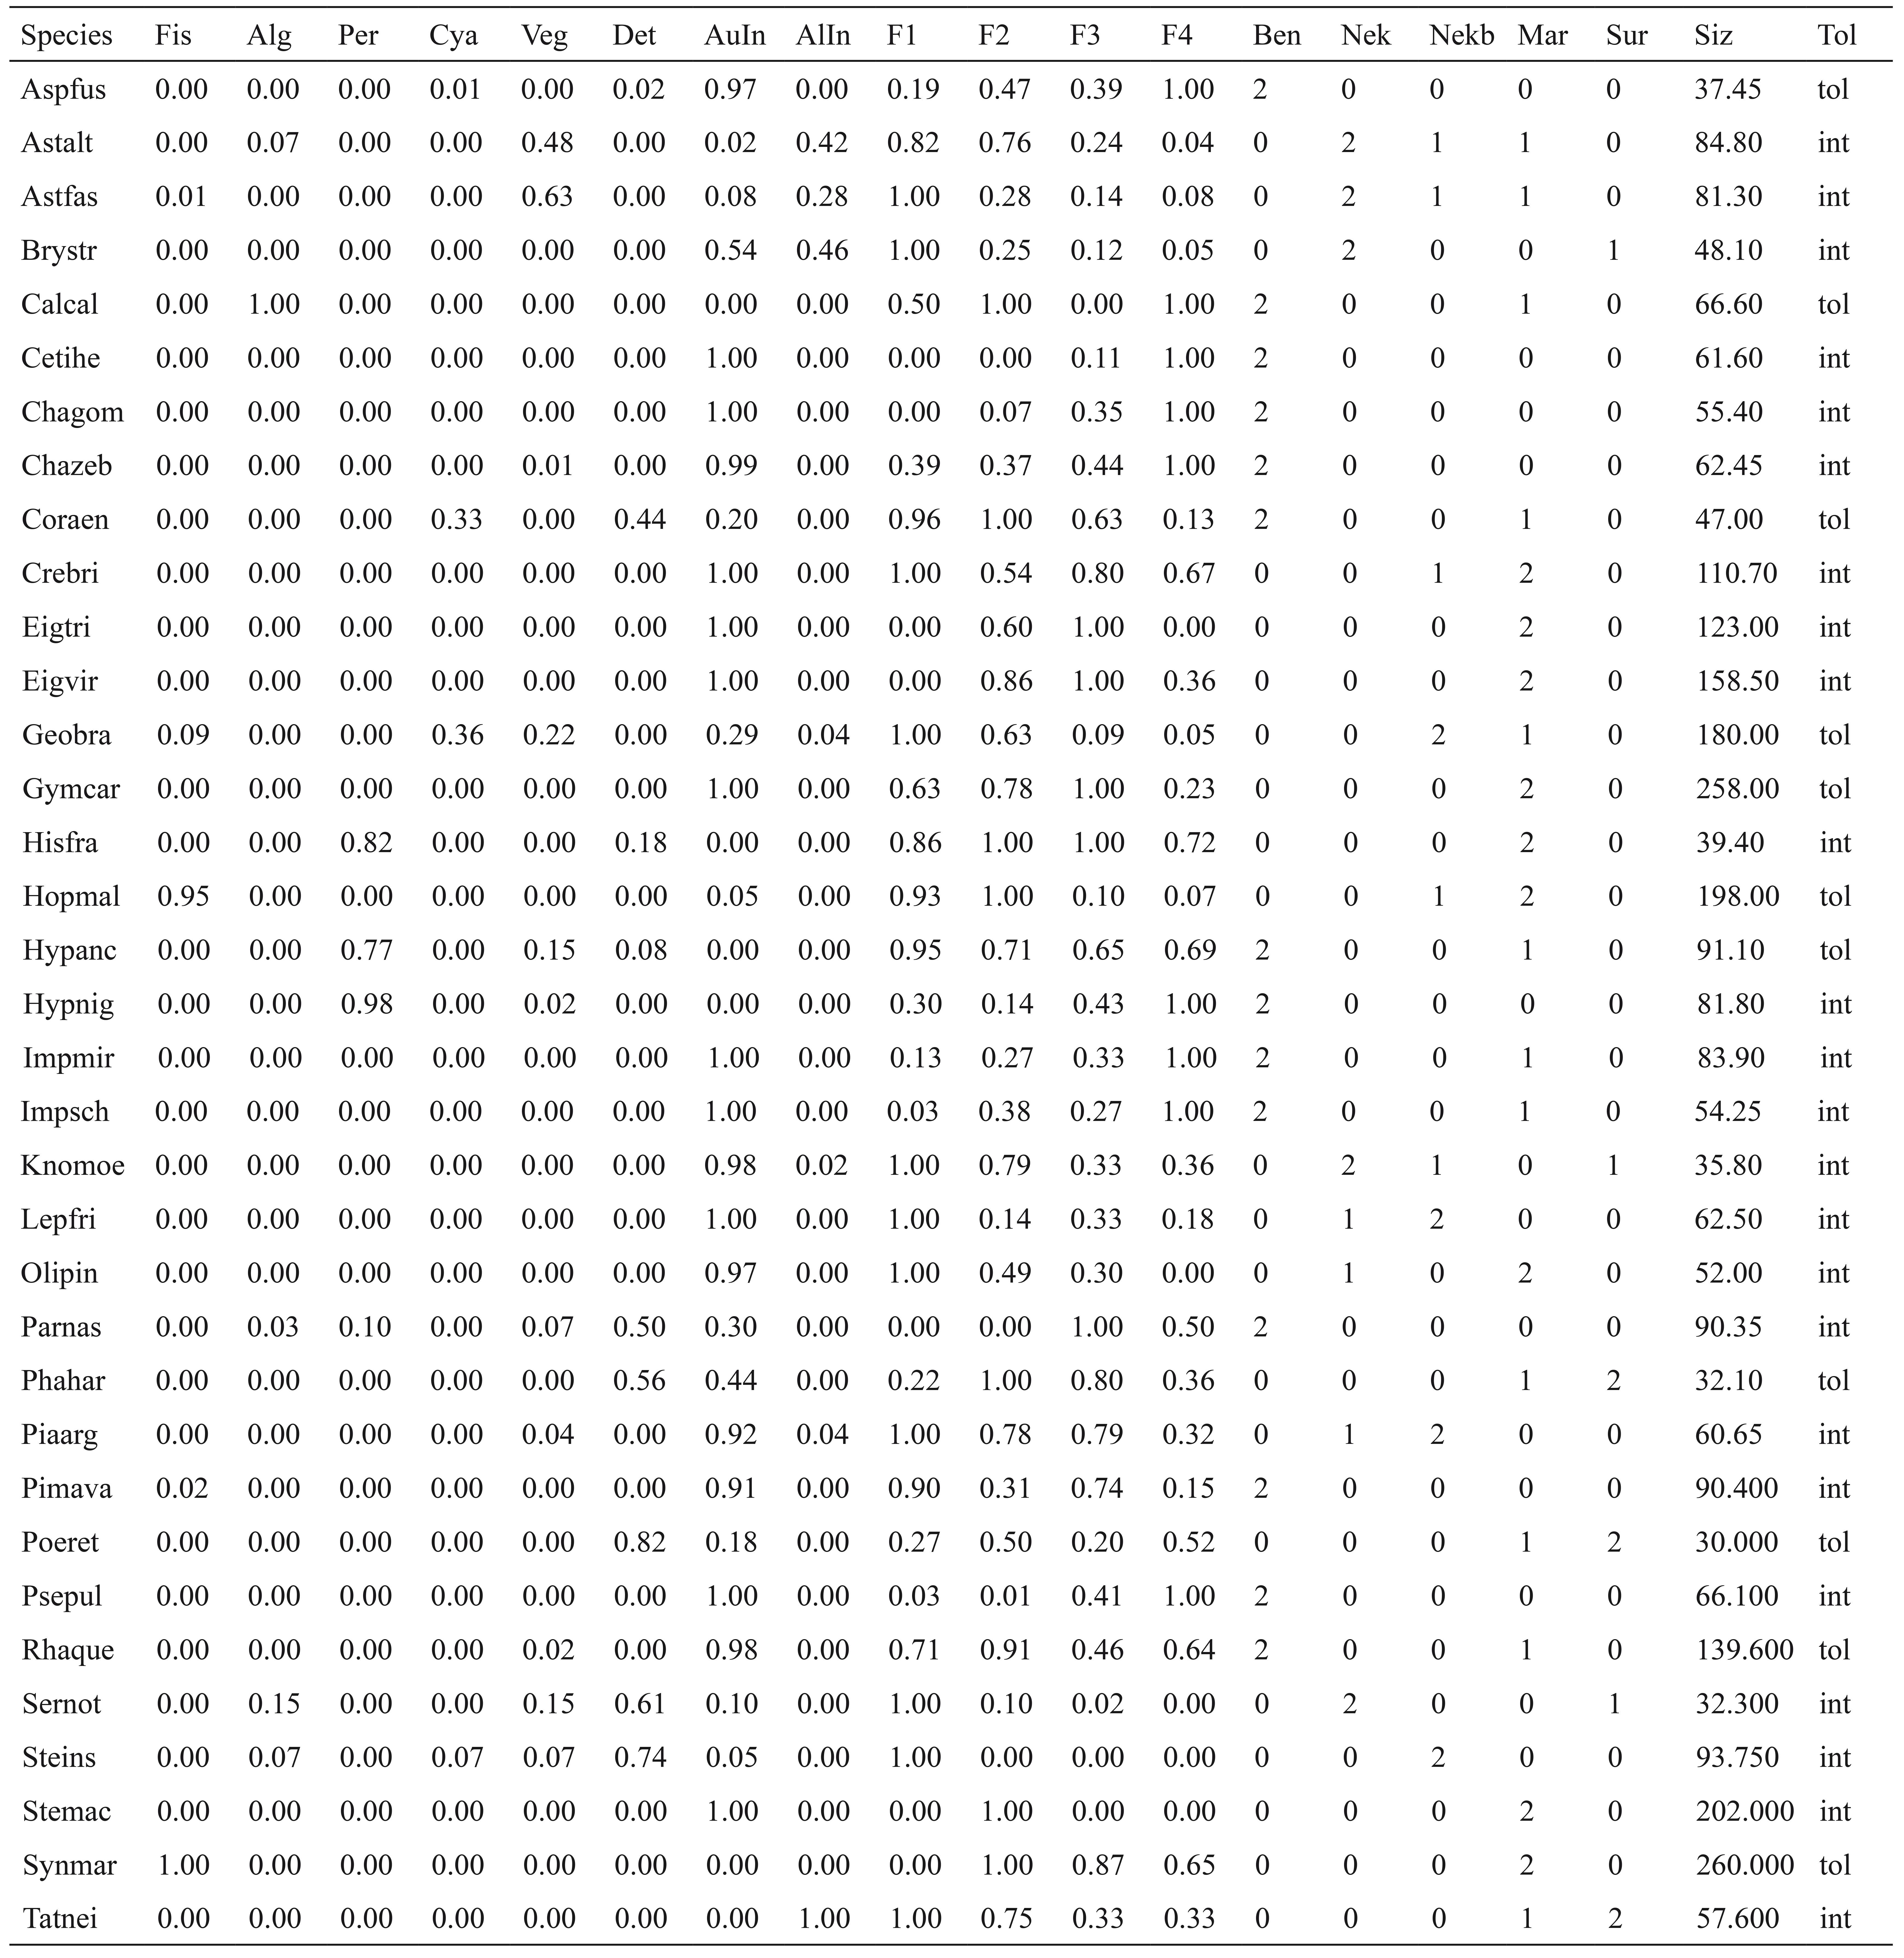
Functional traits. We used five functional traits (diet, habitat use, water flow preference, size, and hypoxia tolerance; Appendix 1 Appendix 1. Functional traits of species present in more than 3% of the sampled segments. Diet: Fis = fish, Alg = algae, Per = periphyton, Cya = cyanobacteria, Veg: vegetal fragments, Det = detritus, AuInv = autochthonous invertebrates; AlInv = allochthonous invertebrates; Current preference: F1 = 0 to 0.25 cm/s; F2 = 0.26 to 0.45 cm/s; F3 = 0.46 to 0.65 cm/s; F4 > 0.66 cm/s; Habitat use: Ben = benthic, Nec = nektonic, Necb = nekctobenthic, Mar = marginal, Sur = surface; Siz = size (mm); Tolerance to hypoxia based on reports in the literature*: tol = tolerant, int = intolerant. Species codes as in Table 2. *Kramer & Mehegan (1981), Araujo & Garutti (2003), Bozzetti & Schulz (2004), Casatti et al. (2006), Rocha et al. (2009) and Casatti et al. (2012). ). These traits represent ecological and life-history features of species that are presumed to be directly or indirectly related to ecosystem characteristics and processes as follows: (1) microhabitat availability and sedimentation (habitat use and water flow preference); (2) productivity and organic enrichment (diet and size); (3) resource availability and use, trophic dynamics, and nutrient cycling (diet, habitat use and size); and (4) oxygen availability (hypoxia tolerance) (Bunn et al., 1999Bunn, S. E., P. M. Davies & T. D. Mosisch. 1999. Ecosystem measures of river health and their response to riparian and catchment degradation. Freshwater Biology, 41: 333-345.; Lorion & Kennedy, 2009; Murphy & Hall, 1981Murphy, M. L. & J. D. Hall. 1981. Vaired effects of clear-cut logging on predators and their habitat in small streams of the Cascade Mountains, Oregon. Canadian Journal of Fisheries and Aquatic Sciences, 38: 137-145.; Smale & Rabeni, 1995Smale, M. A. & C. F. Rabeni. 1995. Hypoxia and hyperthermia tolerances of headwater stream fishes. Transactions of the American Fisheries Society, 124: 698-710.).
Diet. We evaluated species diet through stomach content analyses. The stomachs of 10 specimens of each species (except where less than 10 individuals were available) from deforested streams, and 10 specimens of each species in deforested streams were removed and opened for inspection and identification. Food items were identified and classified into categories (detritus, insects, fish, periphyton, cyanobacteria, higher plant fragments, and algae). We estimated visually the percentage contribution of each stomach item. The frequency and percentage occurrence of each item were combined to obtain a feeding index for each species (IAi, following Kawakami & Vazzoler, 1980Kawakami, E. & G. Vazzoler. 1980. Método gráfico e estimativa de índice alimentar aplicado no estudo de alimentação de peixes. Boletim do Instituto Oceanográfico, 29: 205-207.):

where Oi is the number of stomachs in which the item i occurred in relation to total number of stomachs analyzed, and D is the proportion of stomachs in which the item i was dominant. The diet matrix values correspond to IAi values. For species that occurred in both forested and deforested streams the final IAi values were the mean between IAi obtained from each group of streams.
Habitat use. We classified species according to microhabitat use (benthos, nekton-benthos, nekton, surface and margin) based entirely on underwater observations (a total of 1200 h) performed in the six studied streams prior to sampling. Value 1 was assigned to any habitat that a species occupied, even if only occasionally. Value 2 was assigned to habitats where a species was usually located. Additionally, to complement in situ observations, we used data from the literature to characterize habitat use (Casatti & Castro, 1998Castro, R. M. C. 1999. Evolução da ictiofauna de riachos sul-americanos: padrões gerais e possíveis processos causais. Pp. 139-155. In: Caramaschi, E. P., R. Mazzoni & P. R. Peres-Neto (Eds.). Ecologia de peixes de riachos: estado atual e perspectivas. Rio de Janeiro, Programa se Pós-graduação em Ecologia, Instituto de Biologia, Universidade Federal do Rio de Janeiro. (Oecologia Brasiliensis, 6).; Casatti et al., 2001; Ceneviva-Bastos et al., 2010Ceneviva-Bastos, M., L. Casatti & D. C. Rossa-Feres. 2010. Meso and microhabitat analysis and feeding habits of small nektonic characins (Teleostei: Characiformes) in Neotropical streams. Zoologia: an international journal for Zoology, 27: 191-200.).
Water velocity preference. Water velocity preference was characterized by calculating a preference index (PI) for each species in each of the four water velocity classes (F1 = 0 to 0.25 cm s-1; F2 = 0.26-0.45 cm s-1; F3 = 0.46-0.65cm s-1; and F4 > 0.66 cm s-1), based on methods proposed by Freeman et al. (1997)Freeman, M. C., Z. H. Bowen & J. H. Crance. 1997. Transferability of habitat suitability criteria for fishes in warmwater streams. North American Journal of Fisheries Management, 17: 20-31.. The final PI value was standardized (ranging from 0 to 1) by dividing each species' PI value in each class by the maximum PI found for the species:

where (1) P i is the preference value for the class i, Ni is the proportional abundance of the species in the sections of class i in relation to specimens sampled considering all sections and H i is the proportional number of sections of the class i in relation to all sections sampled; (2) PI i is the suitability index for the class i and P max is the highest preference value obtained for a class. The final PI values for species that occurred in both stream groups (forested and deforested) were represented by the mean values for each group because water velocity preferences were consistent among stream groups (Teresa & Casatti, 2013).
Size. The standard lengths of all specimens were measured (with a caliper) and reported for each species as the longest sampled individuals.
Hypoxia tolerance. Species were characterized as either hypoxia tolerant or hypoxia-intolerant based on previous studies that have recorded such species in low dissolved oxygen conditions (Araujo & Garutti, 2003; Bozzetti & Schulz, 2004Bozzetti, M. & U. H. Schulz. 2004. An index of biotic integrity based on fish assemblages for subtropical streams in southern Brazil. Hydrobiologia, 529: 133-144.; Casatti et al., 2006; Casatti et al., 2012; Kramer & Mehegan, 1981Kramer, D. L. & J. P. Mehegan. 1981. Aquatic surface respiration, an adaptive response to hypoxia in the guppy, Poecilia reticulata (Pisces, Poeciliidae). Environmental Biology of Fishes, 6: 299-313.; Rocha et al., 2009; Teresa & Casatti, 2012).
Data analyses. For data analyses, we used only species that occurred in more than 3% of the samples - taken from all six streams combined. This approach was taken to reduce biased estimations of diet and water velocity preferences etc., due to a small sample size. The final species matrix was comprised of the mean species abundance across sections in each stream because the number of sampled sections differed among streams.
We built a functional dendrogram using a distance matrix that consisted of the similarities among species for the five functional traits described in Materials and Methods: Functional Traits. This matrix was obtained from a generalization of the Gower's distance proposed by Pavoine et al. (2009b), which allows for a combination of traits with different statistical natures (e.g. fuzzy, categorical, and quantitative). The final functional dendrogram was built using the Unweighted Pair Group Method with Arithmetic Mean (UPGMA) (Sneath & Sokal, 1973Sneath, P. H. A. & R. R. Sokal. 1973. Numerical taxonomy: the principles and practice of numerical classification. San Francisco, W. H. freeman.).
Functional diversity was calculated using Rao's quadratic entropy index (QE). This index is based on the sum of species pairwise distances from a community according to their abundance (Botta-Dukát, 2005Botta-Dukát, Z. 2005. Rao's quadratic entropy as a measure of functional diversity based on multiple traits. Journal of Vegetation Science, 16: 533-540.). When QE is used to measure functional diversity through a dendrogram, the distance between two species is equal to the sum of the lengths of the branches linking both species (Pavoine et al., 2005). We calculated the QE for each dendrogram partition, adapting the methodology of Pavoine et al. (2009a) to analyze a functional dendrogram instead of a phylogenetic tree. In this case, the functional group originating at each partition was considered as the terminal branch, and the group abundance was given by the sum of the abundances of the species composing the group.
We used the functional β diversity as a measure of differentiation among streams (i.e. dissimilarity on functional composition among the stream communities). We partitioned the QE into γ, α and β, where regional functional diversity (γ) is the mean diversity of each stream (α) plus the diversity between streams (β) (Lande, 1996Lande, R. 1996. Statistics and partitioning of species diversity, and similarity among multiple communities. Oikos, 76: 5-13.). The β/γ values (i.e., variability between streams) for each dendrogram partition were calculated and compared to simulated values. The simulation was performed by a randomization of the species positions among the tips of the functional dendrogram (Hardy, 2008Hardy, O. J. 2008. Testing the spatial phylogenetic structure of local communities: statistical performances of different null models and test statistics on a locally neutral community. Journal of Ecology, 96: 914-926.), so that the connection between species abundance and the functional dendrogram is permuted. The β/γ values larger than expected by chance indicate a greater functional dissimilarity between communities than within communities. According to our hypotheses, forested and deforested streams would present communities with different functional compositions. Therefore, we expected high functional β diversity for at least one partition of the dendrogram.
Because not all functional groups formed in the partitions are informative, we carried out a complementary analysis in order to identify the most important functional groups for the differentiation of forested and deforested streams. For this, we performed a double principal coordinate analysis (DPCoA) (Pavoine et al., 2004). The DPCoA analyze the relation between two matrices: (i) a matrix containing the differences among species (dissimilarity matrix) as described above; (ii) a matrix containing the species distribution among the stream communities (abundance matrix) (Pavoine et al., 2004). This analysis provides an ordination in a multidimensional space assembling the species points and the sample points (streams in our case). The species points define the original differences between species and the sample points define the deduced differences between communities based on species that co-occur in each sample (Pavoine et al., 2004). Thus, by highlighting the species that constitute each functional group of interest, we were able to identify those important for streams differentiation. All analyses were performed with the R software (R Development Core Team, 2009R Development Core Team. 2009. R: A language and environment for statistical computing. R Foundation for Statistical Computing, Vienna, Austria. Available from: http://www.R-project.org/ (01/05/2013).
http://www.R-project.org/...
), using the packages "ade4" (Dray & Dufour, 2007Dray, S. & A. B. Dufour. 2007. The ade4 package: implementing the duality diagram for ecologists. Journal of Statistical Software, 22: 1-20.) and the functions "aptree", "abg.aptree", and "rtest.aptree" (Pavoine et al., 2009a).
Results
We observed that forested and deforested streams differed regarding the proportion of stable substrate, presence of leaf litter, tree trunks and branches, aquatic macrophytes and the volumes of marginal vegetation in contact with water. The forested streams had a higher proportion of stable substrate, leaf litter, and tree trunks and branches (t > 3.63, P < 0.05), while the deforested streams exhibited a larger volume of marginal vegetation in contact with water (t = -5.9, P = 0.02) and a higher proportion of aquatic macrophytes (t = -3.6, P = 0.02). In addition, the dissolved oxygen values were slightly higher in forested streams than in deforested streams (t = 3.1, P = 0.03), although all sections in both the forested and deforested streams exhibited normoxic conditions (Table 1).
The mean ± standard deviation (SD) of the structural and physicochemical variables of forested (F1 to F3) and deforested (D1 to D3) streams. Significant differences between the groups of streams are in bold (t-test, P < 0.05).
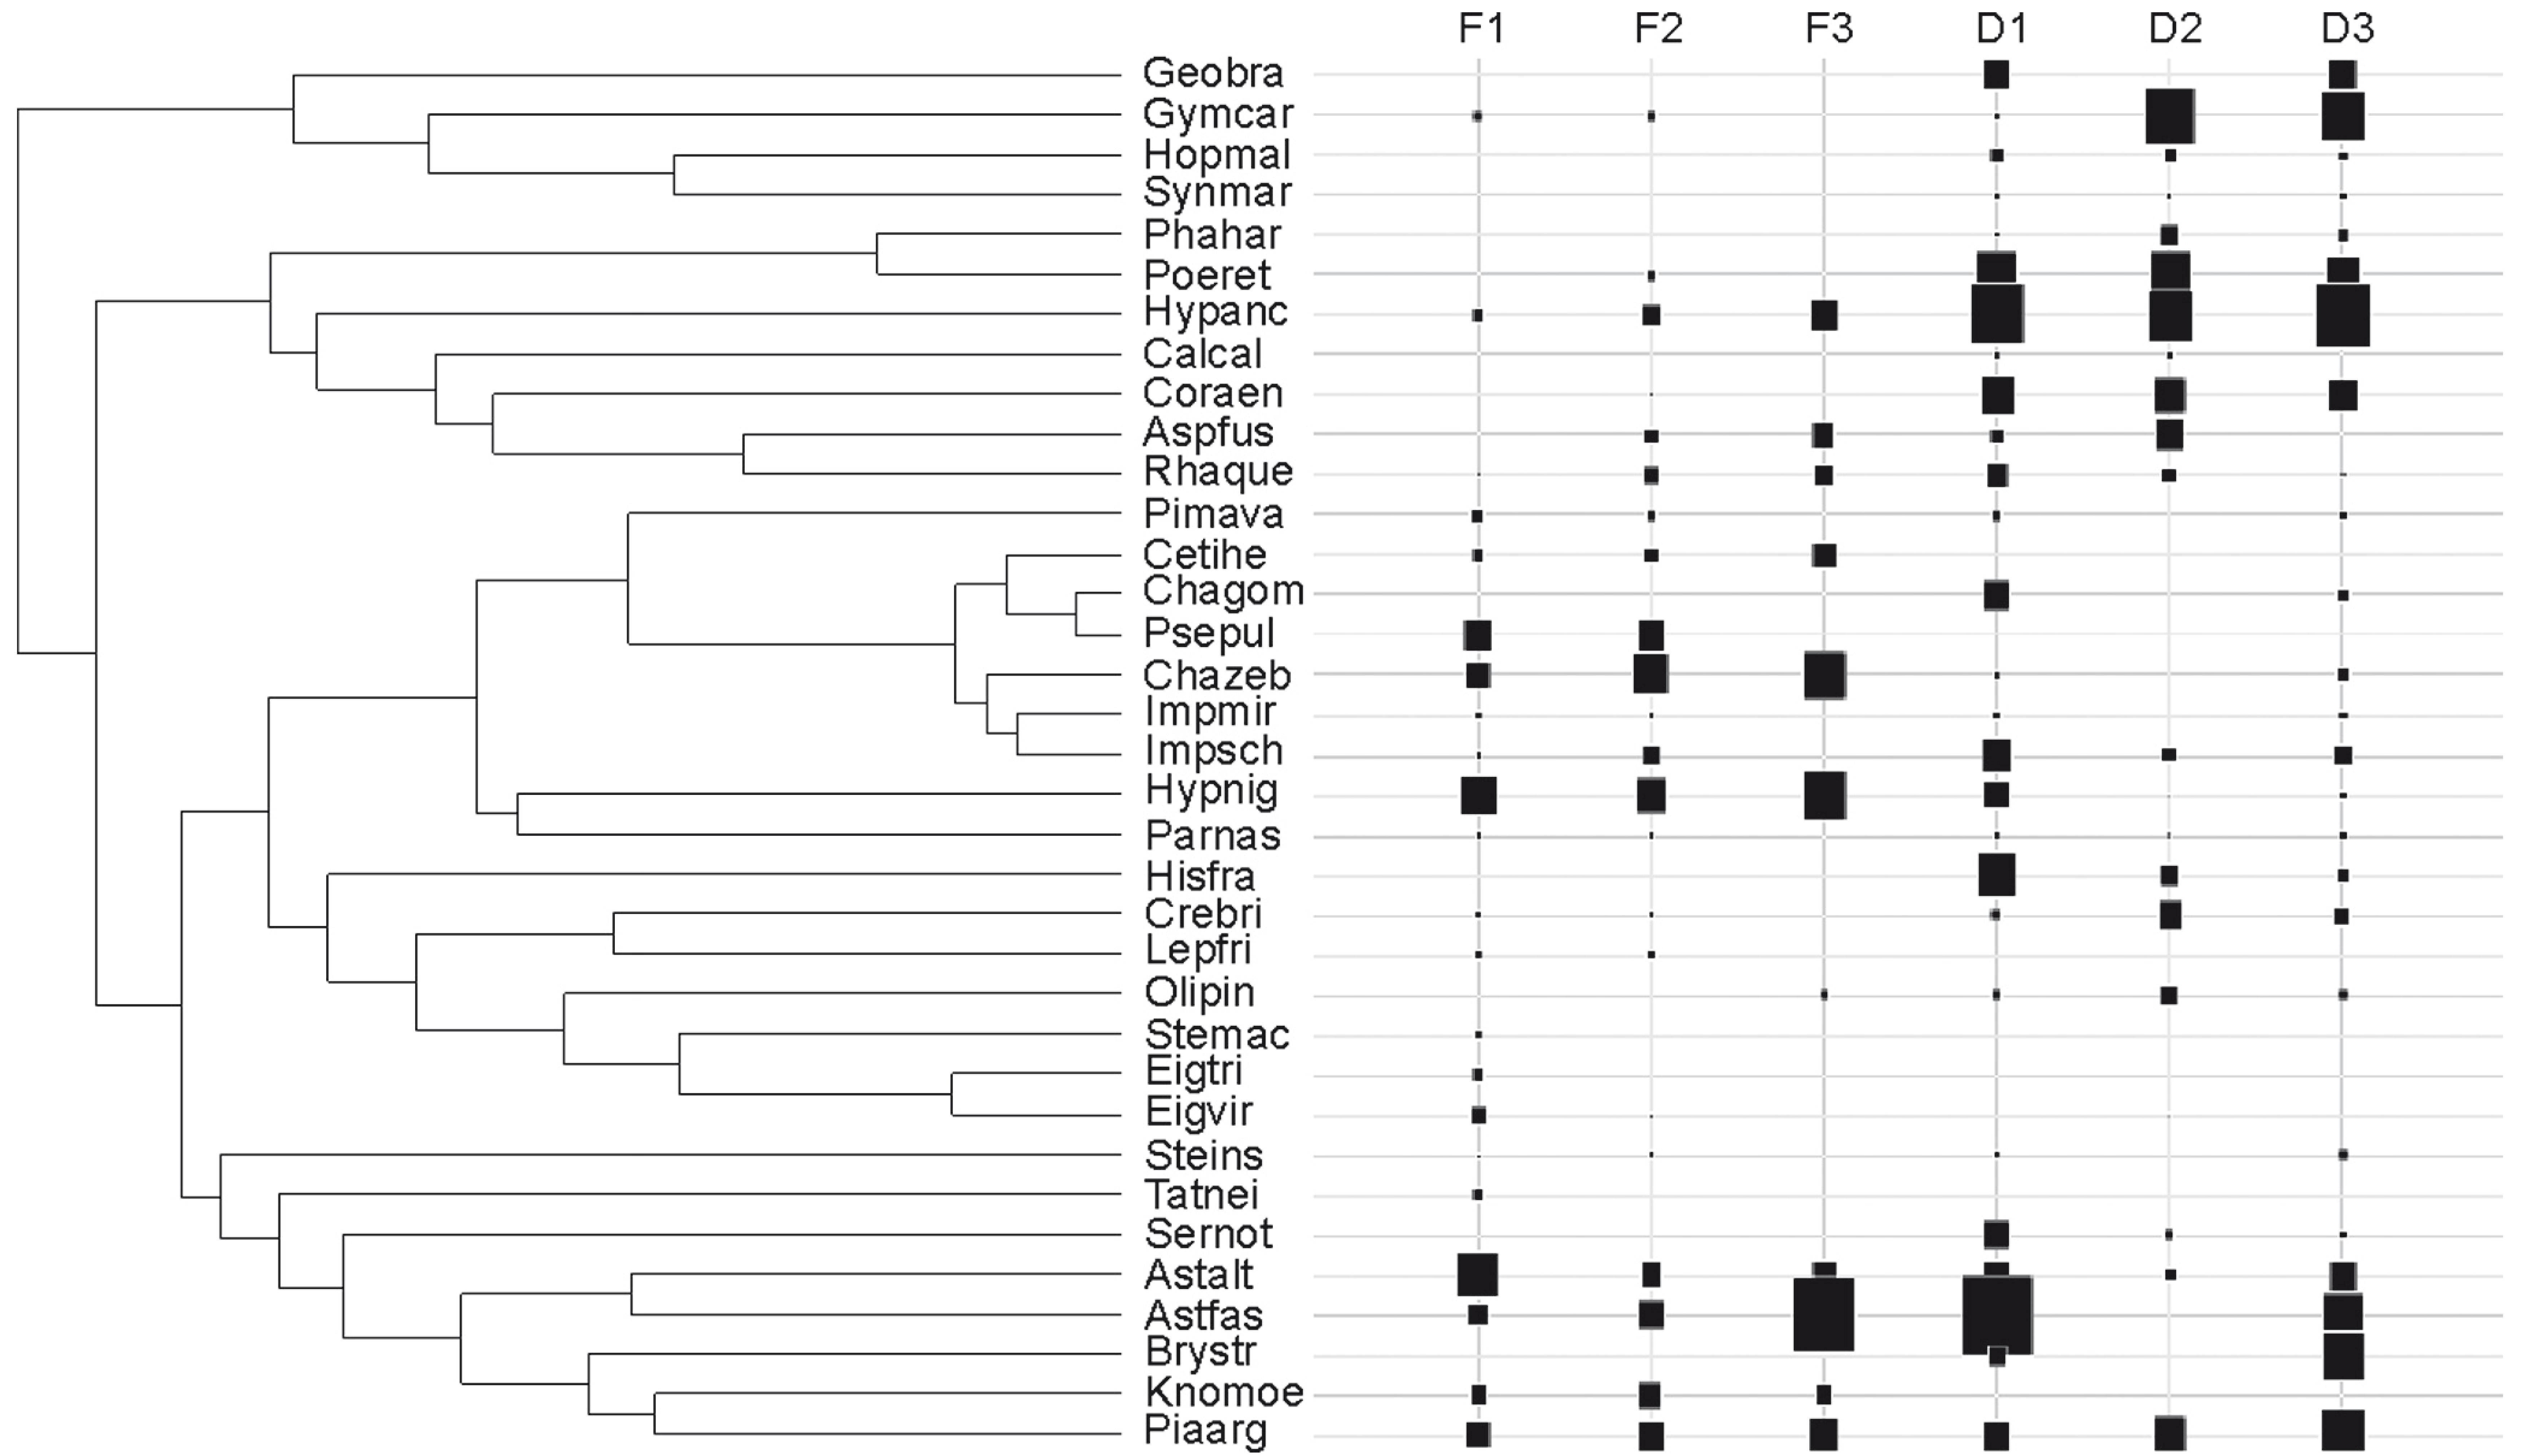
We sampled a total of 3,730 specimens from 43 species in the six streams (eight species were not included in the analyses because of their low occurrence), resulting in a final matrix of 35 species that represented 99.5% of the total number of specimens captured (Table 2). We grouped these species according to their functional similarities in a dendrogram composed of 34 partitions (Fig. 2). Differentiation of forested and deforested streams (β/γ), was greater than expected by chance for the dendrogram partitions #30 and #33 (P < 0.05). These partitions separated species into three and six functional groups, respectively (Fig. 3). The first DPCoA axis summarized most of the variation regarding differences in the functional composition of the community (72.6%), and highlighted the most important functional groups in forested and deforested stream differentiation (Fig. 4). Of three groups derived from partition #33, group 1 and 2 species were more associated with deforested streams than with forested streams, whereas Group 3 species were more abundant in forested streams (Fig. 4). Species belonging to Groups 1 and 2 are known to be hypoxia-tolerant, although hypoxic conditions were not observed in the forested or deforested streams during this study. Additionally, species in Group 1 were large-sized, had a carnivorous/insectivorous diet, and occurred in stream margin habitats. Species belonging to Group 2 comprised small-sized, surface-dwelling, detritivorous species (Poecilia reticulata and Phalloceros harpagos), and benthic, insectivorous species, occurring in intermediate water velocity (remaining species) (Fig. 3).
Mean abundance of species across sections in the forested (F1 to F3) and deforested (D1 to D3) streams in the rio São José dos Dourados basin, Upper Paraná and their respective functional group memberships for the partition #30 and #33, respectively. * species that occurred in less than 3% of the sections. NA species not assigned to a group. # invasive species.
Dendrogram of the functional similarities of the 35 fish species included in the analyses. Mean species abundances within the forested (F1-F3) and deforested (D1-D3) streams are represented by the sizes of the black squares. Species names are abbreviated according to Table 2.
Identification of the functional groups defined by partitions #30 and #33, with their respective trends of change in species abundance as a function of deforestation. The dominant traits of the functional groups that were important for stream differentiation according to the DPCoA (Fig. 4) are also shown. Species names are abbreviated according to Table 2.
Double Principal Coordinate Analysis (DPCoA) biplot ordination, describing the functional differences between forested (F1-F3) and deforested (D1-D3) streams. Black circles indicate each species, and their relative positions reflect their functional dissimilarities. Species are linked according to the functional groups originating from partitions #33 (a) and #30 (b). Species identities and their functional traits are shown in Fig. 3.
With respect to partition #30, Groups 1 and 2 were the same as those that originated from partition #33. Group 3 was concentrated in forested streams and consisted of species with specialized benthic habitats, affinity to high water velocity, insectivorous diet (Fig. 3), and a known tolerance of hypoxia. Group 4 comprised species that inhabited marginal habitats and had an insectivorous diet. Group 5 consisted of one species (Steindachnerina insculpta). Group 4 and Group 5 had low abundance and, consequently, exhibited little contribution to the functional differentiation among the streams (Figs. 2, 4). Group 6 species, which belonged to the nektonic habitat, had a generalist/insectivorous diet, preferred low water velocity, and were less important in the functional differentiation among streams because they were evenly distributed among samples (Figs. 2, 4).
Discussion
Streams deforested of their riparian zones in the study area differed from forested streams regarding the composition and representation of functional ichthyofaunal groups. We were able to successfully demonstrate this pattern using an adaptation of the analytical strategy developed by Pavoine et al. (2009a). Higher functional β diversity values than those expected by chance were observed, indicating that the differences between forested and deforested streams were not random. The highest β diversity values corresponded to the early branching partitions (#30 and #33) of the functional dendrogram, and resulted from the different contributions of functional Groups 1, 2, and 3. The functional differentiation most likely reflected differences in local environmental conditions consistent with the effects of deforestation reported in the literature (Pusey & Arthington, 2003; Lorion & Kennedy, 2009; Casatti et al., 2012). The higher abundance of Group 3 species, which are associated with higher flow, in forested streams (all found downstream of the deforested sites) reinforces our assumption that stream gradient is similar between forested and deforested streams; otherwise one would predict a consistent tendency for the upstream sites to support species associated with higher flow rates.
Bojsen & Barriga (2002)Bojsen, B. H. & R. Barriga. 2002. Effects of deforestation on fish community structure in Ecuadorian Amazon streams. Freshwater Biology, 47: 2246-2260. and Lorion & Kennedy (2009) showed an increase in the abundance and biomass of herbivorous and detritivorous fish in deforested streams as a consequence of reduced shading and increased primary production. Conversely, Casatti et al. (2006, 2009) and Teresa & Casatti (2012) attributed a reduced abundance of rheophilic species to habitat simplification, which corresponds here to the lower abundance of Group 3 species (partition #30). These studies and our data suggest that the turnover of species after deforestation are functionally predictable and consistent with the notion that environmental degradation leads to a wider distribution of opportunistic species, which replace the sensitive and specialist ones (Devictor et al., 2008Devictor, V., R. Julliard & F. Jiguet. 2008. Distribution of specialist and generalist species along spatial gradients of habitat disturbance and fragmentation. Oikos, 117: 507-514.).
Both the forested and deforested sites exhibited normoxic conditions during this study. However, dissolved oxygen may exhibit occasionally depletions that were undetected by our sampling protocol. Reduction of dissolved oxygen is known to occur intermittently on the margins of degraded streams, where abundant grass growth (Casatti et al., 2009; Rocha et al., 2009) contributes to water flow reduction and the interception of detritus - in turn leading to increased organic decomposition (Bunn et al., 1999). Hypoxia-tolerant species (Groups 1 and 2) may therefore in part be associated with deforested habitats because of intermittent oxygen reduction.
Three functional groups did not influence the differentiation of streams because they contained rare species (Groups 4 and 5) or species that are apparently not sensitive to environmental differences between forested and deforested streams (Group 6). Individuals from Group 6 have nektonic habitats and insectivorous/omnivorous diet, prefer mesohabitats with low water velocity and are mostly composed of small-sized characins. Species from this group are often dominant in Neotropical streams (Castro, 1999) and were well represented in our streams, except in one of the deforested streams (D2), possibly due to higher water flow and the reduced availability of macrophyte-free space in the water column. Group 6 species are known for their trophic plasticity and opportunism and are capable of successfully using available resources, even in degraded environments (Melo et al., 2004Melo, C. E., F. A. Machado & V. Pinto-Silva. 2004. Feeding habits of fish from a stream in the savanna of Central Brazil, Araguaia Basin. Neotropical Ichthyology, 2: 37-44.; Ceneviva-Bastos et al., 2010) - which may explain their low sensitivity to deforestation.
Criticisms of the use of functional groups in studies of community composition typically target the arbitrary definitions of the similarity thresholds used to determine which species are included in the functional groups (Petchey & Gaston, 2006Petchey, O. L. & K. J. Gaston. 2006. Functional diversity: back to basics and looking forward. Ecology Letters, 9: 741-758.). However, the analytical approach employed in the present study does not assume a priori threshold for group definition. Instead, it allowed the search for functional groups which maximized samples differentiation. From this perspective, the results obtained herein support the idea that species classification into functional groups represents a viable way for evaluating the functional response of communities along environmental gradients (sensuWelcomme et al., 2006Welcomme, R. L., K. O. Winemiller & I. G. Cowx. 2006. Fish environmental guilds as a tool for assessment of ecological condition of rivers. River Research and Applications, 22: 377-396.). By focusing on functional groups, we are taking into account the combination of traits that are important for species occurrence. This is a more realistic approach, as habitats filter species based on a combination of their traits rather than specific traits alone (Verberk et al., 2013Verberk, W. C. E. P., C. G. E. van Noordwijk & A. G. Hildrew. 2013. Delivering on a promise: integrating species traits to transform descriptive community ecology into a predictive science. Freshwater Science, 32: 531-547.).
Acknowledgements
We are grateful to Gabriel L. Brejão for the elaboration of figure 1; to Maurício Cetra, Katharina E. Esteves, Denise C. Rossa Feres, Diogo B. Provete, Thiago G. Souza, William G. R. Crampton, and three anonymous referees for comments and suggestions on the manuscript. This project is part of the project "Fauna e Flora de Remanescentes Florestais do Noroeste Paulista", funded by FAPESP (process #2008/03583-9). FBT is supported by PROBIP/UEG, CAPES and FAPEG (Auxpe 2036/2013) and received a doctoral fellowship from FAPESP (2008/03583-9). LC and MVC received a research productivity scholarship from CNPq (303647/2007-8 and 306843/2012-9, respectively).
References
- Araújo, R. B. & V. Garutti. 2003. Ecology of a stream from upper Paraná River basin inhabited by Aspidoras fuscoguttatus Nijssen and Isbrücker, 1976 (Siluriformes, Callichthyidae). Brazilian Journal of Biology, 63: 363-372.
- Bojsen, B. H. & R. Barriga. 2002. Effects of deforestation on fish community structure in Ecuadorian Amazon streams. Freshwater Biology, 47: 2246-2260.
- Botta-Dukát, Z. 2005. Rao's quadratic entropy as a measure of functional diversity based on multiple traits. Journal of Vegetation Science, 16: 533-540.
- Bozzetti, M. & U. H. Schulz. 2004. An index of biotic integrity based on fish assemblages for subtropical streams in southern Brazil. Hydrobiologia, 529: 133-144.
- Bunn, S. E., P. M. Davies & T. D. Mosisch. 1999. Ecosystem measures of river health and their response to riparian and catchment degradation. Freshwater Biology, 41: 333-345.
- Casatti, L. & R. M. C. Castro. 1998. A fish community of the São Francisco River headwaters riffles, southeastern Brazil. Ichthyological Exploration of Freshwaters, 9: 229-242.
- Casatti, L., C. P. Ferreira & F. R. Carvalho. 2009. Grass-dominated stream sites exhibit low fish species diversity and dominance by guppies: an assessment of two tropical pasture river basins. Hydrobiologia, 632: 273-283.
- Casatti, L., F. Langeani & R. M. C. Castro. 2001. Peixes de riacho do Parque Estadual Morro do Diabo, bacia do alto rio Paraná, SP. Biota Neotropica, 1: 1-15.
- Casatti, L., F. Langeani, A. M. Silva & R. M. C. Castro. 2006. Stream fish, water and habitat quality in a pasture dominated basin, southeastern Brazil. Brazilian Journal of Biology, 66(2B): 681-696.
- Casatti, L., F. B. Teresa, T. Gonçalves-Souza, E. Bessa, A. R. Manzotti, C. S. Gonçalves & J. O. Zeni. 2012. From forests to cattail: how does the riparian zone influence stream fish? Neotropical Ichthyology, 10: 205-214.
- Castro, R. M. C. 1999. Evolução da ictiofauna de riachos sul-americanos: padrões gerais e possíveis processos causais. Pp. 139-155. In: Caramaschi, E. P., R. Mazzoni & P. R. Peres-Neto (Eds.). Ecologia de peixes de riachos: estado atual e perspectivas. Rio de Janeiro, Programa se Pós-graduação em Ecologia, Instituto de Biologia, Universidade Federal do Rio de Janeiro. (Oecologia Brasiliensis, 6).
- Ceneviva-Bastos, M., L. Casatti & D. C. Rossa-Feres. 2010. Meso and microhabitat analysis and feeding habits of small nektonic characins (Teleostei: Characiformes) in Neotropical streams. Zoologia: an international journal for Zoology, 27: 191-200.
- Cruz, B. B., L. E. Miranda & M. Cetra. 2013. Links between riparian landcover, instream environment and fish assemblages in headwater streams of south-eastern Brazil. Ecology of Freshwater Fish, 22: 607-616.
- Devictor, V., R. Julliard & F. Jiguet. 2008. Distribution of specialist and generalist species along spatial gradients of habitat disturbance and fragmentation. Oikos, 117: 507-514.
- Dray, S. & A. B. Dufour. 2007. The ade4 package: implementing the duality diagram for ecologists. Journal of Statistical Software, 22: 1-20.
- Fausch, K. D. & T. G. Northcote. 1992. Large woody debris and salmonid habitat in a small coastal British Columbia stream. Canadian Journal of Fisheries and Aquatic Sciences, 49: 682-693.
- Freeman, M. C., Z. H. Bowen & J. H. Crance. 1997. Transferability of habitat suitability criteria for fishes in warmwater streams. North American Journal of Fisheries Management, 17: 20-31.
- Hardy, O. J. 2008. Testing the spatial phylogenetic structure of local communities: statistical performances of different null models and test statistics on a locally neutral community. Journal of Ecology, 96: 914-926.
- IPT (Instituto de Pesquisas Tecnológicas do Estado de São Paulo), 2000. Diagnóstico da situação atual dos recursos hídricos e estabelecimento de diretrizes técnicas para a elaboração do plano da Bacia Hidrográfica do São José dos Dourados. Relatório nº 40675. Fundo Estadual de Recursos Hídricos, São Paulo.
- Kawakami, E. & G. Vazzoler. 1980. Método gráfico e estimativa de índice alimentar aplicado no estudo de alimentação de peixes. Boletim do Instituto Oceanográfico, 29: 205-207.
- Kramer, D. L. & J. P. Mehegan. 1981. Aquatic surface respiration, an adaptive response to hypoxia in the guppy, Poecilia reticulata (Pisces, Poeciliidae). Environmental Biology of Fishes, 6: 299-313.
- Lande, R. 1996. Statistics and partitioning of species diversity, and similarity among multiple communities. Oikos, 76: 5-13.
- Lorion, C. M. & B. P. Kennedy. 2009. Riparian forest buffers mitigate the effects of deforestation on fish assemblages in tropical headwater streams. Ecological Applications, 19: 468-479.
- Lowe-McConnell, R. H. 1987. Ecological studies in tropical fish communities. Cambridge, Cambridge University Press. 382p. (Cambridge tropical biology series).
- Melo, C. E., F. A. Machado & V. Pinto-Silva. 2004. Feeding habits of fish from a stream in the savanna of Central Brazil, Araguaia Basin. Neotropical Ichthyology, 2: 37-44.
- Monbeig, P. 1998. Pioneiros e fazendeiros de São Paulo. 2.ed. São Paulo, Hucitec. 392p. (Geografia: teoria e realidade, v. 11).
- Murphy, M. L. & J. D. Hall. 1981. Vaired effects of clear-cut logging on predators and their habitat in small streams of the Cascade Mountains, Oregon. Canadian Journal of Fisheries and Aquatic Sciences, 38: 137-145.
- Nalon, M. A., I. S. A. Matto & G. A. D. C. Franco. 2008. Meio físico e aspectos da vegetação. Pp. 12-21. In: Rodrigues, R. R. & V. L. R. Bononi (Orgs.). Diretrizes para conservação e restauração da biodiversidade no estado de São Paulo. São Paulo, Secretaria do Meio Ambiente, Instituto de Botânica, Fapesp, Programa Biota/Fapesp.
- Pavoine, S., A. B. Dufour & D. Chessel. 2004. From dissimilarities among species to dissimilarities among communities: a double principal coordinate analysis. Journal of Theoretical Biology, 228: 523-537.
- Pavoine, S., M. S. Love & M. B. Bonsall. 2009a. Hierarchical partitioning of evolutionary and ecological patterns in the organization of phylogenetically-structured species assemblages: application to rockfish (genus: Sebastes) in the Southern California Bight. Ecology Letters, 12: 898-908.
- Pavoine, S., S. Ollier & D. Pontier. 2005. Measuring diversity from dissimilarities with Rao's quadratic entropy: are any dissimilarities suitable? Theoretical Population Biology, 67: 231-239.
- Pavoine, S., J. Vallet, A. B. Dufour, S. Gachet & H. Daniel. 2009b. On the challenge of treating various types of variables: application for improving the measurement of functional diversity. Oikos, 118: 391-402.
- Petchey, O. L. & K. J. Gaston. 2006. Functional diversity: back to basics and looking forward. Ecology Letters, 9: 741-758.
- Poff, N. L. R. 1997. Landscape filters and species traits: towards mechanistic understanding and prediction in stream ecology. Journal of the North American Benthological Society, 16: 391-409.
- Pusey, B. J. & A. H. Arthington. 2003. Importance of the riparian zone to the conservation and management of freshwater fish: a review. Marine and Freshwater Research, 54: 1-16.
- R Development Core Team. 2009. R: A language and environment for statistical computing. R Foundation for Statistical Computing, Vienna, Austria. Available from: http://www.R-project.org/ (01/05/2013).
» http://www.R-project.org/ - Rocha, F. C., L. Casatti, F. R. Carvalho & A. M. Silva. 2009. Fish assemblages in stream stretches occupied by cattail (Typhaceae, Angiospermae) stands in Southeast Brazil. Neotropical Ichthyology, 7: 241-250.
- Schneider, K. N. & K. O. Winemiller. 2008. Structural complexity of woody debris patches influences fish and macroinvertebrate species richness in a temperate floodplain-river system. Hydrobiologia, 610: 235-244.
- Silva, A. M., L. Casatti, C. A. Álvares, A. M. Leite, L. A. Martinelli & S. F. Durrant. 2007. Soil loss risk and habitat quality in streams of a meso-scale river basin. Scientia Agricola, 64: 336-343.
- Smale, M. A. & C. F. Rabeni. 1995. Hypoxia and hyperthermia tolerances of headwater stream fishes. Transactions of the American Fisheries Society, 124: 698-710.
- Sneath, P. H. A. & R. R. Sokal. 1973. Numerical taxonomy: the principles and practice of numerical classification. San Francisco, W. H. freeman.
- Teresa, F. B. & L. Casatti. 2012. Influence of forest cover and mesohabitats types on functional and taxonomic diversity of fish communities in Neotropical lowland streams. Ecology of Freshwater Fish, 21: 433-442.
- Teresa, F. B & L. Casatti. 2013. Development of habitat suitability criteria for Neotropical stream fishes and an assessment of their transferability to streams with different conservation status. Neotropical Ichthyology, 11: 395-402.
- Verberk, W. C. E. P., C. G. E. van Noordwijk & A. G. Hildrew. 2013. Delivering on a promise: integrating species traits to transform descriptive community ecology into a predictive science. Freshwater Science, 32: 531-547.
- Welcomme, R. L., K. O. Winemiller & I. G. Cowx. 2006. Fish environmental guilds as a tool for assessment of ecological condition of rivers. River Research and Applications, 22: 377-396.
Appendix 1.
Functional traits of species present in more than 3% of the sampled segments. Diet: Fis = fish, Alg = algae, Per = periphyton, Cya = cyanobacteria, Veg: vegetal fragments, Det = detritus, AuInv = autochthonous invertebrates; AlInv = allochthonous invertebrates; Current preference: F1 = 0 to 0.25 cm/s; F2 = 0.26 to 0.45 cm/s; F3 = 0.46 to 0.65 cm/s; F4 > 0.66 cm/s; Habitat use: Ben = benthic, Nec = nektonic, Necb = nekctobenthic, Mar = marginal, Sur = surface; Siz = size (mm); Tolerance to hypoxia based on reports in the literature*: tol = tolerant, int = intolerant. Species codes as in Table 2. *Kramer & Mehegan (1981), Araujo & Garutti (2003), Bozzetti & Schulz (2004), Casatti et al. (2006), Rocha et al. (2009) and Casatti et al. (2012).
Publication Dates
-
Publication in this collection
02 June 2015 -
Date of issue
Apr-Jun 2015
History
-
Received
17 Dec 2013 -
Accepted
26 Feb 2015