ABSTRACT
Coastal and marine environments are characterized by a lack of evident physical barriers or geographic isolation, and it may be difficult to understand how divergence can arise and be sustained in marine environments. The identification of 'soft' barriers is a crucial step towards the understanding of gene flow in marine environments. The marine catfishes of the family Ariidae are a demersal group with restricted migratory behavior, no pelagic larval stages, and mechanisms of larval retention, representing a potentially useful model for the understanding of historical processes of allopatric speciation in the marine environment. In the present study, two lineages of the Coco sea catfish, Bagre bagre , were recognized from their complete segregation at both mitochondrial and morphological levels. One lineage is distributed between Venezuela and the northern coast of Brazil, including the semiarid northeast coast, while the second lineage is found on the eastern coast of Brazil, including the humid northeast coast. Based on distribution area, habitats preference, and genetic variability, inferences are made in relation to biogeography and demography of lineages in Atlantic coast of South America.
Keywords:
Genetics; Morphological; Pleistocene; Sea level variations; Species evolution
RESUMO
Ambientes marinhos costeiros são caracterizados pela falta de barreiras físicas evidentes e ausência de isolamento geográfico, sendo difícil compreender como diferentes linhagens podem surgir e ser mantidas nestes ambientes. A identificação de barreiras permeáveis é um passo importante para a compreensão do fluxo gênico em ambientes marinhos. Os bagres marinhos da família Ariidae são um grupo demersal, com mecanismos de retenção larval e sem comportamento migratório ou estágio larval pelágico, representando um grupo potencialmente útil para a compreensão de processos históricos de especiação alopátrica no ambiente marinho. No presente estudo, duas linhagens do bandeirado ou bagre de fita, Bagre bagre , são reconhecidas com base na completa segregação mitocondrial e morfológica. Uma linhagem é encontrada da Venezuela à costa norte do Brasil, incluindo a costa nordeste semi-árida, enquanto a segunda linhagem é encontrada na costa leste e sudeste do Brasil, incluindo a costa nordeste úmida. Com base na área de distribuição, habitat preferencial e a variabilidade genética, inferências são feitas em relação à biogeografia e demografia das duas linhagens na costa do Atlântico da América do Sul.
Introduction
Understanding the processes that determine the differentiation of closely related species, not delimited by obvious physical barriers, represents one of the greatest challenges in evolutionary biology (Pampoulie et al., 2004Pampoulie, C., E. S. Gysels, G. E. Maes, B. Hellemans, V. Leentjes, A. G. Jones & F. A. M. Volckaert. 2004. Evidence for fine-scale genetic structure and estuarine colonisation in a potential high gene flow marine goby (Pomatoschistus minutus ). Heredity, 92: 434-445.). Coastal and marine environments are characterized by a lack of evident physical barriers or geographic isolation (Bellwood & Wainwright, 2002Bellwood, D. R. & P. C. Wainwright. 2002. The history and biogeography of fishes on coral reefs. Pp. 5-32. In: Sale, P. F. (Ed.). Coral Reef Fishes: dynamics and diversity on a complex ecosystem. San Dyego, CA, Academic Press.; Rocha et al., 2002Rocha, L. A., A. L. Bass, D. R. Robertson & B. W. Bowen. 2002. Adult habitat preferences, larval dispersal, and the comparative phylogeography of three Atlantic surgeonfishes (Teleostei: Acanthuridae). Molecular Ecology, 11: 243-252.; Luiz et al., 2012Luiz, O. J., J. S. Madin, D. R. Robertson, L. A. Rocha, P. Wirtz & S. R. Floeter. 2012. Ecological traits influencing range expansion across large oceanic dispersal barriers: insights from tropical Atlantic reef fishes. Proceedings of the Royal Society Biological Sciences, 279: 1033-1040.), making it difficult to understand how closely related species can arise and be sustained in marine environments (Hauser & Carvalho, 2008Hauser, L. & G. R. Carvalho. 2008. Paradigm shifts in marine fisheries genetics: ugly hypotheses slain by beautiful facts. Fish and Fisheries, 9: 333-362. ). The identification of 'soft' barriers, such as the configuration of ocean currents, temperature gradients, and geomorphological features of the coastline, together with the biological characteristics of each species, is a crucial step towards the understanding the processes responsible for the differentiation and maintenance of close species in marine environment.
Demersal species with restricted migratory behavior, no pelagic larval stages and mechanisms of larval retention can represent an excellent model for the understanding of the process of allopatric speciation in the marine environment (Stepien et al., 2001Stepien, C. A., R. H. Rosenblatt & B. A. Bargmeyer. 2001. Phylogeography of the spotted sand bass, Paralabrax maculatofasciatus: divergence of Gulf of California and Pacific coast populations. Evolution, 55: 1852-1862. ; Betancur -R et al ., 2010Betancur-R., R, A. Acero P., H. Duque-Caro & S. R. Santos. 2010. Phylogenetic and morphologic analyses of a coastal fish reveals a marine biogeographic break of terrestrial origin in the Southern Caribbean. PLoS ONE, 5: e11566(10p.).). The sea catfishes of the family Ariidae inhabit shallow coastal waters, migrating to estuaries and/or coastal floodplains to spawn (Rimmer, 1985Rimmer, M. 1985. Reproductive cycle of the fork-tailed catfish Arius graeffei Kner & Steindachner (Pisces: Ariidae) from the Clarence River, New South Wales. Australian Journal of Marine and Freshwater Research, 36: 23-32.; Araújo, 1988Araújo, F. G. 1988. Distribuição, abundância relativa e movimentos sazonais de bagres marinhos (Siluriformes, Ariidae) no estuário da Lagoa dos Patos (RS), Brasil. Revista Brasileira de Zoologia,5: 509-543.), when the males retain the fertilized eggs in the oral cavity for up to three months, when they do not feed, after which the young remain in estuarine habitats until they mature (Rimmer, 1985Rimmer, M. 1985. Reproductive cycle of the fork-tailed catfish Arius graeffei Kner & Steindachner (Pisces: Ariidae) from the Clarence River, New South Wales. Australian Journal of Marine and Freshwater Research, 36: 23-32.; Araújo, 1988Araújo, F. G. 1988. Distribuição, abundância relativa e movimentos sazonais de bagres marinhos (Siluriformes, Ariidae) no estuário da Lagoa dos Patos (RS), Brasil. Revista Brasileira de Zoologia,5: 509-543.).
The Coco sea catfish, Bagre bagre (Linnaeus, 1766) is widely acknowledged as a valid species found on the Atlantic coast of South America, from Colombia to southeastern Brazil (Marceniuk & Menezes, 2007Marceniuk, A. P. & N. A. Menezes. 2007. Systematics of the family Ariidae (Ostariophysi, Siluriformes), with a redefinition of the genera. Zootaxa, 1416: 1-126.; Marceniuk et al ., 2015Marceniuk, A. P., R. Betancur, T. Giarrizzo, F. L. Fredou & S. Knudsen. 2015. Bagre bagre . The IUCN Red List of Threatened Species, 2015, e.T190228A1945010. Available from: Available from: http://dx.doi.org/10.2305/IUCN.UK.2015-2.RLTS.T190228A19450.en
. (15 May 2016).
http://dx.doi.org/10.2305/IUCN.UK.2015-2...
). The Coco sea catfish is known to practice oral incubation and lack pelagic larval stages (Le Bail et al., 2000Le Bail, P. -Y., P. Keith & P. Planquette. 2000.Atlas des poissons d'eau douce de Guyane. Paris, Muséum National d´Histoire Naturelle, Concil Supérieur de la Pêche, INRA-Institut National de la Recherche Agronomique. t. 2, fascícule 2: Siluriformes. (Collection du patrimoine naturel, 43).), but is rare from coastal lagoons and estuaries (Pinheiro et al., 2006Pinheiro, P., M. K. Broadhurst, F. H. V. Hazin, T. Bezerra & S. Hamilton. 2006. Reproduction in Bagre marinus (Ariidae) off Pernambuco, northeastern Brazil. Journal of Applied Ichthyology, 22: 189-192.; Dantas et al., 2010Dantas, D. V., M. Barletta, M. F. Costa, S. C. T. Barbosa-Cintra, F. E. Possatto, J. A. A. Ramos, A. R. A. Lima & U. Saint-Paul. 2010. Movement patterns of catfishes (Ariidae) in a tropical semi-arid estuary. Journal of Fish Biology, 76: 2540-2557.; Mendes & Barthem, 2010Mendes, F. L. S. & R. B. Barthem. 2010. Hábitos alimentares de bagres marinhos (Siluriformes: Ariidae) do estuário amazônico.Amazônia: Ciência & Desenvolvimento, Belém, 5: 153-166.; Le Bail et al ., 2012Le Bail, P. -Y., R. Covain, M. Jégu, S. Fisch-Muller, R. Vigouroux & P. Keith. 2012.Updated checklist of the freshwater and estuarine fishes of French Guiana.Cybium, 36: 293-319.; Barbanti et al., 2013Barbanti, B., R. Caires & A. P. Marceniuk. 2013. A ictiofauna do Canal de Bertioga, São Paulo, Brasil. Biota Neotropica, 13: 276-291.). In contrast with other ariids, which are typically endemic to relatively restricted geographical areas (Betancur-R. & Armbruster, 2009Betancur-R., R. & J. W. Armbruster. 2009. Molecular clocks provide new insights into the evolutionary history of Galeichthyine sea catfishes. Evolution, 63: 1232-1243.), species of the genus Bagre are very amply distributed (Marceniuk & Menezes, 2007Marceniuk, A. P. & N. A. Menezes. 2007. Systematics of the family Ariidae (Ostariophysi, Siluriformes), with a redefinition of the genera. Zootaxa, 1416: 1-126.), considered to be a characteristic of invasive species (Lodge, 1993Lodge, D. M. 1993. Biological invasions: lessons for ecology. Trends in Ecology & Evolution, 8: 133-137. ). In some parts of Brazil, such as the state of Pará, this species is targeted intensively by industrial fisheries, while in other regions, there are only limited artisanal catches (Marceniuk et al ., 2015Marceniuk, A. P., R. Betancur, T. Giarrizzo, F. L. Fredou & S. Knudsen. 2015. Bagre bagre . The IUCN Red List of Threatened Species, 2015, e.T190228A1945010. Available from: Available from: http://dx.doi.org/10.2305/IUCN.UK.2015-2.RLTS.T190228A19450.en
. (15 May 2016).
http://dx.doi.org/10.2305/IUCN.UK.2015-2...
).
In the present study, two early Pleistocene lineages of the Coco sea catfish are recognized based on molecular and morphological evidence. Considering the area of distribution, genetic variability, and habitat preferences, inferences are made in relation to biogeography, demography, and conservation of these two lineages from the Atlantic coast of South America.
Material and Methods
Study area and distribution data. Considering the role of climatological and oceanographic factors in the determination of patterns of biodiversity (Amaral & Jablonski, 2005Amaral, A. C. Z. & S. Jablonski. 2005. Conservação da biodiversidade marinha e costeira no Brasil. Megadiversidade, 1: 43-51.), five distinct regions were recognized along the Brazilian coast for the purposes of analysis in the present study: (i) the northern coast, between the mouth of the Oiapoque River (4° N) in the state of Amapá and the mouth of the Parnaíba River (3° S) in Maranhão, (ii) the northeastern coast, between the Parnaíba and Todos os Santos Bay (13° S) in Bahia, (iii) the eastern coast, between Todos os Santos Bay and the Cape of São Tomé (22° S) in the state of Rio de Janeiro, (iv) the southeastern coast, between São Tomé and the Cape of Santa Marta (28° S) in Santa Catarina, and (v) the southern coast, between Santa Marta and the Chuí (34° S) in Rio Grande do Sul (sensuEkau & Knoppers,1999Ekau, W. & B. A. Knoppers. 1999. An introduction to the pelagic system of the North-East and East Brazilian shelf. Archive of Fishery and Marine Research, 47: 113-132., Fig. 1). The region between the mouth of the Orinoco River (8° N) in Venezuela, and French Guiana (4° N), dominated by the plume of the Amazon and Orinoco rivers, is considered to be contiguous with the northern coast of Brazil. The coast of northeastern Brazil can be divided into two distinct sectors, with semi-arid conditions on the north-facing sector, between Ceará (3° S) to Rio Grande do Norte (6° S) States, where mean annual precipitation is less than 800 mm, and local conditions are influenced by the Northern Brazilian Current, and more humid conditions on the east-facing sector, between Paraíba (6° S) and Bahia (13° S) States, which is influenced by the Brazilian current, and has a humid tropical climate, with annual precipitation of over 1,000 mm (Maia et al., 2006Maia, L. P., L. D. Lacerda, L. H. U. Monteiro & G. M. Souza. 2006. Atlas dos Manguezais do Nordeste do Brasil: avaliação das áreas de manguezais dos estados do Piauí, Ceará, Rio Grande do Norte, Paraíba e Pernambuco. Fortaleza, ISME-BR, Instituto de Ciências do Mar, UFCE, ABCC, 49p.) (Fig. 1).

Geographic distribution of the two Bagre bagre lineages found in South America [red triangle = northern Brazilian coast, including region dominated by the plume of the Amazon and Orinoco rivers and semi-arid sector of Brazilian northeast coast (light blue = mouth of the Orinoco River; black circle = Macapá, AP; dark blue circle = Bragança, PA; yellow = São Luis, MA; green = Fortaleza, CE), and inverted black triangle = eastern and southern Brazilian coast, including the humid sector of the northeast coast (white circle = Santos, SP)] showing the number of specimens analyzed in each region (not bold = morphological analysis, and bold = molecular analysis). Green = northern Brazilian coast influenced by the Amazon- Orinoco plume, Light blue = semi-arid northeastern coast of Brazil; Dark blue = humid northeastern coast of Brazil, Yellow = east coast, and Orange = southeast coast).
Data on the distribution of the Ariidae on the Atlantic coast of South America were obtained from the catalogs of the zoological collections available from the Neodat (http://www.mnrj.ufrj.br/search.htm), SpeciesLink (http://www.splink.org.br/), and FishNet (http://www.fishnet2.net) projects, and the ichthyological collection at the Museu Paraense Emílio Goeldi (MPEG).
DNA sequence data. Molecular analyses were based on Bagre bagre tissue samples obtained from 80 specimens collected in Brazil on the northern coast, the semi-arid northeastern coast, and the southeastern coast (Appendix 1) (Fig. 1). Two databases were established, one used for the population-level analyses, which contained only these specimens, and the other containing the known B. bagre haplotypes as well as two specimens of Bagre marinus (Mitchill, 1815) from the semi-arid northeastern coast of Brazil, in addition to DNA sequences of specimens of the families Ancharidae and Ariidae obtained from GenBank (Appendix 1). Voucher specimens were deposited in the zoological collections of the MPEG and the Laboratório de Biologia e Genética de Peixes (LBP) do Departamento de Morfologia, Instituto de Biociências da UNESP de Botucatu (Appendix 2).
Total genomic DNA was obtained using a phenol/chloroform modified from Sambrook & Russell (2001Sambrook, J. & D. W. Russell. 2001. Molecular cloning: a laboratory manual. 3rd ed. New York, Cold Spring Harbor Laboratory, Press, 3v.). Sequences of the Cytochrome b and ATPase Alpha 8/6 genes were amplified using the Polymerase Chain Reaction (PCR). The sequences of the primers and the conditions of amplification of each gene used in this study were described by Betancur-R et al. (2007Betancur-R., R., A. Acero P., E. Bermingham & R. Cooke. 2007. Systematics and biogeography of New World sea catfishes (Siluriformes: Ariidae) as inferred from mitochondrial, nuclear and morphological evidence. Molecular Phylogenetics and Evolution, 45: 339-357.). The PCR products were purified using an ExoSAP-IT kit (Amersham Pharmacia Biotech) and sequenced using Big Dye 3.1 in an ABI 3500 automatic sequencer, following the maker's instructions (Applied Biosystems, Foster, CA, USA).
Phylogenetic inference. The DNA sequences were aligned using the ClustalW multiple alignment tool (Thompson et al., 1997Thompson, J. D., T. J. Gibson, F. Plewniak, F. Jeanmougin & D. G. Higgins. 1997. The CLUSTAL_X windows interface: flexible strategies for multiple sequence alignment aided by quality analysis tools. Nucleic Acids Research, 25: 4876-4882.) in BioEdit v. 5.0.6 (Hall, 1999Hall, T. A. 1999. BioEdit: a user-friendly biological sequence alignment editor and analysis program for Windows 95/98/NT. Nucleic Acids Symposium Series, 41: 95-98.). Following the automatic alignment, the sequences were inspected visually for the correction of possible incongruities.
Bayesian Inference (BI) and a Maximum Likelihood (ML) analyses were run in Mr. Bayes v. 3.1.2 (Ronquist & Huelsenbeck, 2003Ronquist, F. & J. P. Huelsenbeck. 2003. Mr Bayes 3: Bayesian phylogenetic inference under mixed models. Bioinformatics, 19: 1572-1574.) and PhyML v. 3.0 (Guidon et al., 2010Guidon, S., J. -F. Dufayard, V. Lefort, M. Anisimova, W. Hordijk & O. Gascuel. 2010. New algorithms and methods to estimate maximum-likelihood phylogenies: assessing the performance of PhyML 3.0. Systematic Biology, 59: 307-321.), respectively. As both markers are part of the mitochondrial genome (single linkage) part of the database was concatenated (Cytb+ATPase 8/6-1537 bps) in the BioEdit program. The database was analyzed with a single (non-partitioned) substitution model, and partitioned by gene and codon position (substitution models were selected for each of the three codon positions of each gene). The most adequate substitution models were selected by a second order Akaike Information Criterion using a hierarchical likelihood test, as well as the Bayesian Information Criterion, which was estimated in jModeltest 2 (Darriba et al., 2012Darriba, D., G. L. Taboada, R. Doallo & D. Posada. 2012. jModelTest 2: more models, new heuristics and parallel computing. Nature Methods, 9: 772.). In the ML analysis, reliability of the branches was tested using 1000 nonparametric bootstrap replicates (Felsenstein, 1985Felsenstein, J. 1985. Confidence limits on phylogenies: an approach using the bootstrap. Evolution, 39: 783-791.). For BI, the database was analyzed as a single model of substitution (unpartioned) and partitioned by gene and codon position (separate substitution models were selected separately for each partition of the genes and the concatenated dataset). Analyses in Mr Bayes 3.1.2 were based on MCMC sampling in four simultaneous runs, each consisting of four chains (one cold and three heated) with a total run of 10 million generations. Bayesian probabilities were selected based on a 60% consensus, with random initial trees, which were sampled at every 100 generations. Conservatively, 25% of the first trees sampled in each MCMC run were discarded as burn-in. The log-likelihood scores were then plotted in Tracer v. 1.4 (Rambaut & Drummond, 2009Rambaut, A. & A. J. Drummond. 2009. Tracer v.1.5. Available from: Available from: http://beast.bio.ed.ac.uk/LogCombiner
. (9 July 2015).
http://beast.bio.ed.ac.uk/LogCombiner...
) to confirm the validity of the burn-in period initially used in Mr. Bayes. The post burn-in samples were used to construct a strict consensus tree.
Estimates of divergence times. Divergence times were estimated in BEAST v. 1.7.4 (Drummond & Rambaut, 2009Drummond, A. J. & A. Rambaut. 2007. BEAST: Bayesian evolutionary analysis by sampling trees. BMC Evolutionary Biology, 7: 214.). Initially, the BEAST file was built in BEAUti program (Drummond et al ., 2007Drummond, A. J., S. Y. W. Ho, N. Rawlence & A. Rambaut. 2007. A rough guide to BEAST 1.4. Edinburgh, University of Edinburgh.). The substitution model utilized was HKY (selected for AIC), with base frequencies estimated empirically, using the database partitioned by codon. All parameters were unlinked and mean substitution rate was unfixed. For the tree prior parameters, two simulations were performed. Initially, the tree prior Speciation: Yule Process was used. This simplest branching model assumes that, at any given point in time, every living lineage can speciate at the same rate, λ. Because the speciation rate is constant through time, there is an exponential waiting time between speciation events (Yule, 1924Yule, G. U. 1924. A mathematical theory of evolution, based on the conclusions of Dr. J. C. Willis, F. R. S. Philosophical Transactions of the Royal Society of London, Biology, 213: 21-87.; Aldous, 2001Aldous, D. J. 2001. Stochastic models and decriptive statistics for phylogenetic trees, from yule to today. Statistical Science, 16: 23-34.), being more appropriated for species-level phylogenies (Drummond et al ., 2007Drummond, A. J., S. Y. W. Ho, N. Rawlence & A. Rambaut. 2007. A rough guide to BEAST 1.4. Edinburgh, University of Edinburgh.). This model does not allow for extinctions. We also performed simulations utilizing the tree prior Birth-Death process, which is an extension of the Yule process. The Birth-Death model assumes that at any point in time every lineage an undergo speciation at rate λ or go extinct at rate µ . These two simulations were run using strict clock and the Calibration nodes were constrained using lognormal-distributions priors.
The calibration of the nodes was chosen based on the paper of Betancur-R. & Armbruster (2009Betancur-R., R. & J. W. Armbruster. 2009. Molecular clocks provide new insights into the evolutionary history of Galeichthyine sea catfishes. Evolution, 63: 1232-1243.). These are the only calibration points available for marine catfish in the literature, so we implement these calibration points to estimate our target data (the split between the two lineages of B. bagre found in our study). Those calibration points were: (i) 73 million years for the separation of Gogo arcuatus from the Ariidae (Gogo arcuatus + all ariid specimens), (ii) 23 million years for the oldest fossil of Cathrops , which separates this genus from the other ariids included in the study (Cathorops + Galeichthys /Bagre ), and (iii) 3 million yearsfor the uprise of the Isthmus of Panama, the vicariant event that separated the modern Cathorops species C. mapale and C. fuertii from C. dasycephalus (C. mapale /C. fuertii + C. dasycephalus ). For this calibration point, the date of the closure itself has recently been debated based on new geological and molecular data, arguing for an old closure time (Bacon et al., 2015Bacon, C. D., D. Silvestro, C. Jaramillo, B. T. Smith, P. Chakrabarty & A. Antonelli. 2015. Biological evidence supports an early and complex emergence of the Isthmus of Panama. Proceedings of the National Academy of Sciences, 112: 6110-6115.), rather than the classically accepted 3.1-3.5 Mya (Knowlton et al., 1993Knowlton, N., L. A. Weigt, L. A. Solorzano, D. K. Mills & E. Bermingham. 1993. Divergence in proteins, mitochondrial DNA, and reproductive compatibility across the Isthmus of Panama. Science, New Series, 260: 1629-1632.; Collins, 1996Collins, T. 1996. Molecular comparisons of transisthmian species pairs: rates and patterns of evolution. Pp. 303-333. In: Jackson, J. B. C., A. F. Budd & A. G. Coates (Eds.). Evolution and environment in Tropical America. Chicago, University of Chicago Press.; Lessios, 2008Lessios, H. A. 2008. The great American schism: Divergence of marine organisms after the rise of the Central American Isthmus. Annual Review of Ecology, Evolution, and Systematics, 39: 63-91.). Taking those debates under account, we also using 5 mya as the vicariant event of modern Cathrops species. The MCMC method was used to infer divergence times between the northern and southern populations, run in BEAST 1.7.4 (Drummond & Rambaut, 2007Drummond, A. J. & A. Rambaut. 2007. BEAST: Bayesian evolutionary analysis by sampling trees. BMC Evolutionary Biology, 7: 214.). This was based on two independent MCMC runs of 160 million interactions, with samples being taken every 1,000 generations. The MCMC log files were combined in Tracer to summarize posterior divergences times with 95% highest posterior density limits. For our study, only runs were the ESS values were greater than 200 were reached for all marginal parameters after discarding 10% of the first trees as burn-in.
Diversity indices and demographic history. Indices of haplotype (H ) and nucleotide (π ) diversity (Nei, 1987Nei, M. 1987. Molecular evolutionary genetics. New York, Columbia University Press, 512p.), as well as Tajima's (1989Tajima, F. 1989. Statistical method for testing the neutral mutation hypothesis by DNA Polymorphism. Genetics, 123: 585-595.) neutrality test (D ) and Fu's (1997Fu, Y. -X. 1997. Statistical tests of neutrality of mutations against population growth, hitchhiking and background selection. Genetics, 147: 915-925.) Fs were all estimated in DnaSP, v. 5.1 (Librado & Rozas, 2009Librado, P. & J. Rozas. 2009. DnaSP v5: a software for comprehensive analysis of DNA polymorphism data. Bioinformatics, 25: 1451-1452.). The fixation indices (Φst; Weir and Hill, 2002Weir, B. S. & W. G. Hill. 2002. Estimating F-Statistics. Annual Review of Genetics, 36: 721-750.) and hierarchical analysis of molecular variance (AMOVA; Excoffier et al., 1992Excoffier, L., P. E. Smouse & J. M. Quattro. 1992. Analysis of molecular variance inferred from metric distances among DNA haplotypes: application to human mitochondrial DNA restriction data. Genetics, 131: 479-491.) based on 1000 permutations using the Kimura 2P substitution model (Kimura, 1980Kimura, M. 1980. A simple method for estimating evolutionary rates of base substitutions through comparative studies of nucleotide sequences. Journal of Molecular Evolution, 16: 111-120.) were obtained in Arlequin v. 3.11 (Excoffier et al ., 2005Excoffier, L., G. Laval & S. Schneider. 2005. Arlequin (version 3.0): an integrated software package for population genetic data analysis. Evolutionary Bioinformatics Online, 1: 47-50.), as were the pairwise differences between localities. The genealogical relationships among the haplotypes were defined by a haplotype network, constructed in the Haploviewer program (Salzburger et al., 2011Salzburger, W., G. B. Ewing & A. von Haeseler. 2011. The performance of phylogenetic algorithms in estimating haplotype genealogies with migration. Molecular Ecology, 20: 1952-1963.) using the Maximum Likelihood algorithm obtained in JmodelTest 2 (Darriba et al., 2012Darriba, D., G. L. Taboada, R. Doallo & D. Posada. 2012. jModelTest 2: more models, new heuristics and parallel computing. Nature Methods, 9: 772.).
The demographic history of Bagre bagre in the western South Atlantic was reconstructed in a Bayesian framework using the Bayesian Skyline Plot (BSP), run in BEAST v. 1.7.4 (Drummond & Rambaut, 2007Drummond, A. J. & A. Rambaut. 2007. BEAST: Bayesian evolutionary analysis by sampling trees. BMC Evolutionary Biology, 7: 214.). These analyses use the Monte Carlo Markov Chain (MCMC) method, based on nucleotide sequence data to estimate posterior distributions of effective population size (Ne ) over time. The evolutionary model used to simulate the BSP curves was selected in jModelTest 2 (Darriba et al., 2012Darriba, D., G. L. Taboada, R. Doallo & D. Posada. 2012. jModelTest 2: more models, new heuristics and parallel computing. Nature Methods, 9: 772.). The best evolutionary model selected was that of Hasegawa-Kishino-Yano with invariable sites (HKY+I) (-lnL= 1072.13, BIC= 4201.87) (HKY+I). Two independent runs of 100,000,000 MCMC interactions were conducted, with samples being taken every 1000 generations. The first 10 million samples were discarded as burn-in. The program LogCombiner v. 1.7.4 (Rambaut & Drummond, 2009Rambaut, A. & A. J. Drummond. 2009. Tracer v.1.5. Available from: Available from: http://beast.bio.ed.ac.uk/LogCombiner
. (9 July 2015).
http://beast.bio.ed.ac.uk/LogCombiner...
) was used to combine the independent runs to produce graphic representations of the BSP.
Morphological analyses. The analysis of morphological variation in the Bagre bagre group was based on both morphometric and meristic characters. Forty-seven measurements were taken from 98 specimens (Fig. 1, Appendix 2), following the diagnostic approach of Marceniuk (2007Marceniuk, A. P. 2007. Revalidação de Cathorops arenatus (Valenciennes, 1840) e Cathorops agassizii (Eigenmann & Eigenmann, 1888) (Siluriformes, Ariidae), bagres marinhos das regiões norte e nordeste da América do Sul. Iheringia, Série Zoologia, 97: 360-375.). Meristic counts were made of the anal fin rays and the rakers of the first and second gill arches. Quantitative measurements were taken using either a ruler (to the nearest millimeter) or dial callipers (precision of 0.1 mm). The data were analyzed using XLStat (Microsoft Excel), following the log-transformation of the co-variance matrix. Variables that were constant, fluctuated randomly or varied according to body size or sex, were excluded from the PCA.
The specimens examined in the morphological study were obtained from the zoological collections of LBP, MPEG, Museu de Zoologia da Universidade de São Paulo (MZUSP), and National Museum of Natural History at the Smithsonian Institution, Washington DC (USNM) (Appendix 2).
Ethics Statement. The species analyzed in the present study are not endangered or protected in the regions from which the specimens were obtained. All the specimens were caught by local fishermen, and were handled in strict accordance with practices defined by the relevant local animal welfare body.
Results
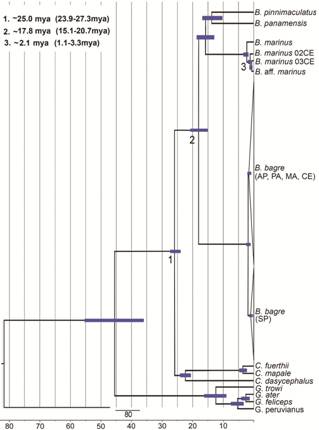
Phylogenetic analyses and divergence times. A total of 769 base pairs (bps) were sequenced from the Cytb gene, and 758 bps from the ATPase 8/6 gene, resulting in a concatenated dataset of 1527 bps. The TIM2+G evolutionary model was selected for both the maximum likelihood and Bayesian inference trees, and their topologies were highly similar, to the extent that only the Bayesian tree is presented here (Fig. 2). The topologies provide evidence of the existence of two B. bagre lineages, one from the northern Brazilian coast (including the semi-arid sector of the northeast coast, following morphological data, see below) and one from the eastern and southern Brazilian coast (including the humid sector of the northeast coast, following morphological data, see below) (Figs. 1-2). The two clades are supported by ML (100%) and BI (1.0) values. The Bayesian analysis of the most recent common ancestor (Fig. 3) indicated that the separation of the two B. bagre lineages occurred approximately 1.7 mya (range: 1.11-2.44 mya).

Phylogenetic tree of the Bayesian Inference of the Bagre derived from the concatenated database of the Cytb 1 and ATPase 8/6 genes. Only unique haplotype are included here. The first value on each branch corresponds to the ML support value and the second one to the BI. Only support values and posterior probabilities above 60% are shown. Grey = northern Brazilian coast lineage, including the semi-arid sector of the northeast coast; Black = southern Brazilian coast.

Bayesian strict clock chronogram based on the 1535 bps of the concatenated genes (Cytb and ATPase 8/6). The calibration points and evolutionary rates were based on Betancur-R. & Armbruster (2009Betancur-R., R. & J. W. Armbruster. 2009. Molecular clocks provide new insights into the evolutionary history of Galeichthyine sea catfishes. Evolution, 63: 1232-1243.).
Haplotype diversity and demography. A high degree of haplotype diversity was found in the population from the Brazilian northern and northeast semi-arid coast, whereas genetic diversity was very low in the stock from Brazilian southeastern coast (Fig. 4; Table 1). As the observed pattern of haplotype diversity may have been influenced by the difference in sample size between the two lineages, given that the northern lineage was represented by 64 specimens, and the southeastern lineage, by only 16 specimens, comparisons of the diversity of sites with the same sample size (Maranhão and Ceará States) were run, although they produced results that were highly similar to those of the general analysis (Table 1). Estimated haplotype diversity for the 16 specimens from southeastern lineage (São Paulo State) was 0.35 (0.135), while the values recorded for Maranhão (16 specimens) and Ceará (15 specimens) were more than twice this, at 0.85 (0.077) and 0.76 (0.009), respectively. It is important to note that the difference in the sample size for the populations of eastern and southern Brazil was not due to sampling deficiencies, but rather the naturally reduced abundance of the species in this region, a well-documented phenomenon (Dantas et al., 2010Dantas, D. V., M. Barletta, M. F. Costa, S. C. T. Barbosa-Cintra, F. E. Possatto, J. A. A. Ramos, A. R. A. Lima & U. Saint-Paul. 2010. Movement patterns of catfishes (Ariidae) in a tropical semi-arid estuary. Journal of Fish Biology, 76: 2540-2557.; Marceniuk et al., 2015Marceniuk, A. P., R. Betancur, T. Giarrizzo, F. L. Fredou & S. Knudsen. 2015. Bagre bagre . The IUCN Red List of Threatened Species, 2015, e.T190228A1945010. Available from: Available from: http://dx.doi.org/10.2305/IUCN.UK.2015-2.RLTS.T190228A19450.en
. (15 May 2016).
http://dx.doi.org/10.2305/IUCN.UK.2015-2...
).

Genealogies of the haplotypes of (A) the mitochondrial Cytb gene, based on the TIM2+I+G evolutionary model, and (B) the mitochondrial ATPase 8/6 gene, based on the HKY+G model. Green = northern Brazilian coast influenced by the Amazon-Orinoco plume, Light blue = semi-arid northeastern coast, Orange = southeastern coast.
Diversity indices derived from the sequences of the concatenated Cytb and ATPase 8/6 genes analyzed in the present study from different Brazilian Bagre bagre populations. Abbreviations: A=Geographic areas, B=Brazilian political states, N=number of individuals; Nc=northern Brazilian coast; PS=polymorphic sites; H =haplotype diversity; π=nucleotide diversity, sa=semi-arid northeastern coast of Brazil; Sc=southeast Brazilian coast. Standard deviations are show in parentheses. *Significance value (P<0.05).
The tests of equilibrium of mutation/drift (Tajima's D and Fu's Fs ) returned negative, but not significant values, when the population of each locality was considered separately. However, given the initial results, which indicated that the northern Brazilian lineage represents a distinct species from that of the eastern and southern coast of Brazil, considering that the Fs were negative and significant considering all the localities from the northern and northeastern coast together (Table 1).
The greatly reduced genetic variability found in the São Paulo lineage meant that the ESS values obtained from our BEAST simulations were not statistically reliable enough to reconstruct the BSP curves for this lineage. Given this, the BSP curves are presented here only for the northern Brazilian lineages. The curves of the BSP also indicate population expansion in both genes. The population of the northern Brazilian lineage underwent an expansion approximately 10,000 years ago, during which its effective size (Ne ) increased from ~374861-11 (29.882-12 to 1660690-10) to ~464295-10 (33262-12 to 2144211-9) at 7500 years ago, to ~925823-10 (79277-11 to 4356937-10) around 1500 years ago (Fig. 5A). This expansion was more discreet for the ATPase 8/6 data, but the period coincided with that of the Cytb gene (Fig. 5B). Due to the reduced genetic variability of the southeastern population, it was not possible to plot the BSP curve with an adequate ESS for analysis.

Bayesian Skyline Plot for the northern lineage of Bagre bagre . The curves A and B correspond to the Cytb and ATPase 8/6 genes respectively. The y-axis indicates effective population size (Ne) vs. generation time, while the x-axis indicates the mean time in thousands of years before present.
The Fst values and the results of the AMOVA also confirmed the differentiation of the Brazilian northern and northeast semi-arid coast lineage from the southeast coast lineage. The Fst values were not significant for all the pairs of northern coast populations, although when these populations were compared with that from the southeast coast, the values varied from 0.641 to 0.771 (Table 2). The results of the AMOVA also indicated that most of the variation (59.91%) is found between populations (Table 3). The haplotype network generated with the not connected genes indicates that haplotypes were shared by northern and northeast semi-arid coast lineage, but none of these populations shared any of the haplotypes found in the specimens from the southeastern coast of Brazil (Fig. 4).
Genetic divergence (Fst) between the species groups identified through the analysis of the Cytb+ATPase 8/6 genes. In the upper diagonal, the P values for Fst. Standard deviations are in parentheses.
Results of the Analysis of Molecular Variance (AMOVA) for the Cytb+ATPase 8/6 genes in populations of Bagre bagre analyzed in the present study.
Morphological evidence. The Principal Components Analysis (PCA) of nine morphometric and one meristic variables was used to characterize the variation in the morphology of B. bagre within its geographic distribution (Marceniuk & Menezes, 2007Marceniuk, A. P. & N. A. Menezes. 2007. Systematics of the family Ariidae (Ostariophysi, Siluriformes), with a redefinition of the genera. Zootaxa, 1416: 1-126.). The variables including in the analysis were the number of anal fin rays (AR), anal fin base length (ABL), maxillary barbel length (MaBL), mental barbel length (MeBL), mouth width (MW), body width (BW), nuchal-plate width (NPW), length of the prolongation of the pectoral fin (PP), distance from snout to dorsal fin (SDr), and distance from snout to anal fin (SAn). The PCA revealed two principal clusters, one encompassing specimens from the northern and semi-arid northeastern coast of Brazil, and the other, the populations from the humid northeast, eastern, and southeastern coasts (Fig. 6). Axis 1 explained 37.10% of total variation, and together, factors 1 and 2 explained together 50.62% of the variation (Fig. 6).

Scatterplots of the principal components PC1 and PC2, obtained from the analysis of one meristic and nine morphometric variables in Bagre bagre , with factor loadings for the first principal components. Abbreviations: E, east Brazilian coast; h, humid northeastern coast of Brazil; N, northern Brazilian coast; sa, semi-arid northeastern coast of Brazil; S, southeast Brazilian coast.
Discussion
The molecular analysis indicated that the separation of the two B. bagre lineages occurred approximately 1.7 mya (range: 1.11-2.44 mya), in the early Pleistocene. The Pleistocene (2.6 mya - 11.7 ka) was a period of extreme oscillations in climate (Pillans et al., 1998Pillans, B., J. Chappell & T. R. Naish. 1998. A review of the Milankovitch climatic beat: template for Plio-Pleistocene sea-level changes and sequence stratigraphy. Sedimentary Geology, 122: 5-21.), with major fluctuations in global sea levels (Lambeck & Chappell, 2001Lambeck, K. & J. Chappell. 2001. Sea level change through the last glacial cycle. Science, 292: 679-686.; Miller et al., 2005Miller, K. G., M. A. Kominz, J. V. Browning, J. D. Wright, G. S. Mountain, M. E. Katz, P. J. Sugarman, B. S. Cramer, N. Christie-Blick & S. F. Pekar. 2005. The Phanerozoic record of global sea-level change. Science, 310: 1293-1298.), and intense speciation in many biotas (Hewitt, 1996Hewitt, G. M. 1996. Some genetic consequences of ice ages, and their role in divergence and speciation. Biological Journal of the Linnean Society, 58: 247-276.). The marine fauna of the shallow coastal waters and species dependent on estuaries were affected by the sea level variations, when estuarine habitats would have virtually disappeared and coastal habitats would be restricted to small enclaves, with many populations being eliminated (Grant & Bowen, 2006Grant, W. S. & B. W. Bowen. 2006. Living in a tilted world: climate change and geography limit speciation in Old World anchovies (Engraulis ; Engraulidae). Biological Journal of the Linnean Society, 88: 673-689.).
Especially in temperate southwestern Atlantic variations in sea level has been recognized as the principal factor determining habitat modifications, with coastal species being fragmented on the continental shelf of South America (Sprechmann, 1978Sprechmann, P. 1978. The paleoecology and paleogeography of the Uruguayan coastal area during the Neogene and Quaternary. Zitteliana, 4: 3-72.), with marked effects on the historical demography of estuarine and coastal marine fish species (Beheregaray et al., 2002Beheregaray, L. B., P. Sunnucks & D. A. Briscoe. 2002. A rapid fish radiation associated with the last sealevel changes in southern Brazil: the silverside Odontesthes perugiae complex. Proceedings of the Royal Society of London, Biological Sciences, 269: 65-73.; García et al., 2008García, G., J. Vergara, & V. Gutiérrez. 2008. Phylogeography of the Southwestern Atlantic menhaden genus Brevoortia (Clupeidae, Alosinae). Marine Biology, 155: 325-336., 2011García, G., G. Martínez, S. Retta, V. Gutiérrez, J. Vergara & M. M. Azpelicueta. 2011. Multidisciplinary identification of clupeiform fishes from the Southwestern Atlantic Ocean. International- Journal of Fisheries and Aquaculture, 2: 42-53.), resulting in the successive expansion and retraction of populations, associated with fluctuations in climate (Anderson, 2007Anderson, J. D. 2007. Systematics of the North American menhadens: molecular evolutionary reconstructions in the genus Brevoortia (Clupeiformes: Clupeidae). Fishery Bulletin, 105: 368-378.; Garcia et al ., 2008García, G., J. Vergara, & V. Gutiérrez. 2008. Phylogeography of the Southwestern Atlantic menhaden genus Brevoortia (Clupeidae, Alosinae). Marine Biology, 155: 325-336.; Pereira et al., 2009Pereira, A. N., A. Márquez, M. Marin & Y. Marin. 2009. Genetic evidence of two stocks of the whitemouth croaker Micropogonias furnieri in the Río de la Plata and oceanic front in Uruguay. Journal of Fish Biology, 75: 321-331; Pereyra et al., 2010Pereyra, S., G. García, P. Miller, S. Oviedo & A. Domingo. 2010. Low genetic diversity and population structure of the narrownose shark (Mustelus schmitti ). Fisheries Research, 106: 468-473.; Fernández Iriarte et al., 2011Fernández Iriarte, P. J., M. P. Alonso, D. E. Sabadin, P. A. Arauz & C. M. Iudica. 2011. Phylogeography of weakfish Cynoscion guatucupa (Perciformes: Sciaenidae) from the southwestern Atlantic. Scientia Marina, 75: 701-706.). However, comparative analyses of the southwestern Atlantic cannot provide an evaluation of the effects of Quaternary changes in sea level on the northern and northeastern Brazilian coast.
While few comparative studies are available for the northern and northeastern Brazilian coasts, Santos et al. (2006Santos, S., T. Hrbek, I. P. Farias, H. Schneider & I. Sampaio. 2006. Population genetic structuring of the king weakfish, Macrodon ancylodon (Sciaenidae), in Atlantic coastal waters of South America: deep genetic divergence without morphological change. Molecular Ecology, 15: 4361-4373.) also recognized two distinct lineages of Macrodon ancylodon , which separated in the early Pleistocene. One lineage [= Macrodon ancylodon see Carvalho-Filho et al. (2010Carvalho-Filho, A., S. Santos & I. Sampaio. 2010. Macrodon atricauda (Günther, 1880) (Perciformes: Sciaenidae), a valid species from the southwestern Atlantic, with comments on its conservation. Zootaxa,2519: 48-58.)] occurs between Venezuela (11 °N) and the Brazilian state of Bahia (18° S), and the second lineage [= Macrodon atricauda (Günther, 1880) see Carvalho-Filho et al . (2010Carvalho-Filho, A., S. Santos & I. Sampaio. 2010. Macrodon atricauda (Günther, 1880) (Perciformes: Sciaenidae), a valid species from the southwestern Atlantic, with comments on its conservation. Zootaxa,2519: 48-58.)] is found between the Brazilian state of Espírito Santo (18° S) and Argentina (43° S). Different patterns of replacement of the tropical clades by subtropical ones in Bagre bagre and Macrodon ancylodon may reflect differences in their adaptive responses to climate change (primarily temperature, salinity, marine currents, and fluctuations in coastal habitats) (Fernández-Iriarte et al., 2011Fernández Iriarte, P. J., M. P. Alonso, D. E. Sabadin, P. A. Arauz & C. M. Iudica. 2011. Phylogeography of weakfish Cynoscion guatucupa (Perciformes: Sciaenidae) from the southwestern Atlantic. Scientia Marina, 75: 701-706.). It is important to note that, like B. bagre (Pinheiro et al., 2006Pinheiro, P., M. K. Broadhurst, F. H. V. Hazin, T. Bezerra & S. Hamilton. 2006. Reproduction in Bagre marinus (Ariidae) off Pernambuco, northeastern Brazil. Journal of Applied Ichthyology, 22: 189-192.; Garcia Júnior et al., 2010Garcia Júnior, J., L. F. Mendes, C. L. S. Sampaio & J. E. Lins. 2010. Biodiversidade marinha da Bacia Potiguar: ictiofauna. Rio de Janeiro, Museu Nacional, 195p. (Série Livros, 38). ), Macrodon ancylodon is relatively rare on the northeastern coast of Brazil, in comparison with the northern and southern regions (IBAMA, 2007IBAMA. 2007. Estatística da pesca 2005. Brasil: grandes regiões e unidades da Federação. Brasília, D.F., 108p., 2008IBAMA. 2008. Estatística da pesca 2006. Brasil: grandes regiões e unidades da Federação. Brasília, D.F., 180p.).
Considering allopatric speciation as the predominant geographic mode of species formation, it is reasonable to assume that vicariant differentiation may have arisen from the features of the coast of the Brazilian northeast, in particular the extremely narrow continental shelf (Fig. 1, Muehe & Garcez, 2005Muehe, D. & D. S. Garcez. 2005. A plataforma continental brasileira e sua relação com a zona costeira e a pesca. Mercator Revista de Geografia da UFC, 4: 69-88.), which may have an enhanced effect during regression events, when it would have acted as a physical barrier between the northern and southern-southeastern coasts. This is corroborated by receding sea levels during the Pleistocene, that exposed as much as 92% of the continental shelf that is inhabitable in the present day (Ludt & Rocha, 2015Ludt, W. B. & L. A. Rocha. 2015. Shifting seas: the impacts of Pleistocene sea-level fluctuations on the evolution of tropical marine taxa. Journal of Biogeography, 42: 25-38.). As the data offer no direct or conclusive evidence of the nature of the process lineage isolation, all potential scenarios discussed are hypothetical.
Glacial cycles and demography. The reduced haplotype diversity found in the southern lineage provides evidence of recent bottlenecks, possibly related to reductions in population size during the Holocene regression events (Rabassa et al., 2005Rabassa, J., A. M. Coronato & M. Salemme. 2005. Chronology of the Late Cenozoic Patagonian glaciations and their correla tion with biostratigraphic units of the Pampean region (Argen tina). Journal of South American Earth Sciences, 20: 81-103.; Ruzzante et al., 2008Ruzzante, D. E., S. J. Walde, J. C. Gosse, V. E. Cussac, E. Habit, T. S. Zemlak & E. D. M. Adams. 2008. Climate control on ancestral population dynamics: insight from Patagonian fish phylogeography. Molecular Ecology, 17: 2234-2244.). This conclusion is supported by the significantly higher indices of nucleotide diversity found in the northern lineage (populations from the northern and semi-arid northeastern coasts of Brazil) in comparison with the southeastern lineage, i.e ., the humid northeastern, eastern, and southeastern coasts of Brazil (Fig. 4, Table 1). However, the analyses used to test this hypothesis lead to distinct conclusions with regard to the influence of the glacial cycles of the Holocene on the two lineages.
The results of the BSP analysis (Fig. 5) indicate a population expansion in the northern lineage around 10,000 years ago, which supports the hypothesis that the last glacial maximum played an important role in the demography of this lineage. In the Brazilian Amazon basin, two Pleistocene glacial cycles are recognized, denominated the Tucunanduba and Uatumã glaciations (Riker et al., 2015Riker, S. R. L, F. J. C Lima & M. B. Motta. 2015. Evidências de glaciação Pleistocênica na Amazônia Brasileira. In: Simpósio de Geologia da Amazônia, 14. Marabá-PA, 2015. Anais... Marabá-PA, Sociedade Brasileira de Geologia.. ). During the Tucunanduba "Glaciation" (41,850±6380 years ago), the climate was very dry, and sea levels were 100-120 m below that of the present day, with the formation of a thick ice cap on the Guiana Shield. Following a new interglacial cycle, characterized by the deposition of the Belterra Formation, the climate once again dried and sea levels fell, initiating the Uatumã Glaciation, which followed by an interglacial period in the Holocene, which persists to the present day (Riker et al ., 2015Riker, S. R. L, F. J. C Lima & M. B. Motta. 2015. Evidências de glaciação Pleistocênica na Amazônia Brasileira. In: Simpósio de Geologia da Amazônia, 14. Marabá-PA, 2015. Anais... Marabá-PA, Sociedade Brasileira de Geologia.. ). In the Brazilian state of Pará, sea levels may never have higher at any time during the Holocene than at the present time (Angulo et al., 2006Angulo, R. J., G. C. Lessa & M. C. Souza. 2006. A critical review of mid- to late-Holocene sea-level fluctuations on the eastern Brazilian coastline. Quaternary Science Reviews, 25: 486-506.).
The low genetic diversity of the southeastern lineage indicates that the influence of the last glacial cycle was more pronounced in this region, due primarily to the significant loss of habitat, such as the areas of mangrove, which are limited by the 20ºC isotherm temperature, leading to the abrupt reduction or disappearance of these forests (Maia et al., 2006Maia, L. P., L. D. Lacerda, L. H. U. Monteiro & G. M. Souza. 2006. Atlas dos Manguezais do Nordeste do Brasil: avaliação das áreas de manguezais dos estados do Piauí, Ceará, Rio Grande do Norte, Paraíba e Pernambuco. Fortaleza, ISME-BR, Instituto de Ciências do Mar, UFCE, ABCC, 49p.). At around 18,000 years ago, sea level was approximately 130 m below its present level, which was followed by three intermediate periods of stabilization, at 11,000 years B.P. (sea level -60 m to -70 m in comparison with the present day), 9000 years B.P. (-32 m to -45 m) and 8000 years B.P. (-20 m to -25 m) (Mahiques et al., 2010Mahiques, M. M., S. H. M. Sousa, V. V. Furtado, M. G. Tessler, F. A. L. Toledo, L. Burone, R. C. L. Figueira, D. A. Klein, C. C. Martins & D. P. V. Alves. 2010. The southern Brazilian shelf: general characteristics, quaternary evolution and sediment distribution. Brazilian Journal of Oceanography, 58: 25-34.). The present-day sea level may only have been reached around 7100 years ago, with much less subsequent variation (Angulo et al., 2006Angulo, R. J., G. C. Lessa & M. C. Souza. 2006. A critical review of mid- to late-Holocene sea-level fluctuations on the eastern Brazilian coastline. Quaternary Science Reviews, 25: 486-506.), with the principal event occurring some 5100 years ago, when sea levels increased 4.8±0.5 m in comparison with the present day.
One other factor that needs to be taken into account is the intensive fishing on the southern and southeastern coasts of Brazil which, together with the intrinsic characteristics of the species, such as its late reproductive maturation, high longevity, low fecundity, and long period of parental care (Marceniuk et al., 2015Marceniuk, A. P., R. Betancur, T. Giarrizzo, F. L. Fredou & S. Knudsen. 2015. Bagre bagre . The IUCN Red List of Threatened Species, 2015, e.T190228A1945010. Available from: Available from: http://dx.doi.org/10.2305/IUCN.UK.2015-2.RLTS.T190228A19450.en
. (15 May 2016).
http://dx.doi.org/10.2305/IUCN.UK.2015-2...
), may contribute to the reduced genetic diversity of the lineage from southeastern Brazil. The Coco sea catfish is caught only occasionally in artisanal gillnets in Santa Cruz, Espírito Santo State (18°-21° S) (Freitas Netto et al., 2002Freitas Netto, R., A. G. A. Nunes & J. Albino. 2002. A pesca realizada na comunidade de pescadores artesanais de Santa Cruz/ES - Brasil. Boletim do Instituto de Pesca, São Paulo, 28: 93-100.) and as by-catch in shrimp trawls on the São Paulo coast (22°-25° S) (Lopes et al., 2002Lopes, R. G., A. R. G. Tomás, S. L. S. Tutui, E. S. Rodrigues & A. Puzzi. 2002. Fauna acompanhante da pesca camaroeira no litoral do estado de São Paulo, Brasil. Boletim do Instituto de Pesca, São Paulo,28: 173-188.), reflecting its reduced abundance. On the other hand, data from the Chico Mendes Institute for the Conservation of Biodiversity of the Brazilian government, indicate that the White sea catfish, Genidens barbus , the principal target of the industrial fisheries of southeastern Brazil, is endangered with extinction (IUCN, 2015International Union for conservation of Nature (IUCN). 2015. The IUCN Red List of Threatened Species. Version 2015.2. Available from: Available from: http://www.iucnredlist.org
. (23 June 2015).
http://www.iucnredlist.org...
), based on an estimated population decline of at least 70% (http://www.icmbio.gov.br/portal/biodiversidade/fauna-brasileira/lista-de-especies/6262-especie-6262.html). Considering the lack of discrimination or selectivity in the exploitation of demersal resources by the region's fisheries (industrial or artisanal), it is reasonable to conclude that Genidens barbus and Bagre bagre suffer the same pressure from fisheries on the southeastern coast of Brazil, given the similarities in the lifestyle and geographic distribution of the two species.
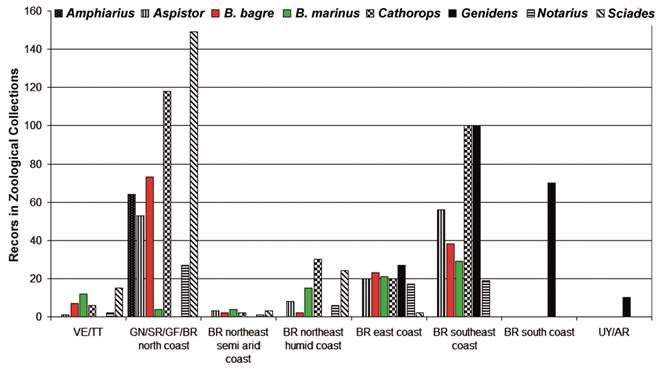
Habitat preferences and geographic distribution. The distribution of Bagre marinus and both B. bagre lineages indicates a disjunct spatial distribution on the Atlantic coast of South America (Fig. 7). While Bagre bagre is extremely common in the region influenced by the Amazon Plume (Le Bail et al., 2000Le Bail, P. -Y., P. Keith & P. Planquette. 2000.Atlas des poissons d'eau douce de Guyane. Paris, Muséum National d´Histoire Naturelle, Concil Supérieur de la Pêche, INRA-Institut National de la Recherche Agronomique. t. 2, fascícule 2: Siluriformes. (Collection du patrimoine naturel, 43).; Artigas et al., 2003Artigas, L. F., P. Vendeville, M. Leopold, D. Guiral & J. F. Ternon. 2003. Marine biodiversity in French Guiana: estuarine, coastal, and shelf ecosystems under the influence of Amazonian waters. Gayana, 67: 302-326.), B. marinus is rare or absent from this area (Pinheiro et al., 2006Pinheiro, P., M. K. Broadhurst, F. H. V. Hazin, T. Bezerra & S. Hamilton. 2006. Reproduction in Bagre marinus (Ariidae) off Pernambuco, northeastern Brazil. Journal of Applied Ichthyology, 22: 189-192.; Garcia Júnior et al., 2010Garcia Júnior, J., L. F. Mendes, C. L. S. Sampaio & J. E. Lins. 2010. Biodiversidade marinha da Bacia Potiguar: ictiofauna. Rio de Janeiro, Museu Nacional, 195p. (Série Livros, 38). ) (Fig. 7). This spatially disjunct distribution may be related to preferences for distinct salinity levels, mainly determined by the freshwater discharge of local rivers (Fig. 7; Table 4).

A. Occurrence of Bagre bagre , Bagre marinus and other species of the genera Amphiarius , Aspistor , Cathorops , Genidens , Notarius , and Sciades , on the Atlantic coast of South America. Numbers of the lots deposited in zoological collections.
Mean discharge of the hydrographic basins of the different coastal regions of Brazil, based ANA (2005Agência Nacional de Águas (ANA). 2005. Disponibilidade e demandas de recursos hídricos no Brasil. Brasília, D.F. 123p. ).
The northern coast of Brazil is dominated by many major rivers, with a total input of approximately 1.8 x 10⁵ m³/s of freshwater (Curtin & Legeckis, 1986Curtin, T. B. & R. V. Legeckis. 1986. Physical observations in the plume region of the Amazon River during peak discharge-I. Surface variability. Continental Shelf Research, 6: 31-51.; Agência Nacional de Águas (ANA), 2005Agência Nacional de Águas (ANA). 2005. Disponibilidade e demandas de recursos hídricos no Brasil. Brasília, D.F. 123p. ), and salinity may fall to as low as 32 psu during the period of peak discharge of the Amazon River, which may reach 2.4 x 10⁵ m³/s (Lentz, 1995Lentz, S. J. 1995. Seasonal variations in the horizontal structure of the Amazon Plume inferred from historical hydrographic data.Journal of Geophysical Research, 100: 2391-2400.; Grodsky et al., 2014Grodsky, S. A., G. Reverdin, J. A. Carton & V. J. Coles. 2014. Year-to-year salinity changes in the Amazon plume: Contrasting 2011 and 2012 Aquarius/SACD and SMOS satellite data. Remote Sensing of Environment, 140: 14-22. ) (Table 4). This water, together with the discharge of the Orinoco River, which peaks at 7 x 10⁴ m³/s (Hu et al., 2004Hu, C., E. T. Montgomery, R. W. Schmitt & F. E. Muller-Karger. 2004. The dispersal of the Amazon and Orinoco River water in the tropical Atlantic and Caribbean Sea: observation from space and S-PALACE floats. Deep Sea Research II, 51: 1151-1171. ), forms the Atlantic Plume, a 160,000 km² area of less saline water with high concentrations of suspended sediments (Grodsky et al ., 2014Grodsky, S. A., G. Reverdin, J. A. Carton & V. J. Coles. 2014. Year-to-year salinity changes in the Amazon plume: Contrasting 2011 and 2012 Aquarius/SACD and SMOS satellite data. Remote Sensing of Environment, 140: 14-22. ). This region is dominated by the largest contiguous area of mangrove forest in the world (Schaeffer-Novelli et al., 1990Schaeffer-Novelli, Y., G. Cintrón-Molero, R. R. Adaime & T. M. Camargo. 1990. Variability of mangrove ecosystems along the Brazilian coast. Estuaries, Lawrence, 13: 204-218.), with a total area of approximately 10,717 km² (Kjerfve & Lacerda, 1993Kjerfve, B. & L. D. Lacerda. 1993. Mangroves of Brazil. Pp. 245-272. In: Lacerda, L. D. (Coord.). Conservation and sustainable utilization of mangrove forests in Latin America and Africa regions. Okinawa, Japan, International Society for Mangrove Ecosystems (ISME); Yokohama, Japan, International Tropical Timber Organization (ITTO). (Mangrove ecosystems technical reports, v. 2). ).
By contrast, the coast of northeastern Brazil is characterized by the presence of small- to medium-sized estuaries influenced by semiarid climates, with a discreet input of freshwater from the local rivers and a reduced discharge of sediments into the coastal waters (Ekau & Knoppers, 1999Ekau, W. & B. A. Knoppers. 1999. An introduction to the pelagic system of the North-East and East Brazilian shelf. Archive of Fishery and Marine Research, 47: 113-132.), and a restricted development of estuarine mangrove systems (Kjerfve & Lacerda, 1993Kjerfve, B. & L. D. Lacerda. 1993. Mangroves of Brazil. Pp. 245-272. In: Lacerda, L. D. (Coord.). Conservation and sustainable utilization of mangrove forests in Latin America and Africa regions. Okinawa, Japan, International Society for Mangrove Ecosystems (ISME); Yokohama, Japan, International Tropical Timber Organization (ITTO). (Mangrove ecosystems technical reports, v. 2). ). One exception is the São Francisco River, the second largest drainage basin in Brazil. The mouth of the São Francisco lies in the direct path of the Southern Equatorial Current (SEC), which intrudes onto the continental shelf and the coast at three points 7° S and 17° S, where Brazil's western boundary currents originate. Between 7° S and 10° S, the SEC flows northwestward, forming the Northern Brazil Current, and at around 15°S, it forms the Brazilian Current (Stramma et al., 1990Stramma, L., Y. Ikeda & R. G. Peterson. 1990. Geostrophic transport in the Brazil current region north of 20°S. Deep-Sea Research, 37: 1875-1886.; Knoppers et al. , 2005Knoppers, B., P. R. P. Medeiros, W. F. L. Souza & T. Jennerjahn. 2005. The São Francisco Estuary, Brazil. Pp. 51-70. In: Wangersky, P. (Ed.). The Handbook of Environmental Chemistry, Berlin, Springer Verlag. v. 5: water pollution: estuaries. ). The sediment plume emanating from the mouth of the São Francisco, which is deflected southwards (Knoppers et al. , 2005Knoppers, B., P. R. P. Medeiros, W. F. L. Souza & T. Jennerjahn. 2005. The São Francisco Estuary, Brazil. Pp. 51-70. In: Wangersky, P. (Ed.). The Handbook of Environmental Chemistry, Berlin, Springer Verlag. v. 5: water pollution: estuaries. ) inhibits the development of coral reefs because of the turbidity of the water off the coast of Sergipe and northern Bahia (Villwock et al., 2005Villwock, J. A., G. C. Lessa, K. Suguio, R. J. Angulo & S. R. Dillenburg. 2005. Geologia e geomorfologia de regiões costeiras. Pp. 94-113. In: Souza, C. R. G., K. Suguio, A. M. S. Oliveira & P. E. Oliveira (Eds.). Quaternário do Brasil. Ribeirão Preto, SP, Holos, Editora.). The absence of coral reefs off the coast allows the tide to penetrate the local estuaries, contributing to the establishment of the region's mangroves which are fundamental to the life cycle of the ariids. Seasonal variations in the plume of the São Francisco, and the Northern Brazilian Current (Knoppers et al. , 2005Knoppers, B., P. R. P. Medeiros, W. F. L. Souza & T. Jennerjahn. 2005. The São Francisco Estuary, Brazil. Pp. 51-70. In: Wangersky, P. (Ed.). The Handbook of Environmental Chemistry, Berlin, Springer Verlag. v. 5: water pollution: estuaries. ), may contribute to the records of the species further north.
One other important factor related to the presence of areas of mangrove is the variation in the timing and intensity of the rainy season, which determined the breeding season of the ariid species (Araújo, 1988Araújo, F. G. 1988. Distribuição, abundância relativa e movimentos sazonais de bagres marinhos (Siluriformes, Ariidae) no estuário da Lagoa dos Patos (RS), Brasil. Revista Brasileira de Zoologia,5: 509-543.). Ariids are mouth-brooding fish, and the male carries a few large eggs in its mouth for approximately two months until the eggs hatch and the fry become free-swimming. The breeding season of ariids is related to the rainy season, extending into the dry season (Mishima & Tanji, 1983Mishima, M. & S. Tanji. 1983. Maturação e desova dos bagres marinhos (Osteichthyes, Ariidae) do complexo estuarino lagunar de Cananéia (25°S, 48°W). Boletim do Instituto de Pesca, 10: 129-141. ; Gomes & Araújo, 2004Gomes, I. D. & F. G. Araújo. 2004. Reproductive biology of marine catfishes (Siluriformes, Ariidae) in the Sepetiba Bay, Brazil. Revista de Biología Tropical, 52: 143-156.). On the northern coast of Brazil, the dry season ends in December, with the rainy season extending from January to June. On the northeastern coast, the late dry season is in February, with the early rainy season from March to May, and the late rainy season from June to August. On the southeastern coast, the dry season ends in October, and the rainy season lasts until March.
The environmental and behavioral variables identified on the coast of northeastern Brazil can be considered to be "soft" barriers, but even so, have a strong influence on the distribution of the two lineages of B. bagre , as well as all other ariid species found on the Brazilian coast. This conclusion is reinforced by the distribution of the species of other genera found on the Brazilian coast. Amphiarius phrygiatus (Valenciennes, 1840), A. rugispinis (Valenciennes, 1840), Aspistor quadriscutis (Valenciennes, 1840), Cathorops arenatus (Valenciennes, 1840), Sciades parkeri (Traill, 1832), S. passany (Valenciennes, 1840), and S. couma (Valenciennes, 1840) are all common throughout all area influenced by the plume of the Amazon-Orinoco, reaching as far south as the Parnaíba River (3° S) in Maranhão, which marks the southern/eastern limit of the northern coast of Brazil (Fig. 1). By contrast, the species of the genus Genidens (see Marceniuk & Menezes, 2007Marceniuk, A. P. & N. A. Menezes. 2007. Systematics of the family Ariidae (Ostariophysi, Siluriformes), with a redefinition of the genera. Zootaxa, 1416: 1-126.), which are common on the eastern and southern coasts of Brazil, are found no further north than Todos os Santos Bay (13° S) in Bahia (Marceniuk & Menezes, 2007Marceniuk, A. P. & N. A. Menezes. 2007. Systematics of the family Ariidae (Ostariophysi, Siluriformes), with a redefinition of the genera. Zootaxa, 1416: 1-126.), the northern limit of the east coast (Fig. 1).
Three other species that are common on the northern coast, Sciades proops (Valenciennes, 1840), Notarius grandicassis (Valenciennes, 1840), two marine species, and Cathorops agassizii (Eigenmann & Eigenmann, 1888), a freshwater species, are also represented by sister species in northeast, east and southeastern Brazil, with the same area of distribution for Aspistor luniscutis , sister species of A. quadriscutis , restricted to the plume of the Amazon-Orinoco. Exceptions to the general pattern are the preferentially estuarine species of the genera Cathorops , that is, C. spixii (Agassiz, 1829) and Sciades , i.e ., S. herzbergii (Bloch, 1794), which are estuarine species found on both the northern and northeastern coasts of Brazil.
Implications for taxonomy and conservation. Bagre bagre is an important fishery resource in northern Brazil (Pinheiro & Fredou 2004Pinheiro, L. A. & F. L. Frédou. 2004. Caracterização geral da pesca industrial desembarcada no estado do Pará. Revista Cientifica da UFPA, 4. Disponível em: http://www.ufpa.br/revistaic.
http://www.ufpa.br/revistaic...
; Isaac-Nahum, 2006Isaac-Nahum, V. J. 2006. Explotação e manejo dos recursos pesqueiros do litoral Amazônico: um desafio para o futuro. Ciência e Cultura, 58: 33-36.), as well as the Guianas and Suriname (Le Bail et al., 2000Le Bail, P. -Y., P. Keith & P. Planquette. 2000.Atlas des poissons d'eau douce de Guyane. Paris, Muséum National d´Histoire Naturelle, Concil Supérieur de la Pêche, INRA-Institut National de la Recherche Agronomique. t. 2, fascícule 2: Siluriformes. (Collection du patrimoine naturel, 43).; Artigas et al., 2003Artigas, L. F., P. Vendeville, M. Leopold, D. Guiral & J. F. Ternon. 2003. Marine biodiversity in French Guiana: estuarine, coastal, and shelf ecosystems under the influence of Amazonian waters. Gayana, 67: 302-326.), but is rare or absent from commercial catches on the eastern and southeastern coast of Brazil (Freitas Netto et al., 2002Freitas Netto, R., A. G. A. Nunes & J. Albino. 2002. A pesca realizada na comunidade de pescadores artesanais de Santa Cruz/ES - Brasil. Boletim do Instituto de Pesca, São Paulo, 28: 93-100.; Lopes et al., 2002Lopes, R. G., A. R. G. Tomás, S. L. S. Tutui, E. S. Rodrigues & A. Puzzi. 2002. Fauna acompanhante da pesca camaroeira no litoral do estado de São Paulo, Brasil. Boletim do Instituto de Pesca, São Paulo,28: 173-188.). The adequate definition of a species is a decisive step in the evaluation of its conservation status, and the development of effective management strategies (Marceniuk et al., 2015Marceniuk, A. P., R. Betancur, T. Giarrizzo, F. L. Fredou & S. Knudsen. 2015. Bagre bagre . The IUCN Red List of Threatened Species, 2015, e.T190228A1945010. Available from: Available from: http://dx.doi.org/10.2305/IUCN.UK.2015-2.RLTS.T190228A19450.en
. (15 May 2016).
http://dx.doi.org/10.2305/IUCN.UK.2015-2...
).
The complete segregation of the two lineages found in the present study supports two distinct species of Bagre bagre . As Linnaeus proposed Silurus bagre for America meridionali (locality probably erroneous) without designating a holotype, it is impossible to determine which of the two forms this name applies to, requiring the designation of a neotype (ICZN, 1999International Commission of Zoological Nomenclature [ICZN]. 1999. International Code of Zoological Nomenclature[4th ed.]. London, The International Trust for Zoological Nomenclature, Natural History Museum.), defining which of the two forms the name should be applied to, while the other population can be named based on one of the nominal species available: Felichthys filamentosus Swainson, 1839 (type locality - estuaries and rivers near Pernambuco), Galeichthys gronovii Valenciennes, 1840 (type locality - Terre-Ferme or Guyane, Maracaibo, Mana River Cayenne or Bahia), Bagrus macronemus Ranzani, 1841 (type locality - Brazil), and Mystus carolinensis Gronow, 1854 (type locality - Tropical America). The taxonomic framework, which defines the specific status of these lineages, will be discussed in a future paper.
Acknowledgements
We are indebted to Sara M. Francisco (Marine and Environmental Sciences Centre and Eco-Ethology Research Unit, ISPA University Institute), Jonathan Ready (UFPA), and Orangel Aguilera (UFF), for critically reviewing the manuscript, and to Stephen Francis Ferrari (UFS) and Jonathan Stuart Ready (UFPA) for reading and correcting most of the English text. This study was supported by the Conselho Nacional de Desenvolvimento Científico e Tecnológico (CNPq) and the Fundação de Amparo a Pesquisa do Estado do Pará (FAPESPA) (Proc. 152782/2007-9 and 350790/2012-4 to APM), and the Coordenação de Aperfeiçoamento de Pessoal de Nível Superior (CAPES) (Proc. 15001016030Pq to WCS), as well as PROPESP/UFPA. We are also grateful to Bianca Bentes, Janice Muriel-Cunha, Péricles Sena, and Luciane Nogueira (UFPA), and Claudio de Oliveira (UNESP), for providing tissue samples for molecular analyses.
References
- Agência Nacional de Águas (ANA). 2005. Disponibilidade e demandas de recursos hídricos no Brasil. Brasília, D.F. 123p.
- Aldous, D. J. 2001. Stochastic models and decriptive statistics for phylogenetic trees, from yule to today. Statistical Science, 16: 23-34.
- Amaral, A. C. Z. & S. Jablonski. 2005. Conservação da biodiversidade marinha e costeira no Brasil. Megadiversidade, 1: 43-51.
- Anderson, J. D. 2007. Systematics of the North American menhadens: molecular evolutionary reconstructions in the genus Brevoortia (Clupeiformes: Clupeidae). Fishery Bulletin, 105: 368-378.
- Angulo, R. J., G. C. Lessa & M. C. Souza. 2006. A critical review of mid- to late-Holocene sea-level fluctuations on the eastern Brazilian coastline. Quaternary Science Reviews, 25: 486-506.
- Araújo, F. G. 1988. Distribuição, abundância relativa e movimentos sazonais de bagres marinhos (Siluriformes, Ariidae) no estuário da Lagoa dos Patos (RS), Brasil. Revista Brasileira de Zoologia,5: 509-543.
- Artigas, L. F., P. Vendeville, M. Leopold, D. Guiral & J. F. Ternon. 2003. Marine biodiversity in French Guiana: estuarine, coastal, and shelf ecosystems under the influence of Amazonian waters. Gayana, 67: 302-326.
- Bacon, C. D., D. Silvestro, C. Jaramillo, B. T. Smith, P. Chakrabarty & A. Antonelli. 2015. Biological evidence supports an early and complex emergence of the Isthmus of Panama. Proceedings of the National Academy of Sciences, 112: 6110-6115.
- Barbanti, B., R. Caires & A. P. Marceniuk. 2013. A ictiofauna do Canal de Bertioga, São Paulo, Brasil. Biota Neotropica, 13: 276-291.
- Beheregaray, L. B., P. Sunnucks & D. A. Briscoe. 2002. A rapid fish radiation associated with the last sealevel changes in southern Brazil: the silverside Odontesthes perugiae complex. Proceedings of the Royal Society of London, Biological Sciences, 269: 65-73.
- Bellwood, D. R. & P. C. Wainwright. 2002. The history and biogeography of fishes on coral reefs. Pp. 5-32. In: Sale, P. F. (Ed.). Coral Reef Fishes: dynamics and diversity on a complex ecosystem. San Dyego, CA, Academic Press.
- Betancur-R., R., A. Acero P., E. Bermingham & R. Cooke. 2007. Systematics and biogeography of New World sea catfishes (Siluriformes: Ariidae) as inferred from mitochondrial, nuclear and morphological evidence. Molecular Phylogenetics and Evolution, 45: 339-357.
- Betancur-R., R, A. Acero P., H. Duque-Caro & S. R. Santos. 2010. Phylogenetic and morphologic analyses of a coastal fish reveals a marine biogeographic break of terrestrial origin in the Southern Caribbean. PLoS ONE, 5: e11566(10p.).
- Betancur-R., R. & J. W. Armbruster. 2009. Molecular clocks provide new insights into the evolutionary history of Galeichthyine sea catfishes. Evolution, 63: 1232-1243.
- Carvalho-Filho, A., S. Santos & I. Sampaio. 2010. Macrodon atricauda (Günther, 1880) (Perciformes: Sciaenidae), a valid species from the southwestern Atlantic, with comments on its conservation. Zootaxa,2519: 48-58.
- Collins, T. 1996. Molecular comparisons of transisthmian species pairs: rates and patterns of evolution. Pp. 303-333. In: Jackson, J. B. C., A. F. Budd & A. G. Coates (Eds.). Evolution and environment in Tropical America. Chicago, University of Chicago Press.
- Curtin, T. B. & R. V. Legeckis. 1986. Physical observations in the plume region of the Amazon River during peak discharge-I. Surface variability. Continental Shelf Research, 6: 31-51.
- Dantas, D. V., M. Barletta, M. F. Costa, S. C. T. Barbosa-Cintra, F. E. Possatto, J. A. A. Ramos, A. R. A. Lima & U. Saint-Paul. 2010. Movement patterns of catfishes (Ariidae) in a tropical semi-arid estuary. Journal of Fish Biology, 76: 2540-2557.
- Darriba, D., G. L. Taboada, R. Doallo & D. Posada. 2012. jModelTest 2: more models, new heuristics and parallel computing. Nature Methods, 9: 772.
- Drummond, A. J. & A. Rambaut. 2007. BEAST: Bayesian evolutionary analysis by sampling trees. BMC Evolutionary Biology, 7: 214.
- Drummond, A. J., S. Y. W. Ho, N. Rawlence & A. Rambaut. 2007. A rough guide to BEAST 1.4. Edinburgh, University of Edinburgh.
- Ekau, W. & B. A. Knoppers. 1999. An introduction to the pelagic system of the North-East and East Brazilian shelf. Archive of Fishery and Marine Research, 47: 113-132.
- Excoffier, L., P. E. Smouse & J. M. Quattro. 1992. Analysis of molecular variance inferred from metric distances among DNA haplotypes: application to human mitochondrial DNA restriction data. Genetics, 131: 479-491.
- Excoffier, L., G. Laval & S. Schneider. 2005. Arlequin (version 3.0): an integrated software package for population genetic data analysis. Evolutionary Bioinformatics Online, 1: 47-50.
- Felsenstein, J. 1985. Confidence limits on phylogenies: an approach using the bootstrap. Evolution, 39: 783-791.
- Fernández Iriarte, P. J., M. P. Alonso, D. E. Sabadin, P. A. Arauz & C. M. Iudica. 2011. Phylogeography of weakfish Cynoscion guatucupa (Perciformes: Sciaenidae) from the southwestern Atlantic. Scientia Marina, 75: 701-706.
- Freitas Netto, R., A. G. A. Nunes & J. Albino. 2002. A pesca realizada na comunidade de pescadores artesanais de Santa Cruz/ES - Brasil. Boletim do Instituto de Pesca, São Paulo, 28: 93-100.
- Fu, Y. -X. 1997. Statistical tests of neutrality of mutations against population growth, hitchhiking and background selection. Genetics, 147: 915-925.
- García, G., G. Martínez, S. Retta, V. Gutiérrez, J. Vergara & M. M. Azpelicueta. 2011. Multidisciplinary identification of clupeiform fishes from the Southwestern Atlantic Ocean. International- Journal of Fisheries and Aquaculture, 2: 42-53.
- García, G., J. Vergara, & V. Gutiérrez. 2008. Phylogeography of the Southwestern Atlantic menhaden genus Brevoortia (Clupeidae, Alosinae). Marine Biology, 155: 325-336.
- Garcia Júnior, J., L. F. Mendes, C. L. S. Sampaio & J. E. Lins. 2010. Biodiversidade marinha da Bacia Potiguar: ictiofauna. Rio de Janeiro, Museu Nacional, 195p. (Série Livros, 38).
- Gomes, I. D. & F. G. Araújo. 2004. Reproductive biology of marine catfishes (Siluriformes, Ariidae) in the Sepetiba Bay, Brazil. Revista de Biología Tropical, 52: 143-156.
- Grant, W. S. & B. W. Bowen. 2006. Living in a tilted world: climate change and geography limit speciation in Old World anchovies (Engraulis ; Engraulidae). Biological Journal of the Linnean Society, 88: 673-689.
- Grodsky, S. A., G. Reverdin, J. A. Carton & V. J. Coles. 2014. Year-to-year salinity changes in the Amazon plume: Contrasting 2011 and 2012 Aquarius/SACD and SMOS satellite data. Remote Sensing of Environment, 140: 14-22.
- Guidon, S., J. -F. Dufayard, V. Lefort, M. Anisimova, W. Hordijk & O. Gascuel. 2010. New algorithms and methods to estimate maximum-likelihood phylogenies: assessing the performance of PhyML 3.0. Systematic Biology, 59: 307-321.
- Hall, T. A. 1999. BioEdit: a user-friendly biological sequence alignment editor and analysis program for Windows 95/98/NT. Nucleic Acids Symposium Series, 41: 95-98.
- Hauser, L. & G. R. Carvalho. 2008. Paradigm shifts in marine fisheries genetics: ugly hypotheses slain by beautiful facts. Fish and Fisheries, 9: 333-362.
- Hewitt, G. M. 1996. Some genetic consequences of ice ages, and their role in divergence and speciation. Biological Journal of the Linnean Society, 58: 247-276.
- Hu, C., E. T. Montgomery, R. W. Schmitt & F. E. Muller-Karger. 2004. The dispersal of the Amazon and Orinoco River water in the tropical Atlantic and Caribbean Sea: observation from space and S-PALACE floats. Deep Sea Research II, 51: 1151-1171.
- IBAMA. 2007. Estatística da pesca 2005. Brasil: grandes regiões e unidades da Federação. Brasília, D.F., 108p.
- IBAMA. 2008. Estatística da pesca 2006. Brasil: grandes regiões e unidades da Federação. Brasília, D.F., 180p.
- International Commission of Zoological Nomenclature [ICZN]. 1999. International Code of Zoological Nomenclature[4th ed.]. London, The International Trust for Zoological Nomenclature, Natural History Museum.
- Isaac-Nahum, V. J. 2006. Explotação e manejo dos recursos pesqueiros do litoral Amazônico: um desafio para o futuro. Ciência e Cultura, 58: 33-36.
- International Union for conservation of Nature (IUCN). 2015. The IUCN Red List of Threatened Species. Version 2015.2. Available from: Available from: http://www.iucnredlist.org (23 June 2015).
» http://www.iucnredlist.org - Kimura, M. 1980. A simple method for estimating evolutionary rates of base substitutions through comparative studies of nucleotide sequences. Journal of Molecular Evolution, 16: 111-120.
- Kjerfve, B. & L. D. Lacerda. 1993. Mangroves of Brazil. Pp. 245-272. In: Lacerda, L. D. (Coord.). Conservation and sustainable utilization of mangrove forests in Latin America and Africa regions. Okinawa, Japan, International Society for Mangrove Ecosystems (ISME); Yokohama, Japan, International Tropical Timber Organization (ITTO). (Mangrove ecosystems technical reports, v. 2).
- Knoppers, B., P. R. P. Medeiros, W. F. L. Souza & T. Jennerjahn. 2005. The São Francisco Estuary, Brazil. Pp. 51-70. In: Wangersky, P. (Ed.). The Handbook of Environmental Chemistry, Berlin, Springer Verlag. v. 5: water pollution: estuaries.
- Knowlton, N., L. A. Weigt, L. A. Solorzano, D. K. Mills & E. Bermingham. 1993. Divergence in proteins, mitochondrial DNA, and reproductive compatibility across the Isthmus of Panama. Science, New Series, 260: 1629-1632.
- Lambeck, K. & J. Chappell. 2001. Sea level change through the last glacial cycle. Science, 292: 679-686.
- Le Bail, P. -Y., R. Covain, M. Jégu, S. Fisch-Muller, R. Vigouroux & P. Keith. 2012.Updated checklist of the freshwater and estuarine fishes of French Guiana.Cybium, 36: 293-319.
- Le Bail, P. -Y., P. Keith & P. Planquette. 2000.Atlas des poissons d'eau douce de Guyane. Paris, Muséum National d´Histoire Naturelle, Concil Supérieur de la Pêche, INRA-Institut National de la Recherche Agronomique. t. 2, fascícule 2: Siluriformes. (Collection du patrimoine naturel, 43).
- Lessios, H. A. 2008. The great American schism: Divergence of marine organisms after the rise of the Central American Isthmus. Annual Review of Ecology, Evolution, and Systematics, 39: 63-91.
- Lentz, S. J. 1995. Seasonal variations in the horizontal structure of the Amazon Plume inferred from historical hydrographic data.Journal of Geophysical Research, 100: 2391-2400.
- Librado, P. & J. Rozas. 2009. DnaSP v5: a software for comprehensive analysis of DNA polymorphism data. Bioinformatics, 25: 1451-1452.
- Lodge, D. M. 1993. Biological invasions: lessons for ecology. Trends in Ecology & Evolution, 8: 133-137.
- Lopes, R. G., A. R. G. Tomás, S. L. S. Tutui, E. S. Rodrigues & A. Puzzi. 2002. Fauna acompanhante da pesca camaroeira no litoral do estado de São Paulo, Brasil. Boletim do Instituto de Pesca, São Paulo,28: 173-188.
- Ludt, W. B. & L. A. Rocha. 2015. Shifting seas: the impacts of Pleistocene sea-level fluctuations on the evolution of tropical marine taxa. Journal of Biogeography, 42: 25-38.
- Luiz, O. J., J. S. Madin, D. R. Robertson, L. A. Rocha, P. Wirtz & S. R. Floeter. 2012. Ecological traits influencing range expansion across large oceanic dispersal barriers: insights from tropical Atlantic reef fishes. Proceedings of the Royal Society Biological Sciences, 279: 1033-1040.
- Mahiques, M. M., S. H. M. Sousa, V. V. Furtado, M. G. Tessler, F. A. L. Toledo, L. Burone, R. C. L. Figueira, D. A. Klein, C. C. Martins & D. P. V. Alves. 2010. The southern Brazilian shelf: general characteristics, quaternary evolution and sediment distribution. Brazilian Journal of Oceanography, 58: 25-34.
- Maia, L. P., L. D. Lacerda, L. H. U. Monteiro & G. M. Souza. 2006. Atlas dos Manguezais do Nordeste do Brasil: avaliação das áreas de manguezais dos estados do Piauí, Ceará, Rio Grande do Norte, Paraíba e Pernambuco. Fortaleza, ISME-BR, Instituto de Ciências do Mar, UFCE, ABCC, 49p.
- Marceniuk, A. P. 2007. Revalidação de Cathorops arenatus (Valenciennes, 1840) e Cathorops agassizii (Eigenmann & Eigenmann, 1888) (Siluriformes, Ariidae), bagres marinhos das regiões norte e nordeste da América do Sul. Iheringia, Série Zoologia, 97: 360-375.
- Marceniuk, A. P., R. Betancur, T. Giarrizzo, F. L. Fredou & S. Knudsen. 2015. Bagre bagre . The IUCN Red List of Threatened Species, 2015, e.T190228A1945010. Available from: Available from: http://dx.doi.org/10.2305/IUCN.UK.2015-2.RLTS.T190228A19450.en (15 May 2016).
» http://dx.doi.org/10.2305/IUCN.UK.2015-2.RLTS.T190228A19450.en - Marceniuk, A. P. & N. A. Menezes. 2007. Systematics of the family Ariidae (Ostariophysi, Siluriformes), with a redefinition of the genera. Zootaxa, 1416: 1-126.
- Mendes, F. L. S. & R. B. Barthem. 2010. Hábitos alimentares de bagres marinhos (Siluriformes: Ariidae) do estuário amazônico.Amazônia: Ciência & Desenvolvimento, Belém, 5: 153-166.
- Miller, K. G., M. A. Kominz, J. V. Browning, J. D. Wright, G. S. Mountain, M. E. Katz, P. J. Sugarman, B. S. Cramer, N. Christie-Blick & S. F. Pekar. 2005. The Phanerozoic record of global sea-level change. Science, 310: 1293-1298.
- Mishima, M. & S. Tanji. 1983. Maturação e desova dos bagres marinhos (Osteichthyes, Ariidae) do complexo estuarino lagunar de Cananéia (25°S, 48°W). Boletim do Instituto de Pesca, 10: 129-141.
- Muehe, D. & D. S. Garcez. 2005. A plataforma continental brasileira e sua relação com a zona costeira e a pesca. Mercator Revista de Geografia da UFC, 4: 69-88.
- Nei, M. 1987. Molecular evolutionary genetics. New York, Columbia University Press, 512p.
- Pampoulie, C., E. S. Gysels, G. E. Maes, B. Hellemans, V. Leentjes, A. G. Jones & F. A. M. Volckaert. 2004. Evidence for fine-scale genetic structure and estuarine colonisation in a potential high gene flow marine goby (Pomatoschistus minutus ). Heredity, 92: 434-445.
- Pereira, A. N., A. Márquez, M. Marin & Y. Marin. 2009. Genetic evidence of two stocks of the whitemouth croaker Micropogonias furnieri in the Río de la Plata and oceanic front in Uruguay. Journal of Fish Biology, 75: 321-331
- Pereyra, S., G. García, P. Miller, S. Oviedo & A. Domingo. 2010. Low genetic diversity and population structure of the narrownose shark (Mustelus schmitti ). Fisheries Research, 106: 468-473.
- Pillans, B., J. Chappell & T. R. Naish. 1998. A review of the Milankovitch climatic beat: template for Plio-Pleistocene sea-level changes and sequence stratigraphy. Sedimentary Geology, 122: 5-21.
- Pinheiro, L. A. & F. L. Frédou. 2004. Caracterização geral da pesca industrial desembarcada no estado do Pará. Revista Cientifica da UFPA, 4. Disponível em: http://www.ufpa.br/revistaic
» http://www.ufpa.br/revistaic - Pinheiro, P., M. K. Broadhurst, F. H. V. Hazin, T. Bezerra & S. Hamilton. 2006. Reproduction in Bagre marinus (Ariidae) off Pernambuco, northeastern Brazil. Journal of Applied Ichthyology, 22: 189-192.
- Rabassa, J., A. M. Coronato & M. Salemme. 2005. Chronology of the Late Cenozoic Patagonian glaciations and their correla tion with biostratigraphic units of the Pampean region (Argen tina). Journal of South American Earth Sciences, 20: 81-103.
- Rambaut, A. & A. J. Drummond. 2009. Tracer v.1.5. Available from: Available from: http://beast.bio.ed.ac.uk/LogCombiner (9 July 2015).
» http://beast.bio.ed.ac.uk/LogCombiner - Riker, S. R. L, F. J. C Lima & M. B. Motta. 2015. Evidências de glaciação Pleistocênica na Amazônia Brasileira. In: Simpósio de Geologia da Amazônia, 14. Marabá-PA, 2015. Anais... Marabá-PA, Sociedade Brasileira de Geologia..
- Rimmer, M. 1985. Reproductive cycle of the fork-tailed catfish Arius graeffei Kner & Steindachner (Pisces: Ariidae) from the Clarence River, New South Wales. Australian Journal of Marine and Freshwater Research, 36: 23-32.
- Rocha, L. A., A. L. Bass, D. R. Robertson & B. W. Bowen. 2002. Adult habitat preferences, larval dispersal, and the comparative phylogeography of three Atlantic surgeonfishes (Teleostei: Acanthuridae). Molecular Ecology, 11: 243-252.
- Ronquist, F. & J. P. Huelsenbeck. 2003. Mr Bayes 3: Bayesian phylogenetic inference under mixed models. Bioinformatics, 19: 1572-1574.
- Ruzzante, D. E., S. J. Walde, J. C. Gosse, V. E. Cussac, E. Habit, T. S. Zemlak & E. D. M. Adams. 2008. Climate control on ancestral population dynamics: insight from Patagonian fish phylogeography. Molecular Ecology, 17: 2234-2244.
- Salzburger, W., G. B. Ewing & A. von Haeseler. 2011. The performance of phylogenetic algorithms in estimating haplotype genealogies with migration. Molecular Ecology, 20: 1952-1963.
- Sambrook, J. & D. W. Russell. 2001. Molecular cloning: a laboratory manual. 3rd ed. New York, Cold Spring Harbor Laboratory, Press, 3v.
- Santos, S., T. Hrbek, I. P. Farias, H. Schneider & I. Sampaio. 2006. Population genetic structuring of the king weakfish, Macrodon ancylodon (Sciaenidae), in Atlantic coastal waters of South America: deep genetic divergence without morphological change. Molecular Ecology, 15: 4361-4373.
- Schaeffer-Novelli, Y., G. Cintrón-Molero, R. R. Adaime & T. M. Camargo. 1990. Variability of mangrove ecosystems along the Brazilian coast. Estuaries, Lawrence, 13: 204-218.
- Sprechmann, P. 1978. The paleoecology and paleogeography of the Uruguayan coastal area during the Neogene and Quaternary. Zitteliana, 4: 3-72.
- Stepien, C. A., R. H. Rosenblatt & B. A. Bargmeyer. 2001. Phylogeography of the spotted sand bass, Paralabrax maculatofasciatus: divergence of Gulf of California and Pacific coast populations. Evolution, 55: 1852-1862.
- Stramma, L., Y. Ikeda & R. G. Peterson. 1990. Geostrophic transport in the Brazil current region north of 20°S. Deep-Sea Research, 37: 1875-1886.
- Tajima, F. 1989. Statistical method for testing the neutral mutation hypothesis by DNA Polymorphism. Genetics, 123: 585-595.
- Thompson, J. D., T. J. Gibson, F. Plewniak, F. Jeanmougin & D. G. Higgins. 1997. The CLUSTAL_X windows interface: flexible strategies for multiple sequence alignment aided by quality analysis tools. Nucleic Acids Research, 25: 4876-4882.
- Villwock, J. A., G. C. Lessa, K. Suguio, R. J. Angulo & S. R. Dillenburg. 2005. Geologia e geomorfologia de regiões costeiras. Pp. 94-113. In: Souza, C. R. G., K. Suguio, A. M. S. Oliveira & P. E. Oliveira (Eds.). Quaternário do Brasil. Ribeirão Preto, SP, Holos, Editora.
- Weir, B. S. & W. G. Hill. 2002. Estimating F-Statistics. Annual Review of Genetics, 36: 721-750.
- Yule, G. U. 1924. A mathematical theory of evolution, based on the conclusions of Dr. J. C. Willis, F. R. S. Philosophical Transactions of the Royal Society of London, Biology, 213: 21-87.
APPENDIX 1
Publication Dates
-
Publication in this collection
2016
History
-
Received
11 Nov 2015 -
Accepted
02 Mar 2016