
ABSTRACT
The purpose of this research was to investigate differences in diet composition between Achirus mazatlanus and Syacium ovale, two flatfishes inhabiting in a tropical coastal lagoon and to investigate the relationship of their feeding habits to size, body morphometry and mouths characteristics. Fish were collected during sampling trips conducted regularly from 2011 to 2016 using several types of fishing gear. Total number of analyzed stomachs with some food content was 328 for Achirus mazatlanus from 1.4 to 21.3 cm total length (TL) and 203 for Syacium ovale with 1.3 to 24.0 cm TL. Results indicate that both species share a general diet based on benthic invertebrates and fishes but S. ovale has a more piscivorous habit, which can be explained by a more slender body shape and larger teeth, characteristics which increase prey fish catching performance. Important changes in composition of food categories related to size were not found for any species, but larger fish of both species eat larger ranges of prey sizes, and this ontogenetic change is consistent with recent developments on optimal foraging theory.
Keywords:
Estuarine habitat; Feeding; Ontogenic changes; Pleuronectiformes; Trophic morphology
RESUMEN
Se investigaron las diferencias en la composición de la dieta entre Achirus mazatlanus y Syacium ovale, dos especies de lenguados que habitan en una laguna costera tropical, y la relación de los hábitos alimentarios con el largo total, la morfometría corporal y las características de las bocas. Los peces fueron colectados regularmente entre 2011 y 2016, mediante varios tipos de artes de pesca diferentes. El número total de estómagos analizados con contenido estomacal fue de 328 para Achirus mazatlanus de 1.4 a 21.3 cm de longitud total (TL) y 203 para Syacium ovale de 1.3 a 24.0 cm TL. Los resultados indican que ambas especies tienen una dieta general basada en invertebrados bentónicos y peces, pero S. ovale tiene un hábito más piscívoro, lo cual puede ser explicado por un cuerpo más alargado y dientes más grandes, características ambas que incrementan el rendimiento de la captura de peces presas. No se encontraron cambios importantes en la composición de las categorías alimentarias relacionados con la talla en ninguna de las especies de lenguados, pero los peces mayores de ambas especies consumen rangos más amplios de tamaños de presas y este cambio ontogénico es consistente con la teoría de forrajeo óptimo.
Palabras clave:
Alimentación; Cambios ontogénicos; Hábitat estuarino; Morfología trófica; Pleuronectiformes
INTRODUCTION
Flatfishes are common species in most tropical marine fish assemblages, especially those found on soft-bottom habitats in estuaries and on a variety of substrata on the inner continental shelf (Munroe, 2015Munroe TA. Tropical flatfish fisheries, In: Gibson RN, Nash RD, Geffen AJ, Van der Veer HW, editors. Flatfishes: biology and exploitation. Oxford: John Wiley & Sons ; 2015. p.418-60.). Species of this group serve as major energy pathways for conversion of benthic production into a form suitable for consumption by higher predators and humans. As such, flatfishes are critical components of benthic communities and any understanding of marine benthic ecosystems needs to incorporate trophic dynamics of flatfishes (Link et al., 2015Link JS, Smith BE, Packer DB, Fogarty MJ, Langton RW. The trophic ecology of flatfishes. In: Gibson RN, Nash RDM, Geffen AJ, van der Veer HW, editors. Flatfishes: biology and exploitation. Oxford: John Wiley & Sons ; 2015. p.283- 313.). With their similarity in body shape and distinct preference for the benthic layer, flatfish may be more similar in their habits and environmental demands than are other fish (Piet et al., 1998Piet GJ, Pfisterer AB, Rijnsdorp AD. On factors structuring the flatfish assemblage in the southern North Sea. J Sea Res . 1998; 40(1-2):143-52. https://doi.org/10.1016/S1385-1101(98)00008-2
https://doi.org/10.1016/S1385-1101(98)00...
). These features support a potential competition for resources, including food, as a driving factor shaping flatfish assemblages.
The Pacific lined sole, Achirus mazatlanus (Steindachner, 1869) from the family Achiridae and the Oval flounder, Syacium ovale (Günther, 1864) from the family Paralichthydae, are two flatfish species, reported for Eastern Tropical Pacific (Robertson, Allen, 2015Robertson DR, Allen GR. Shorefishes of the Tropical Eastern Pacific online information system [Internet]. Balboa: Smithsonian Tropical Research Institute; 2015. Available from: https://biogeodb.stri.si.edu/sftep/es/pages
https://biogeodb.stri.si.edu/sftep/es/pa...
) and recent studies in Barra de Navidad lagoon have identified these two species as regular components of the ichthyofauna and they are the most abundant flatfishes in this estuarine system (González-Sansón et al., 2014aGonzález-Sansón G, Aguilar-Betancourt C, Kosonoy-Aceves D, Lucano-Ramírez G, Ruiz-Ramírez S, Flores-Ortega JR, Hinojosa-Larios A, Silva-Bátiz FA. Species and size composition of fishes in Barra de Navidad lagoon, Mexican central Pacific. Rev Biol Trop. 2014a; 62(1):129-44. https://doi.org/10.15517/rbt.v62i1.10001G
https://doi.org/10.15517/rbt.v62i1.10001...
, 2014bGonzález-Sansón G, Aguilar-Betancourt C, Kosonoy-Aceves D, Lucano-Ramírez G, Ruiz-Ramírez S, Flores-Ortega JR, Silva-Bátiz F. Weight-length relationships for 38 fish species of Barra de Navidad coastal lagoon, Jalisco, Mexico. J Appl Ichthyol. 2014b; 30(2):428-30. https://doi.org/10.1111/jai.12327
https://doi.org/10.1111/jai.12327...
, 2016González-Sansón G, Aguilar-Betancourt C, Kosonoy-Aceves D, Lucano-Ramírez G, Ruiz-Ramírez S, Flores-Ortega JR. Spatial and temporal variations of juvenile fish abundance in Barra de Navidad coastal lagoon, Jalisco, México: Effects of hurricane Jova. Rev Biol Mar Oceanogr. 2016; 51(1):123-36. https://doi.org/10.4067/S0718-19572016000100012
https://doi.org/10.4067/S0718-1957201600...
). Information on feeding habits of these species is very scarce. Amezcua-Linares et al. (1992Amezcua-Linares F, Castillo-Rodríguez ZG, Alvarez-Rubio M. Alimentación y reproducción del sol Achirus mazatlanus (Steindachner, 1869) en el sistema lagunar costero de Agua Brava, Pacífico de México. Ann Inst Bio. 1992; 19(2):181-94.) investigated the diet of A. mazatlanus in a Mexican coastal lagoon and found polychaetes and amphipods as main alimentary items. No published information could be found on feeding habits of S. ovale in estuarine habitats, but Flores-Ortega et al. (2013Flores-Ortega JR, Godínez-Domínguez E, González-Sansón G, Rojo-Vázquez JA, López-Prado AC, Morales-Jauregui MY. Abundancia, distribución, hábitos alimentarios e interacciones tróficas de cinco especies de lenguados (Pleuronectiformes) en el Pacífico central mexicano. Lat Am J Aquat Res. 2013; 41(3):423-39. Available from: https://scielo.conicyt.cl/pdf/lajar/v41n3/art06.pdf
https://scielo.conicyt.cl/pdf/lajar/v41n...
) reported that main food items of this species in Bay of Navidad, Mexico, were crustaceans with a much lesser representation of fishes and polychaetes.
The coexistence of two flatfish species which have much the same benthic habit poses an important research question related to trophic niche overlap and the role played by morphological differences among these species in relation to potential competition for food. No clear answer seems to be possible without specific research on this topic as previous work found different scenarios in relation to diet overlap and the role of competition for food. Piet et al. (1998Piet GJ, Pfisterer AB, Rijnsdorp AD. On factors structuring the flatfish assemblage in the southern North Sea. J Sea Res . 1998; 40(1-2):143-52. https://doi.org/10.1016/S1385-1101(98)00008-2
https://doi.org/10.1016/S1385-1101(98)00...
) found strong circumstantial evidence that interspecific competition is a major factor structuring the flatfish assemblage. Garrison, Link (2000aGarrison LP, Link JS. Fishing effects on spatial distribution and trophic guild structure of the fish community in the Georges Bank region. ICES J Mar Sci. 2000a; 57(3):723-30. https://doi.org/10.1006/jmsc.2000.0713
https://doi.org/10.1006/jmsc.2000.0713...
, 2000bGarrison LP, Link JS. Dietary guild structure of the fish community in the Northeast United States continental shelf ecosystem. Mar Ecol Prog Ser. 2000b; 202:231-40. https://doi.org/10.3354/meps202231
https://doi.org/10.3354/meps202231...
) point to small changes in consumed preys, differences in feeding morphology, and ontogenic shifts in diets as factors that can alleviate competition among flatfishes. After Guedes, Araújo (2008Guedes APP, Araújo FG. Trophic resource partitioning among five flatfish species (Actinopterygii, Pleuronectiformes) in a tropical bay in south‐eastern Brazil. J Fish Biol. 2008; 72(4):1035-54. https://doi.org/10.1111/j.1095-8649.2007.01788.x
https://doi.org/10.1111/j.1095-8649.2007...
) the high item diversity used by flatfishes indicates that the studied system plays an important role as a feeding ground, and that interspecific competition for food was unlikely.
De Groot (1971De Groot SJ. On the interrelationships between morphology of the alimentary tract, food and feeding behaviour in flatfishes (Pisces: Pleuronectiformes). J Sea Res. 1971; 5(2):121-96. https://doi.org/10.1016/0077-7579(71)90008-1
https://doi.org/10.1016/0077-7579(71)900...
) classified the Pleuronectiformes into three groups after their feeding characteristics, namely i) fish feeders; ii) crustacean feeders; iii) polychaete-mollusc feeders. More recently, a global summary presented by Link et al. (2015Link JS, Smith BE, Packer DB, Fogarty MJ, Langton RW. The trophic ecology of flatfishes. In: Gibson RN, Nash RDM, Geffen AJ, van der Veer HW, editors. Flatfishes: biology and exploitation. Oxford: John Wiley & Sons ; 2015. p.283- 313.) indicates that, in general, flatfishes feed on worms, small crustaceans, fishes, and squid, with a few specialist feeders (e.g., echinoderms or bivalve siphons). Research done on feeding habits of flatfishes in American tropical and subtropical sites provide strong evidence of some species with mixed diets including fishes and invertebrates (Amezcua-Linares et al., 1992Amezcua-Linares F, Castillo-Rodríguez ZG, Alvarez-Rubio M. Alimentación y reproducción del sol Achirus mazatlanus (Steindachner, 1869) en el sistema lagunar costero de Agua Brava, Pacífico de México. Ann Inst Bio. 1992; 19(2):181-94.; Chaves, Serenato, 1998Chaves PTC, Serenato A. Diversidade de dietas na assembléia de linguados (Teleostei, Pleuronectiformes) do manguezal da Baía de Guaratuba, Paraná, Brasil. Rev Bras Oceanogr. 1998; 46(1):61-68. http://dx.doi.org/10.1590/S1413-77391998000100005
http://dx.doi.org/10.1590/S1413-77391998...
; Lunardon-Branco, Branco, 2003Lunardon-Branco MJ, Branco JO. Alimentação natural de Etropus crossotus Jordan & Gilbert (Teleostei, Pleuronectiformes, Paralichthyidae), na Armação do Itapocoroy, Penha, Santa Catarina. Brasil Rev Bras Zool. 2003; 20(4):631-35. http://dx.doi.org/10.1590/S0101-81752003000400012
http://dx.doi.org/10.1590/S0101-81752003...
).
The hypothesis guiding this research was that two sympatric species of flatfishes living in an estuarine system feed on a common base of food resources formed by invertebrates and small fishes and therefore, some niche overlap should be expected in terms of general diet composition. However, changes in the feeding niche with size and differences in some morphological traits among species explain observed differences in diet composition and may contribute to facilitate their coexistence in the same estuarine system.
MATERIAL AND METHODS
Study area was located at Barra de Navidad lagoon in the Pacific coast of Mexico (19°11′25″N, 104°39′53″W). The lagoon´s surface is 3.76 km3 and has a permanent inlet communicating with the sea. Freshwater input is strongly seasonal due to a well defined rainfall pattern characterized by a rainy season, from June to October and a dry season, from November to May (González-Sansón et al., 2016González-Sansón G, Aguilar-Betancourt C, Kosonoy-Aceves D, Lucano-Ramírez G, Ruiz-Ramírez S, Flores-Ortega JR. Spatial and temporal variations of juvenile fish abundance in Barra de Navidad coastal lagoon, Jalisco, México: Effects of hurricane Jova. Rev Biol Mar Oceanogr. 2016; 51(1):123-36. https://doi.org/10.4067/S0718-19572016000100012
https://doi.org/10.4067/S0718-1957201600...
). The lagoon was categorized as III-A(III-B) by Lankford (1977Lankford RR. Coastal lagoons of Mexico: their origin and classification. In: Wiley M, editor. Estuarine processes - Circulation, Sediments, and Tranfer of Material in the Estuary. New York: Academic Press; 1977. p.182-215.), which means waves and coastal currents dominate its formation. It is primarily euhaline (salinity 30-40), although it can be mixopolyhaline (salinity 18-30) for short periods during the rainy season (González-Sansón et al., 2014a).
Fish were collected from 2011 to 2016. Sampling gear included a beach purse seine (10 m long, 1 cm mesh size), a cast net (3 m, 2.5 cm mesh size) and four gill nets (60 m each) of different mesh sizes (7.0, 7.6, 8.9 and 10.2 cm). Purse seine and cast nets were used during the day. Gill nets were deployed from dusk to dawn and checked every three hours. The use of several fishing gears reduced the inherent bias in length composition due to selectivity and allowed to obtain fish with a wide range of lengths. Sampled fish were put in ice immediately after the catch and taken to the laboratory where they were identified and their total lengths (TL) were measured. Stomachs were removed and contents preserved in 70% ethanol for later identification. Voucher specimens of each species were deposited in University of Guadalajara´s fish collection (UDGCP), located at the Department of Studies for the Sustainable Development of the Coastal Zone, Gómez Farías 82, 48980 San Patricio-Melaque, Jalisco, Mexico. (Achirus mazatlanus: UDGPC6600; Syacium ovale: UDGPC6660).
Each food item in stomach contents was identified to the lowest possible taxonomic level, based on specialized literature (Hendrickx, 1996Hendrickx ME. Los camarones Penaeoidea bentónicos (Crustacea: Decápoda: Dendrobranchiata) del Pacífico mexicano. México: CONABIO; 1996.; Martínez-Iglesias et al., 1996Martínez-Iglesias JC, Ríos R, Carvacho A. Las especies del género Alpheus (Decapoda: Alpheidae) de Cuba. Rev Biol Trop . 1996; 44(3)/45(1):401-29. and García-Madrigal, Andréu-Sánchez, 2009García-Madrigal MS, Andréu-Sánchez LI. Los cangrejos porcelánidos (Decapoda: Anomura) del Pacífico sur de México, incluyendo una lista y clave de identificación para todas las especies del Pacífico oriental tropical. Ciencia y Mar. 2009; (39):23-54.) or recorded as unidentifiable, using a dissecting microscope. High taxa are given after Fisher et al. (1995Fisher W, Krupp F, Schneider W, Sommer C, Carpenter KE, Niem VH. Guía FAO para la identificación de especies para los fines de la pesca: Pacifico Centro-Oriental. Roma; FAO; 1995.) and valid species names after WoRMS (2019BWorld Register of Marine Species [Internet]. Belgim: WoRMS; 2019. Available from http://www.marinespecies.org
http://www.marinespecies.org...
). In all cases where the degree of digestion allowed it, each item was measured to the nearest 0.1 mm. Prey total length (PTL) was used for shrimp and fish, while the carapace width (Cw) was measured in crabs. Food items were weighed using an Ohaus balance. Sufficiency of the number of sampled stomachs to describe the diet, was assessed using cumulative curves of trophic diversity, which were computed with EstimateS software (Colwell, 2013Colwell RK. EstimateS: Statistical estimation of species richness and shared species from samples. User’s Guide and application. Version 9 [Internet]. Storrs; 2013. Available from: http://purl.oclc.org/estimates
http://purl.oclc.org/estimates...
) based on 100 randomizations without replacement to ensure that the curves really reached an asymptotic value. For this purpose, the cumulative value of the Shannon index (H’, Magurran, 2004Magurran AE. Measuring biological diversity. Oxford: Blackwell Science Ltd.; 2004.) was plotted against the cumulative number of stomachs examined (Figueiredo et al., 2005Figueiredo M, Morato T, Barreiros JP, Afonso P, Santos RS. Feeding ecology of the white seabream, Diplodus sargus, and the ballan wrasse, Labrus bergylta, in the Azores. Fish Res. 2005; 75(1-3):107-19. https://doi.org/10.1016/j.fishres.2005.04.013
https://doi.org/10.1016/j.fishres.2005.0...
). Each diversity curve was considered asymptotic if at least two previous values to the total sample trophic diversity (H’tot) were in the range H’tot± 0.05H’tot (Alonso et al., 2002Alonso MK, Crespo EA, García NA, Pedraza SN, Mariotti PA, Mora NJ. Fishery and ontogenetic driven changes in the diet of the spiny dogfish, Squalus acanthias, in Patagonian waters, Argentina. Environ Biol Fishes. 2002; 63(2):193-202. https://doi.org/10.1023/A:1014229432375
https://doi.org/10.1023/A:1014229432375...
). For further analyses, food items were pooled into food categories, using the family as the reference level. The relative importance of each food category in the diet was expressed as percentage of numerical abundance (N%), frequency of occurrence of food items in stomachs (F%), and weight (W%) following Hyslop (1980Hyslop EJ. Stomach contents analysis - a review of methods and their application. J Fish Biol . 1980; 17(4):411-29. https://doi.org/10.1111/j.1095-8649.1980.tb02775.x
https://doi.org/10.1111/j.1095-8649.1980...
). The prey-specific index of relative importance (PSIRI) developed by Brown et al. (2012Brown SC, Bizzarro JJ, Cailliet GM, Ebert DA. Breaking with tradition: redefining measures for diet description with a case study of the Aleutian skate Bathyraja aleutica (Gilbert 1896). Environ Biol Fishes . 2012; 95(1):3-20. https://doi.org/10.1007/s10641-011-9959-z
https://doi.org/10.1007/s10641-011-9959-...
) was calculated using the following equation:
where: %PSIRIi = PSIRI for prey i, expressed as percentage, %FOi = Frecuency of ocurrency for prey i, expressed as percentage, %PNi = Prey-specific numerical abundance for prey i, expressed as percentage, %PWi = Prey-specific weight abundance for prey i, expressed as percentage.
To analyze ontogenetic changes in diet composition, fish were grouped into three size classes based on their total length as follows: size class 1, TL less than 10 cm; size class 2, TL equal or higher than 10 cm and equal or less than 15 cm; and size class 3, TL higher than 15 cm. Fish with TL below 10 cm were considered juvenile based on the maturation lengths provided for both species by FishBase (Froese, Pauly, 2019Froese R, Pauly D. FishBase. World Wide Web electronic publication. 2019. Available from: http://www.fishbase.org
http://www.fishbase.org...
). These juvenile, however, shared the same distribution area with adults and for that reason our analyses emphasize the change of diet with size.
For morphological analyses standard length (SL), maximum body height (BH), peduncle height (PH), mouth width (MW) and mouth height (MH) were measured to the nearest millimeter in a subsample of 25 individuals. Gape area (GA) was calculated assuming an elliptical form using the formula GA = (3.1416 * MW * MH)/2 (Fig. 1). All measures were expressed as ratios with respect to SL. Ratios were multiplied by convenient factors to avoid decimal zeros.
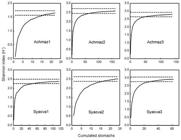
| Cumulative curves of food items diversity (Shannon´s index). Achmaz: Achirus mazatlanus; Syaova: Syacium ovale; Numbers indicate size classes: 1 for LT < 10 cm; 2 for LT ≥ 10 cm and LT ≤ 15 cm; 3 for LT > 15 cm. Dashed lines indicate the interval H´max ± 0.05*H´max.
All numerical analyses related to niche breadth and overlap were performed on W% values because we are primarily interested in future assessment of energy flow in the food web of the lagoon (Hansson, 1998Hansson S. Methods of studying fish feeding: a comment. Can J Fish Aquat Sci. 1998; 55(12):2706-07. https://doi.org/10.1139/f98-158
https://doi.org/10.1139/f98-158...
). Similarities of diet compositions for all pairs of species-size classes groups were analyzed using numerical classification based on the Bray-Curtis index of similarity and UPGMA cluster algorithm. A SIMPROF test (Clarke et al., 2008Clarke KR, Somerfield PJ, Gorley RN. Testing of null hypotheses in exploratory community analyses: similarity profiles and biota-environment linkage. J Exp Mar Bio Ecol. 2008; 366(1-2):56-69. https://doi.org/10.1016/j.jembe.2008.07.009
https://doi.org/10.1016/j.jembe.2008.07....
) was used to assess the significance of groups. To further explore diet relationships, a Principal Coordinate Analysis (PCO) was performed on the same similarity matrix used for classification and a vector overlay was superimposed on the scatterplot of the two first PCO-axes including only food categories with 0.5 or higher values of Spearman correlations with the axes. The relative size and position of the vector overlay on the graph is arbitrary with respect to the underlying plot (Anderson et al., 2008Anderson MJ, Gorley RN, Clarke KR. PERMANOVA+ for PRIMER: A guide to software and statistical methods. Plymouth: PRIMER-E; 2008.) but gives a good summary of the relationships of variables (food categories in our case) with species-size classes groups.
Diet overlap was calculated using Pianka´s index (Gotelli, Graves, 1996Gotelli NJ, Graves GR. Null Models in Ecology. Washington: Smithsonian Institution Press; 1996.). The null hypothesis of no niche overlap was tested using the methodology based in null models as described in Gotelli, Graves (1996Gotelli NJ, Graves GR. Null Models in Ecology. Washington: Smithsonian Institution Press; 1996.). The program ECOSIM v. 7.72 (Gotelli, Entsminger, 2004Gotelli NJ, Entsminger GL. EcoSim: Null models software for ecologists. Version 7.0 [Internet]. Jericho; 2004. Available from: http://garyentsminger.com/ecosim/index.htm
http://garyentsminger.com/ecosim/index.h...
) was used for simulations with 1000 iterations, using resampling algorithm R3 (i.e., retention of niche breadth with zero states reshuffling) and resource states equiprobable. Trophic niche breadth was measured using Smith´s index (Krebs, 1998Krebs CJ. Ecological methodology. São Francisco: Benjamin Cummings; 1998.). This measure was selected because its theoretical distribution is known and confidence intervals can be calculated. Calculations were made using software provided by Krebs (1998Krebs CJ. Ecological methodology. São Francisco: Benjamin Cummings; 1998.).
Significant correlations between prey sizes (PTL or Cw) and fish total lengths (TL) were tested for different prey categories using the Spearman´s rank correlation coefficient (rs). This coefficient was also used to test the significance in general diet composition between species considering that a value not significantly different from zero indicate significant different ranking of food categories in species being compared. One-way fixed effects ANOVAs were used to test for significant differences in mean values of morphological variables between species. Prior to ANOVAs the assumptions of normality and homoscedasticity were checked following the criteria of Underwood (1997Underwood AJ. Experiments in ecology: Their logical design and interpretation using analysis of variance. Cambridge: Cambridge University Press; 1997.). Analyses were made with packages STATISTICA 7.1 (StatSoft, 2006StatSoft, Inc. STATISTICA: Data analysis software system. 2006. Available from: http://www.statsoft.com
http://www.statsoft.com...
) PRIMER 6.0 (Clarke, Gorley, 2006Clarke K, Gorley R. PRIMER version 6: user manual/tutorial. Plymouth: PRIMER-E ; 2006.) and PERMANOVA+ for PRIMER (Anderson et al., 2008Anderson MJ, Gorley RN, Clarke KR. PERMANOVA+ for PRIMER: A guide to software and statistical methods. Plymouth: PRIMER-E; 2008.). Significance level for all tests was α = 0.05.
RESULTS
The total number of analyzed stomachs with some food content was 328 for Achirus mazatlanus from 1.4 to 21.3 cm TL and 203 for Syacium ovale ranging from 1.3 to 24.0 cm TL. Diets of both species were dominated by fish and invertebrates but presented different proportions of major food items (Tab. 1).
| Diet composition of Achirus mazatlanus and Syacium ovale in Barra de Navidad lagoon. W%: percentage weight; N%: percentage number; F%: percentage frequency; P%: percentage of prey-specific index of relative importance (PSIRI). NI=Not identified.
The diet of A. mazatlanus was composed mainly of crustacea (50.5% PSIRI) with an important contribution of fish (28.9% PSIRI) and polychaetes (20.0% PSIRI) with a very low proportion of mollusks (Tab. 1). Crustaceans pertained mostly to five taxa (in descending order of their contributions as % PSIRI): i) Copepoda, which was represented by calanoid copepods (0.4-0.9 mm TL). These were present in large numbers and were relatively frequent; this is the reason for a high value of PSIRI although their contribution in weight was very low; ii) Alpheidae, dominated by Alpheus mazatlanticus Wicksten, 1983 (not measured because partially digested), with a minor contribution of Alpheus pacificus Dana, 1852 (not measured because partially digested); iii) Upogebiidae, represented by Upogebia dawsoni Williams, 1986 (5.5-28 mm TL); iv) Xanthidae, represented by Panopeus sp. (1.2-6.1 mm Cw); and v) Penaeidae, represented by Penaeus californiensis Holmes, 1900 (6.0-7.0 mm TL) and in less proportion Penaeus vannamei Boone, 1931 (14.0 mm LT). In this category there were also included penaeid larvae. Fishes were dominated by species of the family Gobiidae, represented mainly by Ctenogobius manglicola (Jordan, Starks, 1895) (9-35 mm TL) with a smaller proportion of Ctenogobius sagittula (Günther, 1862) (14-90 mm TL), appearing mainly in the higher size group, and a minor contribution of Gobionellus microdon (Gilbert, 1892) (not measured because partially digested). Other fishes present in stomach contents were Heteroconger sp. (Congridae, 70 mm TL) and Anchoa sp. (Engraulidae, 24 mm TL).
The diet of S. ovale was composed mainly of crustaceans (66.5% PSIRI) with an important contribution of fish (33.2% PSIRI) and a very low proportion of mollusks and polychaetes (Tab. 1). Crustaceans pertained mostly to five taxa (in descending order of their contributions as % PSIRI): i) Copepoda, which was represented by calanoid copepods (0.4-0.9 mm TL). As in A. mazatlanus, these crustaceans were present in large numbers and were relatively frequent, yielding a high value of PSIRI although their contribution in weight was very low; ii) Penaeidae, represented by P. californiensis (6.1-25 mm TL) and in less proportion P. vannamei (12.0-13.2 mm LT); iii) Portunidae, represented by Callinectes arcuatus Ordway, 1863 (1.9-14.0 mm Cw); iv) Alpheidae, represented by Alpheus sp. (12.0-25.0 mm TL), A. pacificus (not measured because partially digested) and A. floridanus (20.0 mm TL); and v) Xanthidae, represented by Panopeus sp. (3.7-5.7 Cw). Fishes pertained mostly to three families: i) Gobiidae, represented in similar proportions by C. sagittula (12.0-68.0 mm TL) and C. manglicola (10.0-22.0 mm TL); ii) Mugilidae, represented by Mugil sp. (not measured because partially digested); and iii) Engraulidae, represented by Anchoa sp. (39.0-43.0 mm TL). Other fishes present in stomach contents were Erotelis armiger (Jordan, Richardson, 1895) (Eleotridae, 49.0 mm TL), not identified individuals of Gerreidae (9.0-18.0 TL) and Lutjanus sp. (Lutjanidae, not measured because partially digested). Rank correlation between trophic spectra of the two analyzed species was not significantly different from zero (rs = 0.301, p = 0.105, n = 30) indicating that food composition can be considered different in both species.
Six groups resulted from the combination of species and length classes. In all cases the cumulative curves of food items reached an asymptote, indicating adequate sample sizes for each group (Fig. 1). Numerical classification of the six species-size groups strongly suggests two clusters corresponding to the species although SIMPROF test failed to find them significant (Fig. 2a). The first two axes of PCO explained 75.5% of total variation, resulting in an easily interpretable two dimensional diagram (Fig. 2b). Based on the vector overlay of prey categories it can be concluded that the main food items explaining the ordination of samples along the first axis are four fish families (Engraulidae, Gerreidae, Gobiidae, Mugilidae) and two crustacean categories (Penaeidae, Portunidae) to the right side while polychaetes dominated in the left side of this axis. Both species are well separated along this axis, with A. mazatlanus groups related to polychaetes and S. ovale related to shrimps, crabs and fishes. The second axis showed high positive correlations with three families of crustaceans (Alpheidae, Upogebiidae, Xanthidae) and one fish family (Congridae) while two food categories (Copepoda, not identified fishes) showed negative correlations with this axis. Species-size groups are further separated along this axis, with larger sizes classes predominantly on the positive side and smaller ones on the negative side.
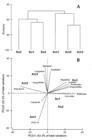
| A. Dendrogram showing the result of numerical classification of stomach contents. B. Principal coordinate analysis plot. Vector overlay shows food categories with Spearman’s correlation values of 0.5 or higher with ordination axes. Data pooled by species (Am: Achirus mazatlanus; So: Syacium ovale) and size classes (1 for LT < 10 cm; 2 for LT ≥ 10 cm and LT ≤ 15 cm; 3 for LT > 15 cm).
Dietary differences found in PCO analysis (Fig. 2b) can be further summarized through a bubble diagram representing the proportion of each food category in each species-size group (Fig. 3) as follows: i) Polychaeta are well represented in all size groups of A. mazatlanus but are almost absent in S. ovale; ii) Penaeidae are important in all size groups of S. ovale but are vestigial in A. mazatlanus; iii) Portunidae are only important in the largest size group of S. ovale; iv) Copepods are present only in the smaller size class of both species; v) The number of fish categories in stomach contents is higher in S. ovale and has its highest value in the largest size group; vi) benthic fishes (gobiids) are the dominant fish category in all cases but more mobile bentho-pelagic fishes (Mugilidae, Lutjanidae, Engraulidae, Eleotridae, Gerreidae), appear only in S. ovale, particularly in the largest size group of this species.

| Representation of selected food categories in groups defined by combinations of species and size groups. Diameters of circles proportional to square roots of percentage in weight. Am: Achirus mazatlanus; So: Syacium ovale; Numbers indicate size classes: 1 for LT < 10 cm; 2 for LT ≥ 10 cm and LT ≤ 15 cm; 3 for LT > 15 cm.
Estimates of Smith’s index (niche breadth) varied from 0.689 to 0.755 for A. mazatlanus and from 0.805 to 0.848 for S. ovale (Fig. 4). Estimates of Pianka’s index (niche overlap) varied between 0.423 and 0.886 (Tab. 2) with mean values within species (A. mazatlanus = 0.724 ± 0.085, n=3; S. ovale = 0.774 ± 0.025, n=3) higher than the mean value among species (0.614 ± 0.045, n=9). Mean observed overlap for all groups was 0.668 ± 0.035 (n=15) and was significantly higher (p=0.001) than mean expected overlap (0.155) yielded by simulation under the null model of no diet overlapping. Variance of overlap values was 0.018 and was not significantly different (p=0.671) with the mean of simulated variance values (0.026) obtained under the null model.
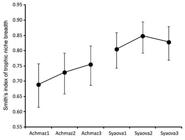
| Estimated values of Smith´s index of niche breadth and 95% confidence intervals (vertical lines). Data pooled by species (Achmaz: Achirus mazatlanus; Syaova: Syacium ovale) and size classes (1: < 10 cm TL; 2: ≥ 10 and ≤ 15 cm TL; 3: > 15 cm TL).
| Pianka’s overlap indices among species size classes. Highlighted values correspond to pairs including size-classes of the same species. Achmaz: Achirus mazatlanus; Syaova: Syacium ovale; 1: < 10 cm TL; 2: ≥ 10 y ≤ 15 mm TL; 3: > 15 mm TL.
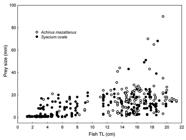
The distribution of prey size vs flatfish size for all food items pooled for both flatfish species was asymmetric, with the range of prey sizes being larger for larger fish (Fig. 5). Although larger fish included small prey in their diets also, a significant rank correlation between prey size and fish length was found (rs = 0.671, p < 0.001, n = 1099). Analyses by species yielded also significant correlations for A. mazatlanus (rs = 0.537, p < 0.001, n = 223) and S. ovale (rs = 0.724, p < 0.001, n = 876). Separate analyses for food categories were made only in cases with n ≥ 20. Significant correlations were found for Alpheidae found in A. mazatlanus (rs = 0.404, p = 0.045, n = 25), Penaeidae (rs = 0.334, p = 0.003, n = 77) and Portunidae (rs = 0.606, p < 0.001, n = 32) found in S. ovale. A large sample of ingested copepods was measured but correlation with fish size was not significant for either S. ovale (rs = 0.069, p = 0.077, n = 657) or A. mazatlanus (rs = 0.092, p = 0.461, n = 65). Rank correlation between prey fish size and flatfish size was not significant for any species (A. mazatlanus: rs = 0.168, p = 0.116, n = 88; S. ovale: rs = 0.059, p = 0.644, n = 63). All size classes in both flatfish species included small prey fishes in their diets and median prey fish size was similar for all groups. However, a strong evidence of larger fish including larger prey fish in their diets was found for both species (Fig. 6).

| Boxplots of total lengths of prey fishes found in stomachs of two species of flatfishes. Horizontal lines inside the boxes are medians; boxes heights indicate inter-quartile (25%-75%) intervals; vertical lines indicate ranges (min-max). Data pooled by species (Am: Achirus mazatlanus; So: Syacium ovale) and size classes (1: < 10 cm TL; 2: ≥ 10 and ≤ 15 cm TL; 3: > 15 cm TL).
All morphometric measures showed significant differences between species (Tab. 3). Relative body height, peduncle height and mouth wide were higher in A. mazatlanus, while relative mouth height and gape were higher in S. ovale. The mean value of calculated gape area in S. ovale was almost 1.5 times larger than the same variable in A. mazatlanus.
| Means, standard errors (SE) and ANOVAs results for several morphometric variables of Achirus mazatlanus (Achmaz) and Syacium ovale (Syaova) expressed as ratios on standard length. SL: standard length, BH: maximum body height, PH: peduncle height, MH: mouth height, MW: mouth width, GA: Gape area. Sample size (N) = 25 for all variables.
DISCUSSION
Although the diet of both studied species is formed in a high percentage by invertebrates and fishes, some dissimilarities should be emphasized as supporting the significant differences found in diet composition. Achirus mazatlanus included polychaetes as an important food item and fishes eaten by this species were dominated by one family of benthic fishes (Gobiidae). On the other hand, polychaetes are just vestigial in the diet of S. ovale and a higher diversity of fishes is present in stomach contents of this species with an important representation of pelagic and benthopelagic taxa (i.e., Engraulidae, Lutjanidae, Mugilidae). In addition, crustaceans found in the diet of A. mazatlanus were dominated by alpheids, while S. ovale ate mostly penaeids and portunids. The presence of copepods in the diet of both species was limited to smaller fish and although this food item was well represented both numerically and by frequency of occurrence, its contribution in weight was negligible and should be considered a minor diet component.
After Link et al. (2015Link JS, Smith BE, Packer DB, Fogarty MJ, Langton RW. The trophic ecology of flatfishes. In: Gibson RN, Nash RDM, Geffen AJ, van der Veer HW, editors. Flatfishes: biology and exploitation. Oxford: John Wiley & Sons ; 2015. p.283- 313.) flatfishes primarily consume two general prey types: flatfishes either eat polychaetes and small benthic crustaceans or larger, wider-gaped flatfishes eat almost entirely fishes and squids. These general patterns do not match well for any of the two flatfish species included in present study. Achirus mazatlanus includes in its diet polychaetes and small benthic crustaceans but also an important percentage of fishes. Syacium ovale consumes a large proportion of fish, but has also high percentage of invertebrates in its stomach contents. A possible explanation for this discrepancy is that Link et al. (2015) based their conclusion in research mostly done in temperate and cold regions of northern Atlantic and Pacific. Several papers published on feeding habits of flatfishes in Brazilian and Mexican estuaries and bays indicate that a diet including crustaceans and fishes is a common feature (Corrêa, Uieda, 2007Corrêa MODA, Uieda VS. Diet of the ichthyofauna associated with marginal vegetation of a mangrove forest in southeastern Brazil. Iheringia Ser Zool. 2007; 97(4):486-97. http://dx.doi.org/10.1590/S0073-47212007000400020
http://dx.doi.org/10.1590/S0073-47212007...
; Guedes, Araújo, 2008Guedes APP, Araújo FG. Trophic resource partitioning among five flatfish species (Actinopterygii, Pleuronectiformes) in a tropical bay in south‐eastern Brazil. J Fish Biol. 2008; 72(4):1035-54. https://doi.org/10.1111/j.1095-8649.2007.01788.x
https://doi.org/10.1111/j.1095-8649.2007...
; Flores-Ortega et al., 2013Flores-Ortega JR, Godínez-Domínguez E, González-Sansón G, Rojo-Vázquez JA, López-Prado AC, Morales-Jauregui MY. Abundancia, distribución, hábitos alimentarios e interacciones tróficas de cinco especies de lenguados (Pleuronectiformes) en el Pacífico central mexicano. Lat Am J Aquat Res. 2013; 41(3):423-39. Available from: https://scielo.conicyt.cl/pdf/lajar/v41n3/art06.pdf
https://scielo.conicyt.cl/pdf/lajar/v41n...
; Medeiros et al., 2017Medeiros APM, Xavier JHA, Rosa IML. Diet and trophic organization of the fish assemblage from the Mamanguape River Estuary, Brazil. Lat Am J Aquat Res . 2017; 45(5):879-90. ).
The differences found in the diets of the studied species, can be explained, at least partially, by mouth characteristics of the two fish families included in this study, which are qualitatively different and have been described in details by other authors as follows. Munroe (2002Munroe TA. Paralichthydae, sand founders. In: Carpenter KE, editor. FAO species identification guide for fishery purposes and American Society of Ichthyologists and Herpetologists Special Publication. The living marine resources of the Western Central Atlantic. Vol. 3: Bony fishes, part 2 (Opistognathidae to Molidae), sea turtles and marine mammals. Rome: FAO; 2002. p.1375-2127.) states that species in Achiridae family are characterized by a small, oblique and asymmetrical subterminal mouth with minute villiform teeth which are difficult to see, better developed in blind-side jaws and occasionally absent. On the other side, species in Paralichthydae family have a more protractile asymmetrical mouth and teeth in jaws sometimes canine-like, which is the case for genus Syacium. In addition, Gibson (2015Gibson RN. Tropical flatfish fisheries. In: Gibson RN, Nash RD, Geffen AJ, Van der Veer HW, editors. Flatfishes: biology and exploitation. Oxford: John Wiley & Sons; 2015. p.418-60.) stated predators that capture motile prey have relatively symmetrical jaws with teeth on both sides, whereas those feeding on buried prey have asymmetrical jaws and teeth only on the blind side. Authors mention Paralichthyidae for the first case and Soleidae (closely related to Achiridae) for the second case.
Numerical classification suggests a clear difference in diet between species but statistical significance of observed clusters could not be demonstrated. This seems contradictory with the well supported ontogenic changes discussed above and the finding of no correlation between diets. A plausible explanation for this inconsistency is that the significance test used to define interpretable clusters (SIMPROF) is sensitive to the number of samples (Clarke et al., 2008Clarke KR, Somerfield PJ, Gorley RN. Testing of null hypotheses in exploratory community analyses: similarity profiles and biota-environment linkage. J Exp Mar Bio Ecol. 2008; 366(1-2):56-69. https://doi.org/10.1016/j.jembe.2008.07.009
https://doi.org/10.1016/j.jembe.2008.07....
; Aguilar-Betancourt et al., 2017Aguilar-Betancourt CM, González-Sansón G, Flores-Ortega JR, Kosonoy-Aceves D, Lucano-Ramírez G, Ruiz-Ramírez S, Padilla-Gutierrez SC, Curry RA. Comparative analysis of diet composition and its relation to morphological characteristics in juvenile fish of three lutjanid species in a Mexican Pacific coastal lagoon. Neotrop Ichthyol. 2017; 15(4):e170056. http://dx.doi.org/ 10.1590/1982-0224-20170056
http://dx.doi.org/ 10.1590/1982-0224-201...
) and was not powerful enough to detect significant differences in diet composition.
The evidence of significantly large diet overlap between the two studied species provided by the null model approach, might indicate shared resource utilization and a lack of competition or, on the contrary, it could imply strong competition that has not yet led to divergence in resource use (Gotelli, Graves, 1996Gotelli NJ, Graves GR. Null Models in Ecology. Washington: Smithsonian Institution Press; 1996.). As stated by Raborn et al. (2004Raborn SW, Miranda LE, Driscoll MT. Diet overlap and consumption patterns suggest seasonal flux in the likelihood for exploitative competition among piscivorous fishes. Ecol Freshw Fish. 2004; 13(4):276-84. http://dx.doi.org/10.1111/j.1600-0633.2004.00066.x
http://dx.doi.org/10.1111/j.1600-0633.20...
) additional data on resource availability and species interactions would be necessary for a definitive answer. In any case, the consumption of larger preys as fishes grow should also play a fundamental role to reduce inter and intraspecific competition (Cocheret de la Morinière et al., 2003Cocheret de la Morinière E, Pollux BJA, Nagelkerken I, van der Velde G. Diet shifts of Caribbean grunts (Haemulidae) and snappers (Lutjanidae) and the relation with nursery-to-coral reef migrations. Estuar Coast Shelf Sci. 2003; 57(5-6):1079-89. https://doi.org/10.1016/S0272-7714(03)00011-8
https://doi.org/10.1016/S0272-7714(03)00...
; Pimentel, Joyeux, 2010Pimentel CR, Joyeux JC. Diet and food partitioning between juveniles of mutton Lutjanus analis, dog Lutjanus jocu and lane Lutjanus synagris snappers (Perciformes: Lutjanidae) in a mangrove-fringed estuarine environment. J Fish Biol . 2010; 76(10):2299-317. http://dx.doi.org/10.1111/j.1095-8649.2010.02586.x
http://dx.doi.org/10.1111/j.1095-8649.20...
; Pessanha, Araújo, 2014Pessanha ALM, Araújo FG. Shifts of the feeding niche along the size dimension of three juvenile fish species in a tidal mudflat in southeastern Brazil. Mar Biol. 2014; 161(3):543-50. https://doi.org/10.1007/s00227-013-2356-8
https://doi.org/10.1007/s00227-013-2356-...
).
Asymmetrical predator size-prey size distribution found in the present study has been considered as a widespread pattern in aquatic ecosystems (Scharf et al., 2000Scharf FS, Juanes F, Rountree RA. Predator size-prey size relationships of marine fish predators: interspecific variation and effects of ontogeny and body size on trophic niche breadth. Mar Ecol Prog Ser . 2000; 208:229-48. https://doi.org/10.3354/meps208229
https://doi.org/10.3354/meps208229...
; Gaeta et al., 2018Gaeta JW, Ahrenstorff TD, Diana JS, Fetzer WW, Jones TS, Lawson ZJ, McInerny MC, Santucci VJ Jr, Zanden MJV. Go big or… don’t? A field-based diet evaluation of freshwater piscivore and prey fish size relationships. PloS One. 2018; 13(3):e0194092. https://doi.org/10.1371/journal.pone.0194092
https://doi.org/10.1371/journal.pone.019...
). This pattern means the continued inclusion of small prey in the diets of larger predators which do not match well with predictions of optimal foraging models which indicate that the largest prey available should be consumed preferentially to maximize net energetic return (Scharf et al., 2000Scharf FS, Juanes F, Rountree RA. Predator size-prey size relationships of marine fish predators: interspecific variation and effects of ontogeny and body size on trophic niche breadth. Mar Ecol Prog Ser . 2000; 208:229-48. https://doi.org/10.3354/meps208229
https://doi.org/10.3354/meps208229...
; Juanes et al., 2002Juanes F, Buckel JA, Scharf FS. Feeding ecology of piscivorous fishes. In: Hart PJB, Reynolds JD, editors. Handbook of fish biology and fisheries: Fish biology. Massachusetts: Blackwell Science; 2002. p.267-84.). A plausible explanation for the former mismatch between observed patterns and optimal foraging theory predictions can be that small prey organisms are both very abundant and easier to capture, making them more vulnerable to predation. In addition, predators use more time handling larger prey organisms and it could be more profitable for predators to retain small prey because search, capture and handling time will be lower (Scharf et al., 2000Scharf FS, Juanes F, Rountree RA. Predator size-prey size relationships of marine fish predators: interspecific variation and effects of ontogeny and body size on trophic niche breadth. Mar Ecol Prog Ser . 2000; 208:229-48. https://doi.org/10.3354/meps208229
https://doi.org/10.3354/meps208229...
). Recent findings support this approach as part of new developments in optimal foraging models which assert that gape size and handling time are not the only factors determining foraging success on mobile prey and other factors as search time, encounter rate, opportunity, and prey behavior should be considered also (Gaeta et al., 2018Gaeta JW, Ahrenstorff TD, Diana JS, Fetzer WW, Jones TS, Lawson ZJ, McInerny MC, Santucci VJ Jr, Zanden MJV. Go big or… don’t? A field-based diet evaluation of freshwater piscivore and prey fish size relationships. PloS One. 2018; 13(3):e0194092. https://doi.org/10.1371/journal.pone.0194092
https://doi.org/10.1371/journal.pone.019...
).
In summary, results obtained in this research do not allow rejection of the tested hypothesis. Significant differences in diet composition were present between species but both the numerical classification and simulation using null models support the idea of some niche overlap. Changes in prey sizes with an increased size of predators were demonstrated pointing basically to an ontogenetic change in feeding niche. This ontogenetic change is consistent with recent developments on optimal foraging theory. Finally, morphological differences are consistent with a more piscivorous habit in S. ovale compared to A. mazatlanus.
ACKNOWLEDGEMENTS
This study was partially supported by a COECYTJAL-UDG Project (5-2010-1-746) and a PROMEP Grant for a new fulltime professor (103.5/12/3418). Special thanks to the marine biology students from the University of Guadalajara for their valuable help in the field and the lab work.
REFERENCES
- Aguilar-Betancourt CM, González-Sansón G, Flores-Ortega JR, Kosonoy-Aceves D, Lucano-Ramírez G, Ruiz-Ramírez S, Padilla-Gutierrez SC, Curry RA. Comparative analysis of diet composition and its relation to morphological characteristics in juvenile fish of three lutjanid species in a Mexican Pacific coastal lagoon. Neotrop Ichthyol. 2017; 15(4):e170056. http://dx.doi.org/ 10.1590/1982-0224-20170056
» http://dx.doi.org/ 10.1590/1982-0224-20170056 - Alonso MK, Crespo EA, García NA, Pedraza SN, Mariotti PA, Mora NJ. Fishery and ontogenetic driven changes in the diet of the spiny dogfish, Squalus acanthias, in Patagonian waters, Argentina. Environ Biol Fishes. 2002; 63(2):193-202. https://doi.org/10.1023/A:1014229432375
» https://doi.org/10.1023/A:1014229432375 - Amezcua-Linares F, Castillo-Rodríguez ZG, Alvarez-Rubio M. Alimentación y reproducción del sol Achirus mazatlanus (Steindachner, 1869) en el sistema lagunar costero de Agua Brava, Pacífico de México. Ann Inst Bio. 1992; 19(2):181-94.
- Anderson MJ, Gorley RN, Clarke KR. PERMANOVA+ for PRIMER: A guide to software and statistical methods. Plymouth: PRIMER-E; 2008.
- Brown SC, Bizzarro JJ, Cailliet GM, Ebert DA. Breaking with tradition: redefining measures for diet description with a case study of the Aleutian skate Bathyraja aleutica (Gilbert 1896). Environ Biol Fishes . 2012; 95(1):3-20. https://doi.org/10.1007/s10641-011-9959-z
» https://doi.org/10.1007/s10641-011-9959-z - Chaves PTC, Serenato A. Diversidade de dietas na assembléia de linguados (Teleostei, Pleuronectiformes) do manguezal da Baía de Guaratuba, Paraná, Brasil. Rev Bras Oceanogr. 1998; 46(1):61-68. http://dx.doi.org/10.1590/S1413-77391998000100005
» http://dx.doi.org/10.1590/S1413-77391998000100005 - Clarke K, Gorley R. PRIMER version 6: user manual/tutorial. Plymouth: PRIMER-E ; 2006.
- Clarke KR, Somerfield PJ, Gorley RN. Testing of null hypotheses in exploratory community analyses: similarity profiles and biota-environment linkage. J Exp Mar Bio Ecol. 2008; 366(1-2):56-69. https://doi.org/10.1016/j.jembe.2008.07.009
» https://doi.org/10.1016/j.jembe.2008.07.009 - Colwell RK. EstimateS: Statistical estimation of species richness and shared species from samples. User’s Guide and application. Version 9 [Internet]. Storrs; 2013. Available from: http://purl.oclc.org/estimates
» http://purl.oclc.org/estimates - Cocheret de la Morinière E, Pollux BJA, Nagelkerken I, van der Velde G. Diet shifts of Caribbean grunts (Haemulidae) and snappers (Lutjanidae) and the relation with nursery-to-coral reef migrations. Estuar Coast Shelf Sci. 2003; 57(5-6):1079-89. https://doi.org/10.1016/S0272-7714(03)00011-8
» https://doi.org/10.1016/S0272-7714(03)00011-8 - Corrêa MODA, Uieda VS. Diet of the ichthyofauna associated with marginal vegetation of a mangrove forest in southeastern Brazil. Iheringia Ser Zool. 2007; 97(4):486-97. http://dx.doi.org/10.1590/S0073-47212007000400020
» http://dx.doi.org/10.1590/S0073-47212007000400020 - De Groot SJ. On the interrelationships between morphology of the alimentary tract, food and feeding behaviour in flatfishes (Pisces: Pleuronectiformes). J Sea Res. 1971; 5(2):121-96. https://doi.org/10.1016/0077-7579(71)90008-1
» https://doi.org/10.1016/0077-7579(71)90008-1 - Figueiredo M, Morato T, Barreiros JP, Afonso P, Santos RS. Feeding ecology of the white seabream, Diplodus sargus, and the ballan wrasse, Labrus bergylta, in the Azores. Fish Res. 2005; 75(1-3):107-19. https://doi.org/10.1016/j.fishres.2005.04.013
» https://doi.org/10.1016/j.fishres.2005.04.013 - Fisher W, Krupp F, Schneider W, Sommer C, Carpenter KE, Niem VH. Guía FAO para la identificación de especies para los fines de la pesca: Pacifico Centro-Oriental. Roma; FAO; 1995.
- Flores-Ortega JR, Godínez-Domínguez E, González-Sansón G, Rojo-Vázquez JA, López-Prado AC, Morales-Jauregui MY. Abundancia, distribución, hábitos alimentarios e interacciones tróficas de cinco especies de lenguados (Pleuronectiformes) en el Pacífico central mexicano. Lat Am J Aquat Res. 2013; 41(3):423-39. Available from: https://scielo.conicyt.cl/pdf/lajar/v41n3/art06.pdf
» https://scielo.conicyt.cl/pdf/lajar/v41n3/art06.pdf - Froese R, Pauly D. FishBase. World Wide Web electronic publication. 2019. Available from: http://www.fishbase.org
» http://www.fishbase.org - Gaeta JW, Ahrenstorff TD, Diana JS, Fetzer WW, Jones TS, Lawson ZJ, McInerny MC, Santucci VJ Jr, Zanden MJV. Go big or… don’t? A field-based diet evaluation of freshwater piscivore and prey fish size relationships. PloS One. 2018; 13(3):e0194092. https://doi.org/10.1371/journal.pone.0194092
» https://doi.org/10.1371/journal.pone.0194092 - García-Madrigal MS, Andréu-Sánchez LI. Los cangrejos porcelánidos (Decapoda: Anomura) del Pacífico sur de México, incluyendo una lista y clave de identificación para todas las especies del Pacífico oriental tropical. Ciencia y Mar. 2009; (39):23-54.
- Garrison LP, Link JS. Fishing effects on spatial distribution and trophic guild structure of the fish community in the Georges Bank region. ICES J Mar Sci. 2000a; 57(3):723-30. https://doi.org/10.1006/jmsc.2000.0713
» https://doi.org/10.1006/jmsc.2000.0713 - Garrison LP, Link JS. Dietary guild structure of the fish community in the Northeast United States continental shelf ecosystem. Mar Ecol Prog Ser. 2000b; 202:231-40. https://doi.org/10.3354/meps202231
» https://doi.org/10.3354/meps202231 - Gibson RN. Tropical flatfish fisheries. In: Gibson RN, Nash RD, Geffen AJ, Van der Veer HW, editors. Flatfishes: biology and exploitation. Oxford: John Wiley & Sons; 2015. p.418-60.
- González-Sansón G, Aguilar-Betancourt C, Kosonoy-Aceves D, Lucano-Ramírez G, Ruiz-Ramírez S, Flores-Ortega JR, Hinojosa-Larios A, Silva-Bátiz FA. Species and size composition of fishes in Barra de Navidad lagoon, Mexican central Pacific. Rev Biol Trop. 2014a; 62(1):129-44. https://doi.org/10.15517/rbt.v62i1.10001G
» https://doi.org/10.15517/rbt.v62i1.10001G - González-Sansón G, Aguilar-Betancourt C, Kosonoy-Aceves D, Lucano-Ramírez G, Ruiz-Ramírez S, Flores-Ortega JR, Silva-Bátiz F. Weight-length relationships for 38 fish species of Barra de Navidad coastal lagoon, Jalisco, Mexico. J Appl Ichthyol. 2014b; 30(2):428-30. https://doi.org/10.1111/jai.12327
» https://doi.org/10.1111/jai.12327 - González-Sansón G, Aguilar-Betancourt C, Kosonoy-Aceves D, Lucano-Ramírez G, Ruiz-Ramírez S, Flores-Ortega JR. Spatial and temporal variations of juvenile fish abundance in Barra de Navidad coastal lagoon, Jalisco, México: Effects of hurricane Jova. Rev Biol Mar Oceanogr. 2016; 51(1):123-36. https://doi.org/10.4067/S0718-19572016000100012
» https://doi.org/10.4067/S0718-19572016000100012 - Gotelli NJ, Graves GR. Null Models in Ecology. Washington: Smithsonian Institution Press; 1996.
- Gotelli NJ, Entsminger GL. EcoSim: Null models software for ecologists. Version 7.0 [Internet]. Jericho; 2004. Available from: http://garyentsminger.com/ecosim/index.htm
» http://garyentsminger.com/ecosim/index.htm - Guedes APP, Araújo FG. Trophic resource partitioning among five flatfish species (Actinopterygii, Pleuronectiformes) in a tropical bay in south‐eastern Brazil. J Fish Biol. 2008; 72(4):1035-54. https://doi.org/10.1111/j.1095-8649.2007.01788.x
» https://doi.org/10.1111/j.1095-8649.2007.01788.x - Hansson S. Methods of studying fish feeding: a comment. Can J Fish Aquat Sci. 1998; 55(12):2706-07. https://doi.org/10.1139/f98-158
» https://doi.org/10.1139/f98-158 - Hendrickx ME. Los camarones Penaeoidea bentónicos (Crustacea: Decápoda: Dendrobranchiata) del Pacífico mexicano. México: CONABIO; 1996.
- Hyslop EJ. Stomach contents analysis - a review of methods and their application. J Fish Biol . 1980; 17(4):411-29. https://doi.org/10.1111/j.1095-8649.1980.tb02775.x
» https://doi.org/10.1111/j.1095-8649.1980.tb02775.x - Juanes F, Buckel JA, Scharf FS. Feeding ecology of piscivorous fishes. In: Hart PJB, Reynolds JD, editors. Handbook of fish biology and fisheries: Fish biology. Massachusetts: Blackwell Science; 2002. p.267-84.
- Krebs CJ. Ecological methodology. São Francisco: Benjamin Cummings; 1998.
- Lankford RR. Coastal lagoons of Mexico: their origin and classification. In: Wiley M, editor. Estuarine processes - Circulation, Sediments, and Tranfer of Material in the Estuary. New York: Academic Press; 1977. p.182-215.
- Link JS, Smith BE, Packer DB, Fogarty MJ, Langton RW. The trophic ecology of flatfishes. In: Gibson RN, Nash RDM, Geffen AJ, van der Veer HW, editors. Flatfishes: biology and exploitation. Oxford: John Wiley & Sons ; 2015. p.283- 313.
- Lunardon-Branco MJ, Branco JO. Alimentação natural de Etropus crossotus Jordan & Gilbert (Teleostei, Pleuronectiformes, Paralichthyidae), na Armação do Itapocoroy, Penha, Santa Catarina. Brasil Rev Bras Zool. 2003; 20(4):631-35. http://dx.doi.org/10.1590/S0101-81752003000400012
» http://dx.doi.org/10.1590/S0101-81752003000400012 - Magurran AE. Measuring biological diversity. Oxford: Blackwell Science Ltd.; 2004.
- Martínez-Iglesias JC, Ríos R, Carvacho A. Las especies del género Alpheus (Decapoda: Alpheidae) de Cuba. Rev Biol Trop . 1996; 44(3)/45(1):401-29.
- Medeiros APM, Xavier JHA, Rosa IML. Diet and trophic organization of the fish assemblage from the Mamanguape River Estuary, Brazil. Lat Am J Aquat Res . 2017; 45(5):879-90.
- Munroe TA. Paralichthydae, sand founders. In: Carpenter KE, editor. FAO species identification guide for fishery purposes and American Society of Ichthyologists and Herpetologists Special Publication. The living marine resources of the Western Central Atlantic. Vol. 3: Bony fishes, part 2 (Opistognathidae to Molidae), sea turtles and marine mammals. Rome: FAO; 2002. p.1375-2127.
- Munroe TA. Tropical flatfish fisheries, In: Gibson RN, Nash RD, Geffen AJ, Van der Veer HW, editors. Flatfishes: biology and exploitation. Oxford: John Wiley & Sons ; 2015. p.418-60.
- Pessanha ALM, Araújo FG. Shifts of the feeding niche along the size dimension of three juvenile fish species in a tidal mudflat in southeastern Brazil. Mar Biol. 2014; 161(3):543-50. https://doi.org/10.1007/s00227-013-2356-8
» https://doi.org/10.1007/s00227-013-2356-8 - Piet GJ, Pfisterer AB, Rijnsdorp AD. On factors structuring the flatfish assemblage in the southern North Sea. J Sea Res . 1998; 40(1-2):143-52. https://doi.org/10.1016/S1385-1101(98)00008-2
» https://doi.org/10.1016/S1385-1101(98)00008-2 - Pimentel CR, Joyeux JC. Diet and food partitioning between juveniles of mutton Lutjanus analis, dog Lutjanus jocu and lane Lutjanus synagris snappers (Perciformes: Lutjanidae) in a mangrove-fringed estuarine environment. J Fish Biol . 2010; 76(10):2299-317. http://dx.doi.org/10.1111/j.1095-8649.2010.02586.x
» http://dx.doi.org/10.1111/j.1095-8649.2010.02586.x - Raborn SW, Miranda LE, Driscoll MT. Diet overlap and consumption patterns suggest seasonal flux in the likelihood for exploitative competition among piscivorous fishes. Ecol Freshw Fish. 2004; 13(4):276-84. http://dx.doi.org/10.1111/j.1600-0633.2004.00066.x
» http://dx.doi.org/10.1111/j.1600-0633.2004.00066.x - Robertson DR, Allen GR. Shorefishes of the Tropical Eastern Pacific online information system [Internet]. Balboa: Smithsonian Tropical Research Institute; 2015. Available from: https://biogeodb.stri.si.edu/sftep/es/pages
» https://biogeodb.stri.si.edu/sftep/es/pages - Scharf FS, Juanes F, Rountree RA. Predator size-prey size relationships of marine fish predators: interspecific variation and effects of ontogeny and body size on trophic niche breadth. Mar Ecol Prog Ser . 2000; 208:229-48. https://doi.org/10.3354/meps208229
» https://doi.org/10.3354/meps208229 - StatSoft, Inc. STATISTICA: Data analysis software system. 2006. Available from: http://www.statsoft.com
» http://www.statsoft.com - Underwood AJ. Experiments in ecology: Their logical design and interpretation using analysis of variance. Cambridge: Cambridge University Press; 1997.
- BWorld Register of Marine Species [Internet]. Belgim: WoRMS; 2019. Available from http://www.marinespecies.org
» http://www.marinespecies.org
ADDITIONAL NOTES
-
HOW TO CITE THIS ARTICLE
Padilla-Gutierrez SC, González-Sansón G, Aguilar-Betancourt CM, Flores-Ortega JR. Comparative analysis of the diet composition and its relation to morphological characteristics in Achirus mazatlanus and Syacium ovale (Pleuronectiformes: Osteichthyes) from a Mexican Pacific coastal lagoon. Neotrop ichthyol. 2020; 18(1):e190059. https://doi.org/10.1590/110.1590/1982-0224-2019-0059
Edited by
Edited by
Data availability
Data citations
Froese R, Pauly D. FishBase. World Wide Web electronic publication. 2019. Available from: http://www.fishbase.org
Robertson DR, Allen GR. Shorefishes of the Tropical Eastern Pacific online information system [Internet]. Balboa: Smithsonian Tropical Research Institute; 2015. Available from: https://biogeodb.stri.si.edu/sftep/es/pages
Publication Dates
-
Publication in this collection
17 Apr 2020 -
Date of issue
2020
History
-
Received
09 June 2019 -
Accepted
12 Jan 2020


