Abstract
High rates of deforestation, either in the past or the present, affect many of the ecological processes in streams. Integrating deforestation history and the current landscape structure enhances the evaluation of ecological effects of land-use change. This is especially true when contemporary landscape conditions are similar but the temporal path to those conditions differs. One approach that has shown promise for evaluating biodiversity responses over time and space is the β-diversity partitioning, which combines taxonomic and functional trait-based approaches. We tested hypotheses related to stream fish assemblages’ turnover in watersheds with different environmental conditions and deforestation histories. We sampled fish from 75 watersheds in the Machado River basin, Brazil, and environmental factors were quantified at multiple scales. Taxonomic turnover was higher than expected by chance, whereas functional turnover was lower than expected by the observed taxonomic turnover, indicating that deterministic processes are structuring these assemblages. The turnover, and the environmental factors differed among watersheds with different deforestation histories. Besides being scale-dependent, turnover patterns are also likely dependent on land use dynamics and involve time-lags.
Keywords:
β-diversity; Deterministic processes; Landscape; Madeira River basin; Scale-dependency
Resumo
Altas taxas de desmatamento, seja no passado ou no presente, afetam muitos processos ecológicos em riachos. Integrar o histórico do desmatamento à estrutura atual da paisagem melhora a avaliação dos efeitos ecológicos da mudança do uso do solo. Isto é especialmente verdadeiro quando as condições da paisagem contemporânea são semelhantes, mas seguiram trajetórias distintas. Uma abordagem promissora para avaliar as respostas da biodiversidade ao longo do tempo e espaço é a partição da diversidade-β, que combina abordagens taxonômica e funcional. Testamos hipóteses relacionadas à substituição das assembleias de peixes de riachos em microbacias com diferentes condições ambientais e histórias de desmatamento. Amostramos 75 microbacias na bacia do rio Machado, fatores ambientais foram quantificados em múltiplas escalas. A substituição taxonômica foi maior do que esperada pelo acaso, enquanto a substituição funcional foi menor do que o esperado pela substituição taxonômica, indicando que as assembleias são estruturadas por processos determinísticos. As substituições e fatores ambientais diferiram entre microbacias com históricos de desmatamento distintos. Além de serem escala-dependentes, os padrões de substituição provavelmente são dependentes da dinâmica do uso do solo, envolvendo defasagem temporal.
Palavras-chave:
Bacia do rio Madeira; Diversidade β; Escala-dependência; Paisagem; Processos determinísticos
INTRODUCTION
Rivers and streams are characterized by elongated linear form at local scales and dendritic form at watershed scales, unidirectional flow (especially in headwaters and mid-reaches) and unstable substrates (Welcomme, 1985Welcomme RL. Morphology of river systems. In: Welcomme RL, editor. Rome: River Fisheries; 1985. p.1-34.). The aforementioned characteristics entail an intimate connection with the surrounding terrestrial environment, and freshwater ecosystems tend to accumulate and concentrate impacts related to landscape modification or land use activities in the surrounding watershed (Hynes, 1975Hynes HBN. The stream and its valley. Int Ver Theor Angew Limnol. 1975; 19(1):1–15. https://doi.org/10.1080/03680770.1974.11896033
https://doi.org/10.1080/03680770.1974.11...
; Wear et al., 1998Wear D, Turner M, Naiman R. Land cover along an urban-rural gradient: implications for water quality. Ecol Appl. 1998; 8(3):619–30. https://doi.org/10.1890/1051-0761(1998)008[0619:LCAAUR]2.0.CO;2
https://doi.org/10.1890/1051-0761(1998)0...
; Townsend et al., 2003Townsend CR, Begon M, Harper JA. Essentials of ecology. Oxford, UK: Blackwell Science; 2003.). For example, high rates of deforestation in rainforests, either in the past or the present, affect many of the ecological processes occurring in the associated streams (Wright, Flecker, 2004Wright JP, Flecker AS. Deforesting the riverscape: the effects of wood on fish diversity in a Venezuelan piedmont stream. Biol Conserv. 2004; 120(3):439–47. https://doi.org/10.1016/j.biocon.2004.02.022
https://doi.org/10.1016/j.biocon.2004.02...
; Paula et al., 2011Paula FR, Ferraz SFB, Gerhard P, Vettorazzi CA, Ferreira A. Large woody debris input and its influence on channel structure in agricultural lands of southeast Brazil. Environ Manage. 2011; 48(4):750–63. https://doi.org/10.1007/s00267-011-9730-4
https://doi.org/10.1007/s00267-011-9730-...
; Brejão et al., 2018Brejão GL, Hoeinghaus DJ, Pérez-Mayorga MA, Ferraz SFBB, Casatti L. Threshold responses of Amazonian stream fishes to timing and extent of deforestation. Conserv Biol. 2018; 32(4):860–71. https://doi.org/10.1111/cobi.13061
https://doi.org/10.1111/cobi.13061...
). Intact riparian zones or buffers may perform critical ecological functions in mitigating to some degree the impacts to freshwater systems caused by land cover change (Dwire, Lowrance, 2006Dwire KA, Lowrance RR. Riparian ecosystems and buffers – multiscale structure, function, and management: introduction. J Am Water Resour As. 2006; 42(1):1–04. https://doi.org/10.1111/j.1752-1688.2006.tb03817.x
https://doi.org/10.1111/j.1752-1688.2006...
). That said, the effects of land cover change are not fully understood, especially for highly diverse tropical systems that are currently experiencing high rates of impact (Bojsen, Barriga, 2002Bojsen BH, Barriga R. Effects of deforestation on fish community structure in Ecuadorian Amazon streams. Freshwater Biol. 2002; 47:2246–60. https://doi.org/10.1046/j.1365-2427.2002.00956.x
https://doi.org/10.1046/j.1365-2427.2002...
; Lorion, Kennedy, 2009Lorion CM, Kennedy BP. Relationships between deforestation, riparian forest buffers and benthic macroinvertebrates in neotropical headwater streams. Freshw Biol. 2009; 54(1):165–80. https://doi.org/10.1111/j.1365-2427.2008.02092.x
https://doi.org/10.1111/j.1365-2427.2008...
; Leal et al., 2016Leal CG, Pompeu PS, Gardner TA, Leitão RP, Hughes RM, Kaufmann PR et al. Multi-scale assessment of human-induced changes to Amazonian instream habitats. Landsc Ecol. 2016; 31(8):1725–45. https://doi.org/10.1007/s10980-016-0358-x
https://doi.org/10.1007/s10980-016-0358-...
). In particular, our understanding of how temporal and spatial dynamics of deforestation, not just the total area impacted, affect freshwater ecosystems is very limited.
Temporal aspects of the biodiversity response to deforestation can be separated into two interacting components: the timing or rate of land-use change and the rate of species responses to that change. Although many studies compare biodiversity among contemporary land-use categories (e.g., impacted and reference conditions), including details about deforestation history along with current landscape structure enhances the analytical power to evaluate ecological effects of land-use change (Ferraz et al., 2009Ferraz SFDB, Vettorazzi CA, Theobald DM. Using indicators of deforestation and land-use dynamics to support conservation strategies: A case study of central Rondônia, Brazil. For Ecol Manage. 2009; 257(7):1586–95. https://doi.org/10.1016/j.foreco.2009.01.013
https://doi.org/10.1016/j.foreco.2009.01...
). This is especially true when contemporary landscape conditions are similar but the temporal path to those conditions differs (Ferraz et al., 2009Ferraz SFDB, Vettorazzi CA, Theobald DM. Using indicators of deforestation and land-use dynamics to support conservation strategies: A case study of central Rondônia, Brazil. For Ecol Manage. 2009; 257(7):1586–95. https://doi.org/10.1016/j.foreco.2009.01.013
https://doi.org/10.1016/j.foreco.2009.01...
). Biodiversity responses to deforestation can vary greatly among species and over time scales ranging from coincident with deforestation to many decades after the deforestation event. For example, Brejão et al., (2018)Brejão GL, Hoeinghaus DJ, Pérez-Mayorga MA, Ferraz SFBB, Casatti L. Threshold responses of Amazonian stream fishes to timing and extent of deforestation. Conserv Biol. 2018; 32(4):860–71. https://doi.org/10.1111/cobi.13061
https://doi.org/10.1111/cobi.13061...
found some stream fish species in the western Amazon exhibited strong negative threshold population responses with only minor deforestation in the watershed almost immediately after the impact, whereas others exhibited positive threshold responses almost two decades after deforestation occurred. Similarly, other studies have found legacy effects of land-use change on stream biodiversity such that historical land use is a better predictor of contemporary communities (Harding et al., 1998Harding JS, Benfield EF, Bolstad P V, Helfman GS, Jones EB. Stream biodiversity: the ghost of land use past. Proc Natl Acad Sci USA. 1998; 95(25):14843–847. https://www.pnas.org/content/95/25/14843
https://www.pnas.org/content/95/25/14843...
; Iwata et al., 2003Iwata T, Nakano S, Inoue M. Impacts of past riparian deforestation on stream communities in a tropical rain forest in Borneo. Ecol Appl. 2003; 13(2):461–73. https://doi.org/10.1890/1051-0761(2003)013[0461:IOPRDO]2.0.CO;2
https://doi.org/10.1890/1051-0761(2003)0...
; Zeni et al., 2017Zeni JO, Hoeinghaus DJ, Casatti L. Effects of pasture conversion to sugarcane for biofuel production on stream fish assemblages in tropical agroecosystems. Freshw Biol. 2017; 62(12):2026–38. https://doi.org/10.1111/fwb.13047
https://doi.org/10.1111/fwb.13047...
).
From the spatial context, deforestation typically occurs in a heterogeneous manner within watersheds and the heterogeneous distribution of land-use change can lead to heterogeneous or patchy species responses in space (Erős, Lowe, 2019Erős T, Lowe WH. The Landscape ecology of rivers: From patch-based to spatial network analyses. Curr Lands Ecol Rep. 2019; 4(4):103–12. https://doi.org/10.1007/s40823-019-00044-6
https://doi.org/10.1007/s40823-019-00044...
). If connectivity is present among patches, movement of individuals can lead to source-sink metapopulation or metacommunity dynamics where immigrants from source populations in non-impacted sites support the persistence of sink populations in impacted sites (Schiesari et al., 2019Schiesari L, Matias MG, Prado PI, Leibold MA, Albert CH, Howeth JG et al. Towards an applied metaecology. Perspect Ecol Conserv. 2019; 17(4):172–81. https://doi.org/10.1016/j.pecon.2019.11.001
https://doi.org/10.1016/j.pecon.2019.11....
). This rescue effect, if undetected, can lead to an underestimation of the effects of deforestation at the local scale. Alternatively, impacts of deforestation may be observed in seemingly unimpacted regions due to the flux of sediment, nutrients, and individuals from upstream to downstream or the severing of migration corridors. Together, these aspects indicate that the effects of deforestation may be distributed beyond the just local area impacted and also may be offset to some degree by the presence of source populations within the watershed (e.g., Montag et al., 2019Montag LFA, Winemiller KO, Keppeler FW, Leão H, Benone NL, Torres NR et al. Land cover, riparian zones and instream habitat influence stream fish assemblages in the eastern Amazon. Ecol Freshw Fish. 2019; 28:317–29. https://doi.org/10.1111/eff.12455
https://doi.org/10.1111/eff.12455...
).
Understanding the temporal and spatial dynamics of communities in response to temporal and spatial dynamics of land-use change is a challenging endeavor that requires integrating large temporal and spatial scales. One approach that has shown promise in this regard is β-diversity partitioning (e.g., Baselga et al., 2015Baselga A, Bonthoux S, Balent G. Temporal beta diversity of bird assemblages in agricultural landscapes: Land cover change vs. stochastic processes. PLoS One. 2015; 10(5):e0127913. https://doi.org/10.1371/journal.pone.0127913
https://doi.org/10.1371/journal.pone.012...
; Zeni et al., 2020Zeni JO, Hoeinghaus DJ, Roa-Fuentes CA, Casatti L. Stochastic species loss and dispersal limitation drive patterns of spatial and temporal beta diversity of fish assemblages in tropical agroecosystem streams. Hydrobiologia. 2020; 847: 3829–43. https://doi.org/10.1007/s10750-020-04356-1
https://doi.org/10.1007/s10750-020-04356...
). As originally defined by Whittaker, (1960)Whittaker RH. Vegetation of the Siskiyou Mountains, Oregon and California. Ecol Monogr. 1960; 30(3):279–338. https://doi.org/10.2307/1943563
https://doi.org/10.2307/1943563...
, β-diversity is the change in species composition along a gradient or among sites in space. β-diversity can be partitioned into turnover and nestedness components where turnover represents species replacement among sites and nestedness represents a non-random loss or gain of species among sites (Baselga, 2010Baselga A. Partitioning the turnover and nestedness components of beta diversity. Global Ecol Biogeogr. 2010; 19(1):134–43. https://doi.org/10.1111/j.1466-8238.2009.00490.x
https://doi.org/10.1111/j.1466-8238.2009...
; Baeten et al., 2012Baeten L, Vangansbeke P, Hermy M, Peterken G, Vanhuyse K, Verheyen K. Distinguishing between turnover and nestedness in the quantification of biotic homogenization. Biodivers Conserv. 2012; 21:1399–409. https://doi.org/10.1007/s10531-012-0251-0
https://doi.org/10.1007/s10531-012-0251-...
). According to Socolar et al., (2016)Socolar JB, Gilroy JJ, Kunin WE, Edwards DP. How Should Beta-Diversity Inform Biodiversity Conservation? Trends Ecol Evo. 2016; 31(1): 67–80. https://doi.org/10.1016/j.tree.2015.11.005
https://doi.org/10.1016/j.tree.2015.11.0...
the turnover occurs when the species present at one site are absent at another site, but are replaced by other species absent from the first, on the other hand, nestedness occurs when the species present at one site are absent at another, but are not replaced by additional species. In a conservation perspective across natural environments, the turnover implies that conservation must target multiple sites, while nestedness suggests that conservation might target the richest sites (Socolar et al., 2016Socolar JB, Gilroy JJ, Kunin WE, Edwards DP. How Should Beta-Diversity Inform Biodiversity Conservation? Trends Ecol Evo. 2016; 31(1): 67–80. https://doi.org/10.1016/j.tree.2015.11.005
https://doi.org/10.1016/j.tree.2015.11.0...
).
Most β-diversity research has focused on spatial gradients, and findings from those studies demonstrate that habitat heterogeneity (including resulting from land-use change) is an important driver of β-diversity (Anderson et al., 2011Anderson MJ, Crist TO, Chase JM, Vellend M, Inouye BD, Freestone AL et al. Navigating the multiple meanings of β diversity: a roadmap for the practicing ecologist. Ecol Lett. 2011; 14(1):19–28. https://doi.org/10.1111/j.1461-0248.2010.01552.x
https://doi.org/10.1111/j.1461-0248.2010...
; Siqueira et al., 2015Siqueira T, Lacerda CGT, Saito VS. How does landscape modification induce biological homogenization in tropical stream metacommunities? Biotropica. 2015; 47(4):509–16. https://doi.org/10.1111/btp.12224
https://doi.org/10.1111/btp.12224...
). Regardless of the gradient of interest, analyses that quantify β-diversity and determine the environmental factors associated with β-diversity components can provide insight into the relative importance of deterministic (niche-based) and stochastic (neutral) processes in community assembly (Püttker et al., 2015Püttker T, Bueno AA, Prado PI, Pardini R. Ecological filtering or random extinction? Beta-diversity patterns and the importance of niche-based and neutral processes following habitat loss. Oikos. 2015; 124(2):206–15. https://doi.org/10.1111/oik.01018
https://doi.org/10.1111/oik.01018...
; Mori et al., 2018Mori AS, Isbell F, Seidl R. β-Diversity, community assembly, and ecosystem functioning. Trends Ecol Evol. 2018; 33(7):549–64. https://doi.org/10.1016/j.tree.2018.04.012
https://doi.org/10.1016/j.tree.2018.04.0...
; Roa-Fuentes et al., 2019Roa-Fuentes CA, Heino J, Cianciaruso MV, Ferraz S, Zeni JO, Casatti L. Taxonomic, functional, and phylogenetic β-diversity patterns of stream fish assemblages in tropical agroecosystems. Freshw Biol. 2019; 64(3):447–60. https://doi.org/10.1111/fwb.13233
https://doi.org/10.1111/fwb.13233...
).
Mechanistic interpretation of temporal and spatial dimensions of biodiversity responses to deforestation and effects on ecosystem processes can be informed by combining taxonomic and functional traits approaches (Petchey, Gaston, 2006Petchey OL, Gaston KJ. Functional diversity: back to basics and looking forward. Ecol Lett. 2006; 9(6):741–58. https://doi.org/10.1111/j.1461-0248.2006.00924.x
https://doi.org/10.1111/j.1461-0248.2006...
; Hoeinghaus et al., 2007Hoeinghaus DJ, Winemiller KO, Birnbaum JS. Local and regional determinants of stream fish assemblage structure: inferences based on taxonomic vs. functional groups. J Biogeogr. 2007; 34(2):324–38. https://doi.org/10.1111/j.1365-2699.2006.01587.x
https://doi.org/10.1111/j.1365-2699.2006...
; Swenson et al., 2012Swenson NG, Stegen JC, Davies SJ, Erickson DL, Forero-Montaña J, Hurlbert AH et al. Temporal turnover in the composition of tropical tree communities: Functional determinism and phylogenetic stochasticity. Ecology. 2012; 93(3):490–99. https://doi.org/10.1890/11-1180.1
https://doi.org/10.1890/11-1180.1...
). This is especially important in hyperdiverse tropical regions where functional redundancy may be high (Vitule et al., 2017Vitule JRS, Agostinho AA, Azevedo-Santos VM, Daga VS, Darwall WRT, Fitzgerald DB et al. We need better understanding about functional diversity and vulnerability of tropical freshwater fishes. Biodivers Conserv. 2017; 26(3):757–62. https://doi.org/10.1007/s10531-016-1258-8
https://doi.org/10.1007/s10531-016-1258-...
), buffering the functional turnover. Taxonomic and functional β-diversity are expected to be positively correlated, but whether functional turnover is higher or lower than expected by species turnover has received less attention (Swenson, 2011Swenson NG. Phylogenetic beta diversity metrics, trait evolution and inferring the functional beta diversity of communities. PLoS One. 2011; 6(6):e21264. https://doi.org/10.1371/journal.pone.0021264
https://doi.org/10.1371/journal.pone.002...
).
In this study, we use a combined taxonomic and functional group approach to test whether (i) turnover is higher than expected by chance in streams from deforested watersheds and in comparison with streams from forested watersheds, according to Socolar et al., (2016)Socolar JB, Gilroy JJ, Kunin WE, Edwards DP. How Should Beta-Diversity Inform Biodiversity Conservation? Trends Ecol Evo. 2016; 31(1): 67–80. https://doi.org/10.1016/j.tree.2015.11.005
https://doi.org/10.1016/j.tree.2015.11.0...
, high intensity land use reduces the total abundance of many species across the assemblage regional pool, and the β-diversity can increase as species become rarer, (ii) timing of deforestation affects turnover due to different temporal responses of sensitive and tolerant species to time and extent of deforestation (Brejão et al., 2018Brejão GL, Hoeinghaus DJ, Pérez-Mayorga MA, Ferraz SFBB, Casatti L. Threshold responses of Amazonian stream fishes to timing and extent of deforestation. Conserv Biol. 2018; 32(4):860–71. https://doi.org/10.1111/cobi.13061
https://doi.org/10.1111/cobi.13061...
), because the loss of sensitive species in deforested usually is faster than the processes of colonization and settling of tolerant species due to habitat homogenization process, (iii) both local (instream) and watershed (landscape) variables are associated with turnover in deforested streams, since these streams are located in heterogeneous landscapes, whereas only local variables are associated with turnover in forested streams, since these streams are located in homogeneous landscapes. Specifically, for river basins that were recently deforested, remnants of preserved areas could be of great value because they are still able to harbour subsets of satellite species that can play a role as source assemblages in the regional context (Pérez-Mayorga et al., 2017Pérez-Mayorga MA, Casatti L, Teresa FB, Brejão GL. Shared or distinct responses between intermediate and satellite stream fish species in an altered Amazonian River? Environ Biol Fishes. 2017; 100(12):1527–41. https://doi.org/10.1007/s10641-017-0663-5
https://doi.org/10.1007/s10641-017-0663-...
), and (iv) the above patterns differ between analyses using taxonomic and functional groups defined by ecomorphological traits, instead of β-diversity has usually being evaluated by species composition and abundance, (Swenson et al., 2012Swenson NG, Stegen JC, Davies SJ, Erickson DL, Forero-Montaña J, Hurlbert AH et al. Temporal turnover in the composition of tropical tree communities: Functional determinism and phylogenetic stochasticity. Ecology. 2012; 93(3):490–99. https://doi.org/10.1890/11-1180.1
https://doi.org/10.1890/11-1180.1...
; Mori et al., 2018Mori AS, Isbell F, Seidl R. β-Diversity, community assembly, and ecosystem functioning. Trends Ecol Evol. 2018; 33(7):549–64. https://doi.org/10.1016/j.tree.2018.04.012
https://doi.org/10.1016/j.tree.2018.04.0...
), where then are all treated as functionally equivalent (Swenson et al., 2012Swenson NG, Stegen JC, Davies SJ, Erickson DL, Forero-Montaña J, Hurlbert AH et al. Temporal turnover in the composition of tropical tree communities: Functional determinism and phylogenetic stochasticity. Ecology. 2012; 93(3):490–99. https://doi.org/10.1890/11-1180.1
https://doi.org/10.1890/11-1180.1...
).
MATERIAL AND METHODS
Study area. Field research was conducted in the Machado River basin, Brazil (Fig. 1). The Machado River is a tributary of the Madeira River in the western Amazon, and drains the most populated region of Rondônia state, Brazil (Fernandes, Guimarães, 2002Fernandes LC, Guimarães SCP. Atlas geoambiental de Rondônia. SEDAM; 2002.). The climate is tropical humid: temperatures range from 19 to 33 °C, and annual rainfall is 2,500 mm (Krusche et al., 2005Krusche A, Ballester M, Victoria R, Bernardes M, Leite N, Hanada L et al. Efeitos das mudanças do uso da terra na biogeoquímica dos corpos d’água da bacia do rio Ji-Paraná, Rondônia. Acta Amaz. 2005; 35(2):197–205. https://doi.org/10.1590/S0044-59672005000200009
https://doi.org/10.1590/S0044-5967200500...
). Native vegetation is open humid tropical forest (primary forest), and current land cover includes a matrix of primary forest, secondary forest (regrowth on previously deforested land), and pasture (Ferraz et al., 2009Ferraz SFDB, Vettorazzi CA, Theobald DM. Using indicators of deforestation and land-use dynamics to support conservation strategies: A case study of central Rondônia, Brazil. For Ecol Manage. 2009; 257(7):1586–95. https://doi.org/10.1016/j.foreco.2009.01.013
https://doi.org/10.1016/j.foreco.2009.01...
). This region has many terra firme streams, which are intermittent during most of the dry season. We surveyed 75 first- to third-order streams representing sub-basins dominated by intact primary forest or pasture with various deforestation histories. In general, sampled streams were shallow with low-velocity flow and warm temperatures. Streambeds were predominantly comprised by sand, litter pack, and large woody debris, and stream banks usually provided submerged microhabitat structure derived from the riparian environment such as tree roots and grasses (Tab. 1).
Field and laboratory methods. Streams were sampled once in the dry season (August–October 2011 and June–July 2012). Field methods were standardized to allow for comparisons of environmental parameters and species abundances across sites. Each sampling reach was 80 m long and was isolated with block nets (5–mm mesh) prior to sampling. After reach delimitation, physical and chemical factors characterizing instream and riparian ecotone habitats were quantified using standard methods (Tab. 1). Next, fishes were sampled from all available microhabitats within the enclosed stream reach by two collectors using a seine (1.5 x 2 m, 2–mm mesh) and dip nets (0.5 x 0.8 m, 2–mm mesh) for 1 h. Fishes were collected under Instituto Chico Mendes de Conservação da Biodiversidade permits 4355–1/2012.
All collected individuals were identified with assistance from taxonomic specialists, and voucher specimens were deposited in the Coleção de Peixes do Departamento de Zoologia e Botânica (DZSJRP 14402–14552, 14626–14731, 14733–14753, 14755–14775, 14884–14958, 14960–14999, 15001–15141, 16538–17454, 18154) at the Universidade Estadual Paulista Júlio de Mesquita Filho, São José do Rio Preto, São Paulo State, Brazil. Following species identification, we quantified ten ecomorphological traits related to habitat use, foraging, and locomotion for each species (Brejão et al., 2018Brejão GL, Hoeinghaus DJ, Pérez-Mayorga MA, Ferraz SFBB, Casatti L. Threshold responses of Amazonian stream fishes to timing and extent of deforestation. Conserv Biol. 2018; 32(4):860–71. https://doi.org/10.1111/cobi.13061
https://doi.org/10.1111/cobi.13061...
). Traits were calculated using 11 measurements from adult individuals (1–5 individuals per species, depending on availability of specimens). Measurements were linear distances (e.g., body width) or surface areas (e.g., area of the body and fins) measured to the nearest 0.01 mm with a stereomicroscope (Zeiss Discovery V12 SteREO) coupled with imaging software (Axio-Vision Zeiss) and a digital caliper.

Sampled sites and forest fragments in the Machado River basin, Brazil. The inset map of Brazil depicts the relative location of the study area (black) within the Madeira River basin (dark gray), inside the Amazon biome (light gray).
Summary of instream and riparian ecotone environmental variables, observed mean ± standard deviation, and explanation of how each variable was obtained.
Land-use classification and multimetric landscape index. Land use classification was based on Landsat 5 TM satellite images (30 x 30 m resolution) obtained and released by the National Institute for Space Research (INPE). The land use map consists of three categories: primary forest, secondary forest, and pasture. Classification was conducted using the supervised Maximum Likelihood Classification method (Jensen, 2007Jensen JR. Remote sensing of the environment: An Earth resource perspective. Pearson Prentice Hall; 2007.) and the software Erdas 9.2. Land-use change was analyzed from 1984 to 2011 at 4-year intervals and calculated using the Land-Use Change Analysis Tool (LUCAT; Ferraz et al., 2012Ferraz S, Cassiano C, Begotti R, Tranquilin A. Land use change analysis tools (LUCAT). II Congr. Bras. Ecol. Paisagens. 2012.) at the watershed and 100 m riparian buffer scales associated with each stream site. LUCAT calculates the area and proportion of the area occupied by each type of land use present in a unit of analysis. This tool also provides indices such as Forest Change Curve Profile (FCCP) and Land Use Intensity (LUI; Ferraz et al., 2009Ferraz SFDB, Vettorazzi CA, Theobald DM. Using indicators of deforestation and land-use dynamics to support conservation strategies: A case study of central Rondônia, Brazil. For Ecol Manage. 2009; 257(7):1586–95. https://doi.org/10.1016/j.foreco.2009.01.013
https://doi.org/10.1016/j.foreco.2009.01...
). FCCP represents temporal deforestation patterns, indicating when vegetation change processes occurred during the period of record. This index varies from -1 to 1, where values close to the extremes represent more significant transformations in the landscape during a short time and values close to zero represent gradual changes in land use. Positive values of FCCP indicate older changes and negative values indicate recent changes. Watersheds clustered in three groups based on FCCP values: 1) reference watersheds that were not deforested (ref; n = 18), recently deforested watersheds (new; n = 31), and historically deforested watersheds (old; n = 26). LUI complements FCCP and represents the average time since deforestation for the watershed and can be considered as an accumulated effect metric over time. Fluvial distance was quantified using the Network Analyst extension in ArcGIS, which produces a triangular matrix containing the stream distance among all sampled sites.
Following the methodology proposed by Ferraz et al., (2014)Ferraz SFB, Ferraz KMPMB, Cassiano CC, Brancalion PHS, Luz DTA, Azevedo TN et al. How good are tropical forest patches for ecosystem services provisioning? Landsc Ecol. 2014; 29(2):187–200. https://doi.org/10.1007/s10980-014-9988-z
https://doi.org/10.1007/s10980-014-9988-...
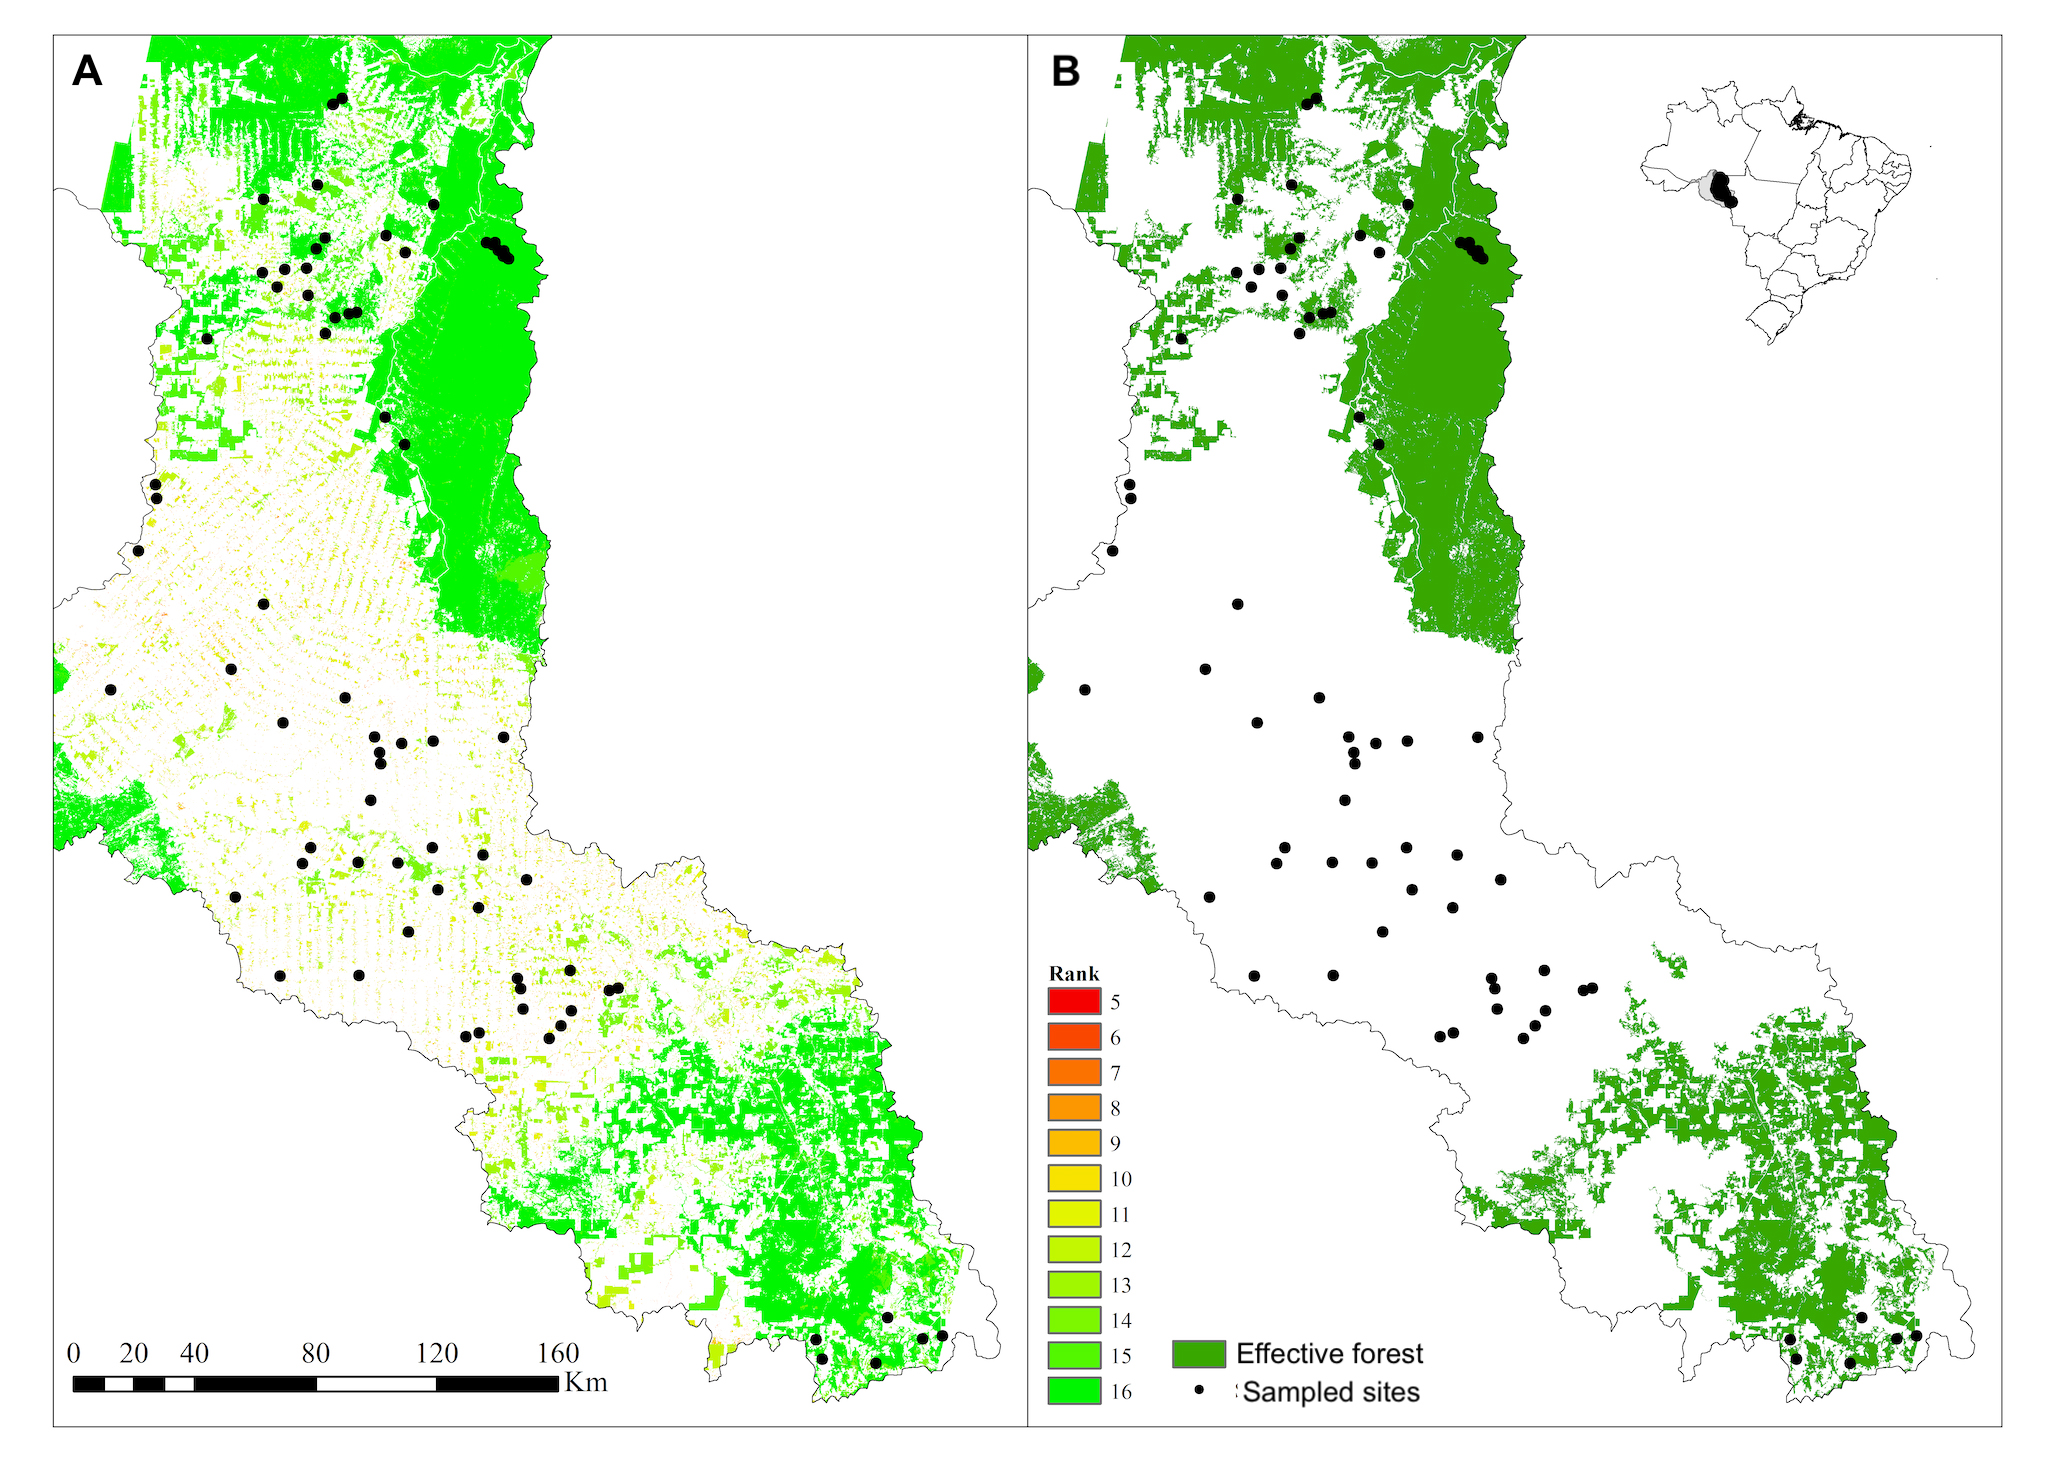
, we calculated a multimetric landscape index to estimate forest quality ranking based on landscape attributes and forest remnants structure, which scores each 1 ha pixel (100 x 100m) with forest cover in the basin at the time of sampling according to the metrics shown in Tab. 2. These metrics take into account the landscape configuration relative to the location for each pixel throughout the Machado River basin and assign each forested pixel (non-forested pixels are not scored) a value based on the effect of the deforestation process on a regional scale. For each metric, we produced a thematic map, ranking each forested pixel according to the sum operation among all thematic maps. Sum values ranged between 5 and 16 (Fig. 2A), and we determined that pixels with the highest observed aggregate metric values (15 and 16) indicate forest areas with high quality, corresponding with ancient forest with high contiguity and proximity to forested pixels located far from the patch edge. Such high-quality forest has been called effective forest, because those patches are expected to perform their ecosystem functions at an adequate level (Fig. 2B). Mean and standard deviation of effective forest at the watershed and riparian buffer scales, along with other landscape variables are summarized in Tab. 3.

Distribution of sampling sites with (A) forest patches ranked according to the forest quality multimetric index and (B) effective forest cover. Non-forested area is white and is not included in the multimetric index calculation (or legend).
Metrics used to estimate forest quality ranking based on landscape and forest patch structure (Ferraz et al., 2014Ferraz SFB, Ferraz KMPMB, Cassiano CC, Brancalion PHS, Luz DTA, Azevedo TN et al. How good are tropical forest patches for ecosystem services provisioning? Landsc Ecol. 2014; 29(2):187–200. https://doi.org/10.1007/s10980-014-9988-z
https://doi.org/10.1007/s10980-014-9988-... ).
Summary of landscape variables at the watershed and riparian zone scales (mean ± standard deviation).
Quantifying turnover. Taxonomic turnover was estimated using a null-modeling approach and a modified Raup-Crick metric for abundance data (subsequently abbreviated as βRC; Raup, Crick, 1979Raup DM, Crick RE. Measurement of faunal similarity in paleontology. J Paleontol. 1979; 53(5):1213–227. https://www.jstor.org/stable/1304099
https://www.jstor.org/stable/1304099...
; Püttker et al., 2015Püttker T, Bueno AA, Prado PI, Pardini R. Ecological filtering or random extinction? Beta-diversity patterns and the importance of niche-based and neutral processes following habitat loss. Oikos. 2015; 124(2):206–15. https://doi.org/10.1111/oik.01018
https://doi.org/10.1111/oik.01018...
). The advantage of this metric combined with the null-modeling approach is that it permits discrimination of compositional variation among local communities independently from differences in local species richness, i.e., it measures β-diversity associated exclusively with species turnover, while controlling for differences in nestedness (Chase et al., 2011Chase JM, Kraft NJB, Smith KG, Vellend M, Inouye BD. Using null models to disentangle variation in community dissimilarity from variation in α-diversity. Ecosphere. 2011; 2(2):art24. https://doi.org/10.1890/ES10-00117.1
https://doi.org/10.1890/ES10-00117.1...
; Baeten et al., 2012Baeten L, Vangansbeke P, Hermy M, Peterken G, Vanhuyse K, Verheyen K. Distinguishing between turnover and nestedness in the quantification of biotic homogenization. Biodivers Conserv. 2012; 21:1399–409. https://doi.org/10.1007/s10531-012-0251-0
https://doi.org/10.1007/s10531-012-0251-...
; Püttker et al., 2015Püttker T, Bueno AA, Prado PI, Pardini R. Ecological filtering or random extinction? Beta-diversity patterns and the importance of niche-based and neutral processes following habitat loss. Oikos. 2015; 124(2):206–15. https://doi.org/10.1111/oik.01018
https://doi.org/10.1111/oik.01018...
). The null-modeling approach measures the deviation from the expectation that the dissimilarity of the communities is stochastic (Raup, Crick, 1979Raup DM, Crick RE. Measurement of faunal similarity in paleontology. J Paleontol. 1979; 53(5):1213–227. https://www.jstor.org/stable/1304099
https://www.jstor.org/stable/1304099...
; Chase et al., 2011Chase JM, Kraft NJB, Smith KG, Vellend M, Inouye BD. Using null models to disentangle variation in community dissimilarity from variation in α-diversity. Ecosphere. 2011; 2(2):art24. https://doi.org/10.1890/ES10-00117.1
https://doi.org/10.1890/ES10-00117.1...
; Püttker et al., 2015Püttker T, Bueno AA, Prado PI, Pardini R. Ecological filtering or random extinction? Beta-diversity patterns and the importance of niche-based and neutral processes following habitat loss. Oikos. 2015; 124(2):206–15. https://doi.org/10.1111/oik.01018
https://doi.org/10.1111/oik.01018...
), which allows for evaluation of the importance of deterministic (niche-based) and stochastic (neutral) processes in community assembly (Chase et al., 2011Chase JM, Kraft NJB, Smith KG, Vellend M, Inouye BD. Using null models to disentangle variation in community dissimilarity from variation in α-diversity. Ecosphere. 2011; 2(2):art24. https://doi.org/10.1890/ES10-00117.1
https://doi.org/10.1890/ES10-00117.1...
; Püttker et al., 2015Püttker T, Bueno AA, Prado PI, Pardini R. Ecological filtering or random extinction? Beta-diversity patterns and the importance of niche-based and neutral processes following habitat loss. Oikos. 2015; 124(2):206–15. https://doi.org/10.1111/oik.01018
https://doi.org/10.1111/oik.01018...
).
Functional turnover was estimated using two distance metrics based on the functional traits matrix and species abundance data and compared with a null distribution that was generated by randomizing species identities across the community matrix (Swenson, 2011Swenson NG. Phylogenetic beta diversity metrics, trait evolution and inferring the functional beta diversity of communities. PLoS One. 2011; 6(6):e21264. https://doi.org/10.1371/journal.pone.0021264
https://doi.org/10.1371/journal.pone.002...
; Roa-Fuentes et al., 2019Roa-Fuentes CA, Heino J, Cianciaruso MV, Ferraz S, Zeni JO, Casatti L. Taxonomic, functional, and phylogenetic β-diversity patterns of stream fish assemblages in tropical agroecosystems. Freshw Biol. 2019; 64(3):447–60. https://doi.org/10.1111/fwb.13233
https://doi.org/10.1111/fwb.13233...
). The first metric calculates the mean pairwise distance (βMPD) for pairs of species functional traits sets between samples, and the second metric (βMNTD) calculates the average distance between species functional traits sets in the first sample and its nearest neighbor in the second sample. The two metrics are complementary (Swenson, 2011Swenson NG. Phylogenetic beta diversity metrics, trait evolution and inferring the functional beta diversity of communities. PLoS One. 2011; 6(6):e21264. https://doi.org/10.1371/journal.pone.0021264
https://doi.org/10.1371/journal.pone.002...
): βMPD evaluates the total dissimilarity between two communities and is sometimes considered a basal diversity metric (Swenson, 2014Swenson NG. Functional and Phylogenetic Ecology in R. New York: Springer; 2014. https://doi.org/10.1007/978-1-4614-9542-0
https://doi.org/10.1007/978-1-4614-9542-...
), whereas βMNTD is regarded as a terminal relatedness measure because it is more sensitive to variations near the tips of the phylogenetic or functional dendrogram (Webb, 2000Webb C. Exploring the phylogenetic structure of ecological communities: An example for rain forest trees. Am Nat. 2000; 156(2):145–55. https://doi.org/10.1086/303378
https://doi.org/10.1086/303378...
). The standardized effect size was calculated for each metric. In this approach, positive values of functional turnover indicate higher traits turnover than expected by species turnover, whereas negative values of functional turnover indicate lower traits turnover than expected by species turnover (Swenson, 2011Swenson NG. Phylogenetic beta diversity metrics, trait evolution and inferring the functional beta diversity of communities. PLoS One. 2011; 6(6):e21264. https://doi.org/10.1371/journal.pone.0021264
https://doi.org/10.1371/journal.pone.002...
, 2014Swenson NG. Functional and Phylogenetic Ecology in R. New York: Springer; 2014. https://doi.org/10.1007/978-1-4614-9542-0
https://doi.org/10.1007/978-1-4614-9542-...
).
Data analyses. To test the hypothesis (i) and (ii), a series of one sample t-tests was used to test if the mean value of each turnover metric between sites was significantly different from the expected value for random data (Wang et al., 2013Wang J, Shen J, Wu Y, Tu C, Soininen J, Stegen JC et al. Phylogenetic beta diversity in bacterial assemblages across ecosystems: Deterministic versus stochastic processes. ISME J. 2013; 7(7):1310–21. https://doi.org/10.1038/ismej.2013.30
https://doi.org/10.1038/ismej.2013.30...
). A distance-based approach was used to assess variation in turnover metric values in relation to environmental and spatial distances among the sampled communities (Tuomisto, Ruokolainen, 2006Tuomisto H, Ruokolainen K. Analyzing or explaining beta diversity? Understanding the targets of different methods of analysis. Ecology. 2006; 87(11):2697–708. https://doi.org/10.1890/0012-9658(2006)87[2697:AOEBDU]2.0.CO;2
https://doi.org/10.1890/0012-9658(2006)8...
). A bootstrap ANOVA test with 10,000 permutations, complemented with the post hoc test of Tuckey, using ‘lmboot’ (Heyman, 2019Heyman M. lmboot: bootstrap in linear models. R package version 0.0.1. 2019: 13.) and ‘agricolae’ (Mendiburu, 2020Mendiburu F. Agricolae: Statistical Procedures for Agricultural Research. R package version 1.3–3. 2020:155.) packages, was used to test for differences in turnover rates between stream groups (i.e., reference, recently deforested, and historically deforested). For each stream group, we applied the ‘bioenv’ function from the ‘vegan’ package (Oksanen et al., 2018Oksanen J, Blanchet FG, Friendly M, Kindt R, Legendre P, McGlinn D et al. Vegan: Community ecology package. R Package 24–6. 2018:292.) to obtain the subsets of environmental variables best correlated with community turnover (Clarke, Ainsworth, 1993Clarke KR, Ainsworth M. A method of linking multivariate community structure to environmental variables. Mar Ecol Prog Ser. 1993; 92(3):205–19. https://doi.org/10.3354/meps092205
https://doi.org/10.3354/meps092205...
) (S1). The spatial distances were obtained measuring the fluvial distance between one sampling site to all the others for each group of streams, this procedure was made with the Network Analyst, from ArcGIS 9.3. Mantel and partial Mantel tests with 10,000 permutations were used to determine the significance of variation in turnover related to environmental and spatial distances (Legendre, Legendre, 2012Legendre P, Legendre L. Numerical Ecology. Amsterdan: Elsevier; 2012.).
To test the hypothesis (iii) and (iv), multiple regression on matrices (MRM) was used to assess the relative contributions of local, watershed and network distance factors on turnover (Legendre et al., 1994Legendre P, Lapointe FJ, Casgrain P. Modeling brain evolution from behavior: a permutational regression approach. Evolution. 1994; 48(5):1487–99. https://doi.org/10.2307/2410243
https://doi.org/10.2307/2410243...
) using the ‘MRM’ function in the ‘ecodist’ package (Goslee, Urban, 2007Goslee SC, Urban DL. The ecodist package for dissimilarity-based analysis of ecological data. J Stat Softw. 2007; 22(7):1–19. https://doi.org/10.18637/jss.v022.i07
https://doi.org/10.18637/jss.v022.i07...
). We also performed a commonality analysis, which allows for the partitioning of the coefficient of determination (R2) into effects explained uniquely by each environmental predictor or environmental predictor subset – landscape or local – (Unique), and effects explained commonly by all possible combinations of environmental predictors or environmental predictor subsets (Common) (Sorice, Conner, 2010Sorice MG, Conner JR. Predicting private landowner intentions to enroll in an incentive program to protect endangered species. Hum Dimens Wildl. 2010; 15(2):77–89. https://doi.org/10.1080/10871200903551985
https://doi.org/10.1080/1087120090355198...
; Ray-Mukherjee et al., 2014Ray-Mukherjee J, Nimon K, Mukherjee S, Morris DW, Slotow R, Hamer M. Using commonality analysis in multiple regressions: A tool to decompose regression effects in the face of multicollinearity. Methods Ecol Evol. 2014; 5(4):320–28. https://doi.org/10.1111/2041-210X.12166
https://doi.org/10.1111/2041-210X.12166...
). Commonality analysis was performed and structure coefficients estimated using the ‘regr’ function in the ‘yhat’ package (Nimon et al., 2017Nimon K, Lewis M, Kane R, Haynes RM. Erratum to: An R package to compute commonality coefficients in the multiple regression case: An introduction to the package and a practical example. Behav Res Methods. 2017; 49(6):2275. https://doi.org/10.3758/s13428-017-0853-2
https://doi.org/10.3758/s13428-017-0853-...
). All the analyses were performed using R (R Development Core Team, 2014R Development Core Team. R: A language and environment for statistical computing. Vienna, Austria: R Foundation for Statistical Computing; 2014.).
RESULTS
In total for the 75 stream communities sampled, we collected 22,851 individuals belonging to 138 species, 30 families and six orders (S1 and S2). In all cases, mean turnover differed from the expected value of zero (P < 0.05, Fig. 3, S3). Mean values for taxonomic turnover were greater than zero, indicating higher species turnover than expected by chance (Fig. 3). In contrast, functional turnover had mean values less than zero, indicating that functional turnover was lower than the expected given the observed values for taxonomic turnover (Fig. 3; S4).
Turnover increased with environmental distance for all turnover metrics for both taxonomic and functional datasets (Tab. 4). That is, there was a significant distance-decay relationship between community and environmental similarity. Even after controlling for stream network distance, all turnover standardized effect sizes remained significantly correlated with environmental distance (Tab. 4). On the other hand, distance-decay relationships between pairwise turnover and stream network distance were significant for all taxonomic turnover metrics but only for functional turnover in streams with recently deforested watersheds (ses.β.MNTD.new; Tab. 4). After controlling for environmental distance, stream network distance was correlated with taxonomic turnover metrics for all streams together, streams with recently deforested watersheds and streams with historically deforested watersheds, but not reference streams (ses.β.RC.all, ses.β.RC.new and ses.β.RC.old; Tab. 4).

Standardized effect sizes for each taxonomic and functional turnover metric (mean and 95% confidence intervals). RC = Raup-Crick; MPD = mean pairwise distance; MNTD = mean nearest taxon distance; ref = streams with forested watersheds; new = streams with recently deforested watersheds; old = streams with historically deforested watersheds.
Mantel and partial Mantel tests for the correlation between standardized effect size (ses) of turnover metrics and predictor distances (environment and network) using Pearson’s correlation (ρ), with 10,000 permutations. Significant values in bold: *** P < 0.001; ** P < 0.01; * P < 0.05.
In comparisons among stream groups, taxonomic turnover (βRC) was different between streams with forested watersheds and streams with recently deforested watersheds (P = 0.021), but not for other comparisons (P > 0.05; Fig. 3). For functional turnover, we detected significant differences in βMPD between streams with forested watersheds and streams with recently deforested watersheds (P < 0.001) and also historically deforested watersheds (P = 0.005; Fig. 3). There was no difference in βMPD between streams with recently and historically deforested watersheds (P > 0.05; Fig. 3). For βMNTD, functional turnover was different between streams with forested watersheds and streams with recently deforested watersheds (P < 0.001; Fig. 3). In contrast with βMPD, βMNTD was different between streams with recently and historically deforested watersheds (P = 0.016), but not different between streams with forested watersheds and streams with historically deforested watersheds (P > 0.05; Fig. 3).
The results of MRM and commonality analysis indicate that variation in the environment-turnover relationship for streams with deforested watersheds was explained by both local- and watershed-scale variables, whereas only local scale variables explained variation in the environment-turnover relationship for streams with forested watersheds (S5; Fig. 4). That said, environment-turnover relationships were mostly weak, though significant, for all streams (R2 ≤ 0.14; P < 0.001; S5) and for streams with recently deforested watersheds (R2 ≤ 0.20; P < 0.001; S5). Streams with forested watersheds, on the other hand, had stronger environmental-turnover relationships than observed for other groups (R2 = 0.28–0.44; P < 0.001; S5). Environment-turnover relationships varied across metrics for streams with historically deforested watersheds; taxonomic turnover was weakly correlated (R2 = 0.11; P < 0.001; S5) and functional turnover was slightly more strongly related with environmental factors (R2 ≥ 0.26; P < 0.001; S5).

Explained variation of environmental contribution in turnover metrics partitioned by MRM and associated commonality analysis into pure local, shared and pure catchment components. RC = Raup-Crick; MPD = mean pairwise distance; MNTD = mean nearest taxon distance; all = all sampled streams; ref = streams with forested watersheds; new = streams with recently deforested watersheds; old = streams with historically deforested watersheds.
DISCUSSION
For all comparisons in this study, mean turnover was different than expected by chance, indicating that deterministic processes are structuring these stream fish assemblages. That said, the pattern of turnover differed between analyses based on taxonomy and functional trait-based approaches. Specifically, turnover was higher than expected by chance in taxonomic analyses, whereas functional turnover was lower than expected given the values for taxonomic turnover. Thus, assemblages are taxonomically dissimilar but functionally similar, indicating that species turnover is occurring primarily among functionally equivalent species, which leads to infer to a functional redundancy concerning the use of habitat, foraging and locomotion.
We also observed meaningful differences among the three stream groups. Taxonomic turnover was different among streams with recently deforested watersheds compared with streams with forested watersheds. Functional turnover was different among streams with forested watersheds compared with either streams with recently deforested or historically deforested watersheds for βMPD. In comparison, functional turnover was different among streams with recently deforested watersheds than either streams with forested or historically deforested watersheds for βMNTD. As such, both our first and second hypotheses were partially supported, though the patterns in turnover were more complex than anticipated. Observed patterns of turnover among streams with forested watersheds was driven by local-scale environmental variables only, whereas turnover among streams with deforested watersheds, whether recently or historically deforested, was driven by a combination of local- and watershed-scale environmental variables, supporting our third hypothesis (S3). Finally, in most cases the above patterns differed between analyses using taxonomic and functional data, supporting our fourth hypothesis.
The observed pattern of taxonomic turnover exceeding the level expected by chance could indicate that this fish assemblage is being structured by the disturbance (Baselga, 2010Baselga A. Partitioning the turnover and nestedness components of beta diversity. Global Ecol Biogeogr. 2010; 19(1):134–43. https://doi.org/10.1111/j.1466-8238.2009.00490.x
https://doi.org/10.1111/j.1466-8238.2009...
), with the dominant species in local assemblages differing among deforested sites (Püttker et al., 2015Püttker T, Bueno AA, Prado PI, Pardini R. Ecological filtering or random extinction? Beta-diversity patterns and the importance of niche-based and neutral processes following habitat loss. Oikos. 2015; 124(2):206–15. https://doi.org/10.1111/oik.01018
https://doi.org/10.1111/oik.01018...
; Siqueira et al., 2015Siqueira T, Lacerda CGT, Saito VS. How does landscape modification induce biological homogenization in tropical stream metacommunities? Biotropica. 2015; 47(4):509–16. https://doi.org/10.1111/btp.12224
https://doi.org/10.1111/btp.12224...
), and localy rare species differing among forested sites (Pérez-Mayorga et al., 2017Pérez-Mayorga MA, Casatti L, Teresa FB, Brejão GL. Shared or distinct responses between intermediate and satellite stream fish species in an altered Amazonian River? Environ Biol Fishes. 2017; 100(12):1527–41. https://doi.org/10.1007/s10641-017-0663-5
https://doi.org/10.1007/s10641-017-0663-...
). If we consider that resource gradients or patch types generate differences in the local demography of species (Leibold et al., 2004Leibold MA, Holyoak M, Mouquet N, Amarasekare P, Chase JM, Hoopes MF et al. The metacommunity concept: a framework for multi-scale community ecology. Ecol Lett. 2004; 7(7):601–13. https://doi.org/10.1111/j.1461-0248.2004.00608.x
https://doi.org/10.1111/j.1461-0248.2004...
), it is expected that each site had unique levels of species abundances (Janzen, Schoener, 1968Janzen DH, Schoener TW. Differences in insect abundance and diversity between wetter and drier sites during a tropical dry season. Ecology. 1968; 49(1):96–110. https://doi.org/10.2307/1933565
https://doi.org/10.2307/1933565...
; Tucker et al., 2016Tucker CM, Shoemaker LG, Davies KF, Nemergut DR, Melbourne BA. Differentiating between niche and neutral assembly in metacommunities using null models of β-diversity. Oikos. 2016; 125(6):778–89. https://doi.org/10.1111/oik.02803
https://doi.org/10.1111/oik.02803...
). Higher species turnover found in recently deforested sites may be associated with the emergence of novel niches, due to the initial consequences of deforestation (i.e., changes in flow complexity, depth, substrate composition, stream bank stability, and emergence of marginal grasses) while still retaining relict structures and microhabitats found in pristine streams with forested watersheds (i.e., fine roots, litter packs, branches, and trunks derived from the riparian forest) (Pérez-Mayorga et al., 2017Pérez-Mayorga MA, Casatti L, Teresa FB, Brejão GL. Shared or distinct responses between intermediate and satellite stream fish species in an altered Amazonian River? Environ Biol Fishes. 2017; 100(12):1527–41. https://doi.org/10.1007/s10641-017-0663-5
https://doi.org/10.1007/s10641-017-0663-...
). This novel environmental scenario could allow for the beginning of the colonization and establishment process of tolerant species while sensitive species are still occupying relict habitat structure from the previous condition (i.e., time lags). Applying an approach based on site occupancy by fish species to study the same stream system, Pérez-Mayorga et al., (2017)Pérez-Mayorga MA, Casatti L, Teresa FB, Brejão GL. Shared or distinct responses between intermediate and satellite stream fish species in an altered Amazonian River? Environ Biol Fishes. 2017; 100(12):1527–41. https://doi.org/10.1007/s10641-017-0663-5
https://doi.org/10.1007/s10641-017-0663-...
identified two processes structuring this metacommunity: while intermediate species are explained only by dispersal-based processes, the satellite species are explained mainly by niche-based but also by dispersal-based processes. It is interesting to observe that within these two groups we found species both sensitive to and tolerant to deforestation. Thus, the presence of a fish species in a site with a deforested watershed can be independent of its dispersal or colonization ability (i.e., could be a relict from the pre-deforestation condition); these findings reinforce the possibility of an ongoing colonization-establishment process occurring in streams with recently deforested watersheds. Likewise, our results reinforce the dispersal importance for the stream fish assemblages structuring. Specifically, the dispersal was very important for the taxonomic dimension but not so far for the functional dimension, probably indicating that taxonomically distinct species could be dispersing between sites but their set of functional traits are very similar.
In general, land use intensity reduces dissimilarity among local communities (i.e., reduces turnover); this process of biotic homogenization is driven by the loss of sensitive species and gradual increase in abundances of tolerant species (Brejão et al., 2018Brejão GL, Hoeinghaus DJ, Pérez-Mayorga MA, Ferraz SFBB, Casatti L. Threshold responses of Amazonian stream fishes to timing and extent of deforestation. Conserv Biol. 2018; 32(4):860–71. https://doi.org/10.1111/cobi.13061
https://doi.org/10.1111/cobi.13061...
; Roa-Fuentes et al., 2019Roa-Fuentes CA, Heino J, Cianciaruso MV, Ferraz S, Zeni JO, Casatti L. Taxonomic, functional, and phylogenetic β-diversity patterns of stream fish assemblages in tropical agroecosystems. Freshw Biol. 2019; 64(3):447–60. https://doi.org/10.1111/fwb.13233
https://doi.org/10.1111/fwb.13233...
). Surprisingly, taxonomic turnover did not differ between groups of streams with forested and historically deforested watersheds, and turnover in both groups was lower than that found among streams with recently deforested watersheds. According to the landscape divergence hypothesis (Laurance et al., 2007Laurance WF, Nascimento HEM, Laurance SG, Andrade A, Ewers RM, Harms KE et al. Habitat fragmentation, variable edge effects, and the landscape-divergence hypothesis. PLoS One. 2007; 2(10):e1017. https://doi.org/10.1371/journal.pone.0001017
https://doi.org/10.1371/journal.pone.000...
), disturbed areas are likely to diverge in species composition because of differences in the effects of disturbance, or in how disturbances processes interact with underlying differences in environmental heterogeneity (Arroyo-Rodríguez et al., 2013Arroyo-Rodríguez V, Rös M, Escobar F, Melo FPL, Santos BA, Tabarelli M et al. Plant β-diversity in fragmented rain forests: Testing floristic homogenization and differentiation hypotheses. J Ecol. 2013; 101(6):1449–458. https://doi.org/10.1111/1365-2745.12153
https://doi.org/10.1111/1365-2745.12153...
). Land use intensity measures the trajectory of land use changes in a given area (Ferraz et al., 2009Ferraz SFDB, Vettorazzi CA, Theobald DM. Using indicators of deforestation and land-use dynamics to support conservation strategies: A case study of central Rondônia, Brazil. For Ecol Manage. 2009; 257(7):1586–95. https://doi.org/10.1016/j.foreco.2009.01.013
https://doi.org/10.1016/j.foreco.2009.01...
), while effective forest measures the quality of the forest remnants along the landscape (Ferraz et al., 2014Ferraz SFB, Ferraz KMPMB, Cassiano CC, Brancalion PHS, Luz DTA, Azevedo TN et al. How good are tropical forest patches for ecosystem services provisioning? Landsc Ecol. 2014; 29(2):187–200. https://doi.org/10.1007/s10980-014-9988-z
https://doi.org/10.1007/s10980-014-9988-...
). Interestingly, taxonomic turnover in recently deforested streams was associated with land use intensity in the basin, indicating that the assemblage structure of these sites is still under the influence of the trajectory of change, and that they are probably going through a moment of population reduction of sensitive species and increase in abundance of tolerant species. On the other hand, the taxonomic turnover in historically deforested watersheds associated with the amount of effective forest in the watershed indicates that the permanence of old-growth forest is important to prevent total homogenization of the local habitat, allowing species substitution to still occur between streams.
Usually, forested sites have higher differences in species abundances among sites (β-diversity) than agricultural landscapes (Karp et al., 2012Karp DS, Rominger AJ, Zook J, Ranganathan J, Ehrlich PR, Daily GC. Intensive agriculture erodes β-diversity at large scales. Ecol Lett. 2012; 15(9):963–70. https://doi.org/10.1111/j.1461-0248.2012.01815.x
https://doi.org/10.1111/j.1461-0248.2012...
; Siqueira et al., 2015Siqueira T, Lacerda CGT, Saito VS. How does landscape modification induce biological homogenization in tropical stream metacommunities? Biotropica. 2015; 47(4):509–16. https://doi.org/10.1111/btp.12224
https://doi.org/10.1111/btp.12224...
; Solar et al., 2015Solar RRC, Barlow J, Ferreira J, Berenguer E, Lees AC, Thomson JR et al. How pervasive is biotic homogenization in human-modified tropical forest landscapes? Ecol Lett. 2015; 18(10):1108–18. https://doi.org/10.1111/ele.12494
https://doi.org/10.1111/ele.12494...
), but agricultural intensification may lead to higher β-diversity in high-intensity agriculture patches than that found in forest and low-intensity agriculture patches (Karp et al., 2012Karp DS, Rominger AJ, Zook J, Ranganathan J, Ehrlich PR, Daily GC. Intensive agriculture erodes β-diversity at large scales. Ecol Lett. 2012; 15(9):963–70. https://doi.org/10.1111/j.1461-0248.2012.01815.x
https://doi.org/10.1111/j.1461-0248.2012...
). Each fish species response to the extent and time since deforestation is distinct, where sensitive species abundance decreases and tolerant species abundance increases over the time since the impact (Brejão et al., 2018Brejão GL, Hoeinghaus DJ, Pérez-Mayorga MA, Ferraz SFBB, Casatti L. Threshold responses of Amazonian stream fishes to timing and extent of deforestation. Conserv Biol. 2018; 32(4):860–71. https://doi.org/10.1111/cobi.13061
https://doi.org/10.1111/cobi.13061...
). The abundance structure in streams with recently deforested watersheds is likely to be highly variable (see the abrupt increase in abundance of Serrapinnus microdon and S. notomelas, S1), driven by the dynamic filtering of changing environmental conditions (Connell, 1978Connell JH. Diversity in tropical rain forests and coral reefs. Science. 1978; 199(4335):1302–10. https://doi.org/10.1126/science.199.4335.1302
https://doi.org/10.1126/science.199.4335...
; Leibold et al., 2004Leibold MA, Holyoak M, Mouquet N, Amarasekare P, Chase JM, Hoopes MF et al. The metacommunity concept: a framework for multi-scale community ecology. Ecol Lett. 2004; 7(7):601–13. https://doi.org/10.1111/j.1461-0248.2004.00608.x
https://doi.org/10.1111/j.1461-0248.2004...
). High taxonomic turnover among streams with recently deforested watersheds could explain the weak relationship between species/traits and environmental conditions for this group. On the other hand, in streams with forested and historically deforested watersheds, the abundance structure and species turnover may be more stable when compared with streams from recently deforested watersheds, either due to the absence of disturbance or consolidation of disturbance. For example, see Hyphessobrycon agulha and Gymnorhamphichthys rondoni in streams with forested watersheds and Bryconops caudomaculatus and Creagrutus petilus in streams with historically deforested watersheds (S1).
Functional turnover was lower than expected by chance given the observed species turnover, indicating that variation between two communities occurs mainly within groups of functionally similar species (Swenson, 2011Swenson NG. Phylogenetic beta diversity metrics, trait evolution and inferring the functional beta diversity of communities. PLoS One. 2011; 6(6):e21264. https://doi.org/10.1371/journal.pone.0021264
https://doi.org/10.1371/journal.pone.002...
; Swenson, 2014Swenson NG. Functional and Phylogenetic Ecology in R. New York: Springer; 2014. https://doi.org/10.1007/978-1-4614-9542-0
https://doi.org/10.1007/978-1-4614-9542-...
). Large functional overlap could explain the low level of functional turnover, with frequent species replacements occurring mostly between functionally redundant species (Villéger et al., 2013Villéger S, Grenouillet G, Brosse S. Decomposing functional β-diversity reveals that low functional β-diversity is driven by low functional turnover in European fish assemblages. Glob Ecol Biogeogr. 2013; 22(6):671–81. https://doi.org/10.1111/geb.12021
https://doi.org/10.1111/geb.12021...
). In our study system, two species with similar traits (Farlowella cf. oxyrryncha and Gymnorhamphichthys rondoni) are shared by the three groups of streams and are located in the extremes of the functional space, thus making a large contribution to functional diversity, especially in streams with deforested watersheds (S6 and S7; Bordignon, 2017Bordignon CR. O papel das espécies raras na ictiofauna de riachos tropicais em diferentes condições de florestas e escalas. [Master Dissertation]. São José do Rio Preto: Universidade Estadual Paulista “Júlio de Mesquita Filho”; 2017.). The morphological aspects of these species allow them to explore specific niches and structures closely related to the riparian forest. Due to its thin and elongated body, together with its brown coloration, Farlowella resemble small tree branches (Covain, Fisch-Muller, 2007Covain R, Fisch-Muller S. The genera of the Neotropical armored catfish subfamily Loricariinae (Siluriformes: Loricariidae): A practical key and synopsis. Zootaxa. 2007; 40(1462):1–40. https://www.mapress.com/j/zt/article/view/zootaxa.1462.1.1
https://www.mapress.com/j/zt/article/vie...
), and they are usually found foraging, grazing the periphyton, among similar structures (Brejão et al., 2013Brejão GL, Gerhard P, Zuanon J. Functional trophic composition of the ichthyofauna of forest streams in eastern Brazilian Amazon. Neotrop Ichthyol. 2013; 11(2):361–73. https://doi.org/10.1590/S1679-62252013005000006
https://doi.org/10.1590/S1679-6225201300...
). Gymnorhamphichthys rondoni is a species with psammophilic habit, using its long snout and electric field to probe sand and leaf litter substrates, looking for small invertebrates during the night and burying itself in the sandy substrate during the day (Zuanon et al., 2006Zuanon J, Bockmann FA, Sazima I. A remarkable sand-dwelling fish assemblage from central Amazonia, with comments on the evolution of psammophily in South American freshwater fishes. Neotrop Ichthyol. 2006; 4(1):107–18. https://doi.org/10.1590/S1679-62252006000100012
https://doi.org/10.1590/S1679-6225200600...
; Brejão et al., 2013Brejão GL, Gerhard P, Zuanon J. Functional trophic composition of the ichthyofauna of forest streams in eastern Brazilian Amazon. Neotrop Ichthyol. 2013; 11(2):361–73. https://doi.org/10.1590/S1679-62252013005000006
https://doi.org/10.1590/S1679-6225201300...
). The presence of these species in all groups of streams is probably buffering the overlap of functional space between fish communities, explaining low rates of functional turnover when we have high rates of taxonomic turnover.
Although environment-turnover relationships were mostly weak, it is interesting that turnover metrics are mainly related to instream habitat complexity indicators (i.e., litter packs, fine roots, and trees in the stream margin) and forest quality at the watershed and riparian buffer scales. Landscape modifications are known to influence the physical and chemical characteristics of streams (Gorman, Karr, 1978Gorman O, Karr J. Habitat structure and stream fish communities. Ecology. 1978; 59(3):507–15. https://doi.org/10.2307/1936581
https://doi.org/10.2307/1936581...
; Cruz et al., 2013Cruz BB, Miranda LE, Cetra M. Links between riparian landcover, instream environment and fish assemblages in headwater streams of south-eastern Brazil. Ecol Freshw Fish. 2013; 22(4):607–16. https://doi.org/10.1111/eff.12065
https://doi.org/10.1111/eff.12065...
; Siqueira et al., 2015Siqueira T, Lacerda CGT, Saito VS. How does landscape modification induce biological homogenization in tropical stream metacommunities? Biotropica. 2015; 47(4):509–16. https://doi.org/10.1111/btp.12224
https://doi.org/10.1111/btp.12224...
; Leal et al., 2016Leal CG, Pompeu PS, Gardner TA, Leitão RP, Hughes RM, Kaufmann PR et al. Multi-scale assessment of human-induced changes to Amazonian instream habitats. Landsc Ecol. 2016; 31(8):1725–45. https://doi.org/10.1007/s10980-016-0358-x
https://doi.org/10.1007/s10980-016-0358-...
), thereby indirectly affecting many of the ecological processes occurring in streams (Wright, Flecker, 2004Wright JP, Flecker AS. Deforesting the riverscape: the effects of wood on fish diversity in a Venezuelan piedmont stream. Biol Conserv. 2004; 120(3):439–47. https://doi.org/10.1016/j.biocon.2004.02.022
https://doi.org/10.1016/j.biocon.2004.02...
; Paula et al., 2011Paula FR, Ferraz SFB, Gerhard P, Vettorazzi CA, Ferreira A. Large woody debris input and its influence on channel structure in agricultural lands of southeast Brazil. Environ Manage. 2011; 48(4):750–63. https://doi.org/10.1007/s00267-011-9730-4
https://doi.org/10.1007/s00267-011-9730-...
). Maintaining pristine forest remnants associated with landscape complexity and connectivity may extend the prevalence of sensitive species with unique functional traits across the landscape, contributing to the taxonomic and functional integrity of these stream communities.
Although highly impacted by deforestation activities, the study region still retains a diverse regional fish species pool with a large proportion of rare species (see Bordignon, 2017Bordignon CR. O papel das espécies raras na ictiofauna de riachos tropicais em diferentes condições de florestas e escalas. [Master Dissertation]. São José do Rio Preto: Universidade Estadual Paulista “Júlio de Mesquita Filho”; 2017.). As described above, our analyses indicate that rare species turnover has only a minor contribution to functional turnover due to high functional redundancy in the species pool. In contrast, assemblages from agroecosystem streams with a long history of impact are characterized by a simplified regional species pool composed mostly by tolerant species with a common set of traits (e.g., Casatti et al., 2015Casatti L, Teresa FB, Zeni JDO, Ribeiro MD, Brejão GL, Ceneviva-Bastos M. More of the same: High functional redundancy in stream fish assemblages from tropical agroecosystems. Environ Manage. 2015:1300–314. https://doi.org/10.1007/s00267-015-0461-9
https://doi.org/10.1007/s00267-015-0461-...
; Zeni et al., 2017Zeni JO, Hoeinghaus DJ, Casatti L. Effects of pasture conversion to sugarcane for biofuel production on stream fish assemblages in tropical agroecosystems. Freshw Biol. 2017; 62(12):2026–38. https://doi.org/10.1111/fwb.13047
https://doi.org/10.1111/fwb.13047...
), and rare species with unique sets of traits contribute disproportionately to the functional turnover of these communities (Roa-Fuentes et al., 2019Roa-Fuentes CA, Heino J, Cianciaruso MV, Ferraz S, Zeni JO, Casatti L. Taxonomic, functional, and phylogenetic β-diversity patterns of stream fish assemblages in tropical agroecosystems. Freshw Biol. 2019; 64(3):447–60. https://doi.org/10.1111/fwb.13233
https://doi.org/10.1111/fwb.13233...
). Our results do not clearly indicate if the same outcome is expected over time for this region. However, our approach allowed us to assess effects of deforestation and time since deforestation on taxonomic and functional turnover among fish assemblages, and suggest that besides being scale-dependent (Karp et al., 2012Karp DS, Rominger AJ, Zook J, Ranganathan J, Ehrlich PR, Daily GC. Intensive agriculture erodes β-diversity at large scales. Ecol Lett. 2012; 15(9):963–70. https://doi.org/10.1111/j.1461-0248.2012.01815.x
https://doi.org/10.1111/j.1461-0248.2012...
), turnover patterns are also likely dependent on land use dynamics and involve time lags.
ACKNOWLEDGEMENTS
We are grateful to members of the Ichthyology Laboratory from UNESP (A. R. Manzotti and F. R. Carvalho), the UNIR crew (I. D. Costa, V. Bressan, and W. Nogueira), and F. Rossetti de Paula for their help during fieldwork; to ICMBio for the sampling permit (4355–1/2012); to SEDAM and to the rubber gatherers associations for permission to carry out the surveys in the areas of RESEX (Rio Preto-Jacundá, Castanheira, and Aquariquara); and to landowners for permission to conduct research on their properties. GLB is supported by Fundação de Amparo à Pesquisa do Estado de São Paulo, FAPESP (2012/21916–0, 2015/05827–6, and 2018/11954–9). CARF receives research support from Universidad Pedagógica y Tecnológica de Colombia, UPTC (Research calls: VIE 07–2020 and VIE 02–2021; Research projects codes: SGI–2908 and SGI–3100). MAPM receives research support from Ministerio de Ciencia, Tecnología e Innovación, MinCiencias and UPTC (Research call: # 848–2019; Research project code: SGI–3000). SFBF is supported by FAPESP (2009/12318–0). LC is supported by FAPESP (2010/17494-8) and CNPq (301877/2017–3).
REFERENCES
- Anderson MJ, Crist TO, Chase JM, Vellend M, Inouye BD, Freestone AL et al Navigating the multiple meanings of β diversity: a roadmap for the practicing ecologist. Ecol Lett. 2011; 14(1):19–28. https://doi.org/10.1111/j.1461-0248.2010.01552.x
» https://doi.org/10.1111/j.1461-0248.2010.01552.x - Arroyo-Rodríguez V, Rös M, Escobar F, Melo FPL, Santos BA, Tabarelli M et al Plant β-diversity in fragmented rain forests: Testing floristic homogenization and differentiation hypotheses. J Ecol. 2013; 101(6):1449–458. https://doi.org/10.1111/1365-2745.12153
» https://doi.org/10.1111/1365-2745.12153 - Baeten L, Vangansbeke P, Hermy M, Peterken G, Vanhuyse K, Verheyen K. Distinguishing between turnover and nestedness in the quantification of biotic homogenization. Biodivers Conserv. 2012; 21:1399–409. https://doi.org/10.1007/s10531-012-0251-0
» https://doi.org/10.1007/s10531-012-0251-0 - Baselga A. Partitioning the turnover and nestedness components of beta diversity. Global Ecol Biogeogr. 2010; 19(1):134–43. https://doi.org/10.1111/j.1466-8238.2009.00490.x
» https://doi.org/10.1111/j.1466-8238.2009.00490.x - Baselga A, Bonthoux S, Balent G. Temporal beta diversity of bird assemblages in agricultural landscapes: Land cover change vs. stochastic processes. PLoS One. 2015; 10(5):e0127913. https://doi.org/10.1371/journal.pone.0127913
» https://doi.org/10.1371/journal.pone.0127913 - Bojsen BH, Barriga R. Effects of deforestation on fish community structure in Ecuadorian Amazon streams. Freshwater Biol. 2002; 47:2246–60. https://doi.org/10.1046/j.1365-2427.2002.00956.x
» https://doi.org/10.1046/j.1365-2427.2002.00956.x - Bordignon CR. O papel das espécies raras na ictiofauna de riachos tropicais em diferentes condições de florestas e escalas. [Master Dissertation]. São José do Rio Preto: Universidade Estadual Paulista “Júlio de Mesquita Filho”; 2017.
- Brejão GL, Gerhard P, Zuanon J. Functional trophic composition of the ichthyofauna of forest streams in eastern Brazilian Amazon. Neotrop Ichthyol. 2013; 11(2):361–73. https://doi.org/10.1590/S1679-62252013005000006
» https://doi.org/10.1590/S1679-62252013005000006 - Brejão GL, Hoeinghaus DJ, Pérez-Mayorga MA, Ferraz SFBB, Casatti L. Threshold responses of Amazonian stream fishes to timing and extent of deforestation. Conserv Biol. 2018; 32(4):860–71. https://doi.org/10.1111/cobi.13061
» https://doi.org/10.1111/cobi.13061 - Casatti L, Teresa FB, Zeni JDO, Ribeiro MD, Brejão GL, Ceneviva-Bastos M. More of the same: High functional redundancy in stream fish assemblages from tropical agroecosystems. Environ Manage. 2015:1300–314. https://doi.org/10.1007/s00267-015-0461-9
» https://doi.org/10.1007/s00267-015-0461-9 - Chase JM, Kraft NJB, Smith KG, Vellend M, Inouye BD. Using null models to disentangle variation in community dissimilarity from variation in α-diversity. Ecosphere. 2011; 2(2):art24. https://doi.org/10.1890/ES10-00117.1
» https://doi.org/10.1890/ES10-00117.1 - Clarke KR, Ainsworth M. A method of linking multivariate community structure to environmental variables. Mar Ecol Prog Ser. 1993; 92(3):205–19. https://doi.org/10.3354/meps092205
» https://doi.org/10.3354/meps092205 - Connell JH. Diversity in tropical rain forests and coral reefs. Science. 1978; 199(4335):1302–10. https://doi.org/10.1126/science.199.4335.1302
» https://doi.org/10.1126/science.199.4335.1302 - Covain R, Fisch-Muller S. The genera of the Neotropical armored catfish subfamily Loricariinae (Siluriformes: Loricariidae): A practical key and synopsis. Zootaxa. 2007; 40(1462):1–40. https://www.mapress.com/j/zt/article/view/zootaxa.1462.1.1
» https://www.mapress.com/j/zt/article/view/zootaxa.1462.1.1 - Cruz BB, Miranda LE, Cetra M. Links between riparian landcover, instream environment and fish assemblages in headwater streams of south-eastern Brazil. Ecol Freshw Fish. 2013; 22(4):607–16. https://doi.org/10.1111/eff.12065
» https://doi.org/10.1111/eff.12065 - Dwire KA, Lowrance RR. Riparian ecosystems and buffers – multiscale structure, function, and management: introduction. J Am Water Resour As. 2006; 42(1):1–04. https://doi.org/10.1111/j.1752-1688.2006.tb03817.x
» https://doi.org/10.1111/j.1752-1688.2006.tb03817.x - Erős T, Lowe WH. The Landscape ecology of rivers: From patch-based to spatial network analyses. Curr Lands Ecol Rep. 2019; 4(4):103–12. https://doi.org/10.1007/s40823-019-00044-6
» https://doi.org/10.1007/s40823-019-00044-6 - Fernandes LC, Guimarães SCP. Atlas geoambiental de Rondônia. SEDAM; 2002.
- Ferraz S, Cassiano C, Begotti R, Tranquilin A. Land use change analysis tools (LUCAT). II Congr. Bras. Ecol. Paisagens. 2012.
- Ferraz SFB, Ferraz KMPMB, Cassiano CC, Brancalion PHS, Luz DTA, Azevedo TN et al How good are tropical forest patches for ecosystem services provisioning? Landsc Ecol. 2014; 29(2):187–200. https://doi.org/10.1007/s10980-014-9988-z
» https://doi.org/10.1007/s10980-014-9988-z - Ferraz SFDB, Vettorazzi CA, Theobald DM. Using indicators of deforestation and land-use dynamics to support conservation strategies: A case study of central Rondônia, Brazil. For Ecol Manage. 2009; 257(7):1586–95. https://doi.org/10.1016/j.foreco.2009.01.013
» https://doi.org/10.1016/j.foreco.2009.01.013 - Gorman O, Karr J. Habitat structure and stream fish communities. Ecology. 1978; 59(3):507–15. https://doi.org/10.2307/1936581
» https://doi.org/10.2307/1936581 - Goslee SC, Urban DL. The ecodist package for dissimilarity-based analysis of ecological data. J Stat Softw. 2007; 22(7):1–19. https://doi.org/10.18637/jss.v022.i07
» https://doi.org/10.18637/jss.v022.i07 - Harding JS, Benfield EF, Bolstad P V, Helfman GS, Jones EB. Stream biodiversity: the ghost of land use past. Proc Natl Acad Sci USA. 1998; 95(25):14843–847. https://www.pnas.org/content/95/25/14843
» https://www.pnas.org/content/95/25/14843 - Heyman M. lmboot: bootstrap in linear models. R package version 0.0.1. 2019: 13.
- Hoeinghaus DJ, Winemiller KO, Birnbaum JS. Local and regional determinants of stream fish assemblage structure: inferences based on taxonomic vs. functional groups. J Biogeogr. 2007; 34(2):324–38. https://doi.org/10.1111/j.1365-2699.2006.01587.x
» https://doi.org/10.1111/j.1365-2699.2006.01587.x - Hynes HBN. The stream and its valley. Int Ver Theor Angew Limnol. 1975; 19(1):1–15. https://doi.org/10.1080/03680770.1974.11896033
» https://doi.org/10.1080/03680770.1974.11896033 - Iwata T, Nakano S, Inoue M. Impacts of past riparian deforestation on stream communities in a tropical rain forest in Borneo. Ecol Appl. 2003; 13(2):461–73. https://doi.org/10.1890/1051-0761(2003)013[0461:IOPRDO]2.0.CO;2
» https://doi.org/10.1890/1051-0761(2003)013[0461:IOPRDO]2.0.CO;2 - Janzen DH, Schoener TW. Differences in insect abundance and diversity between wetter and drier sites during a tropical dry season. Ecology. 1968; 49(1):96–110. https://doi.org/10.2307/1933565
» https://doi.org/10.2307/1933565 - Jensen JR. Remote sensing of the environment: An Earth resource perspective. Pearson Prentice Hall; 2007.
- Karp DS, Rominger AJ, Zook J, Ranganathan J, Ehrlich PR, Daily GC. Intensive agriculture erodes β-diversity at large scales. Ecol Lett. 2012; 15(9):963–70. https://doi.org/10.1111/j.1461-0248.2012.01815.x
» https://doi.org/10.1111/j.1461-0248.2012.01815.x - Krusche A, Ballester M, Victoria R, Bernardes M, Leite N, Hanada L et al Efeitos das mudanças do uso da terra na biogeoquímica dos corpos d’água da bacia do rio Ji-Paraná, Rondônia. Acta Amaz. 2005; 35(2):197–205. https://doi.org/10.1590/S0044-59672005000200009
» https://doi.org/10.1590/S0044-59672005000200009 - Laurance WF, Nascimento HEM, Laurance SG, Andrade A, Ewers RM, Harms KE et al Habitat fragmentation, variable edge effects, and the landscape-divergence hypothesis. PLoS One. 2007; 2(10):e1017. https://doi.org/10.1371/journal.pone.0001017
» https://doi.org/10.1371/journal.pone.0001017 - Leal CG, Pompeu PS, Gardner TA, Leitão RP, Hughes RM, Kaufmann PR et al Multi-scale assessment of human-induced changes to Amazonian instream habitats. Landsc Ecol. 2016; 31(8):1725–45. https://doi.org/10.1007/s10980-016-0358-x
» https://doi.org/10.1007/s10980-016-0358-x - Legendre P, Lapointe FJ, Casgrain P. Modeling brain evolution from behavior: a permutational regression approach. Evolution. 1994; 48(5):1487–99. https://doi.org/10.2307/2410243
» https://doi.org/10.2307/2410243 - Legendre P, Legendre L. Numerical Ecology. Amsterdan: Elsevier; 2012.
- Leibold MA, Holyoak M, Mouquet N, Amarasekare P, Chase JM, Hoopes MF et al The metacommunity concept: a framework for multi-scale community ecology. Ecol Lett. 2004; 7(7):601–13. https://doi.org/10.1111/j.1461-0248.2004.00608.x
» https://doi.org/10.1111/j.1461-0248.2004.00608.x - Lorion CM, Kennedy BP. Relationships between deforestation, riparian forest buffers and benthic macroinvertebrates in neotropical headwater streams. Freshw Biol. 2009; 54(1):165–80. https://doi.org/10.1111/j.1365-2427.2008.02092.x
» https://doi.org/10.1111/j.1365-2427.2008.02092.x - Mendiburu F. Agricolae: Statistical Procedures for Agricultural Research. R package version 1.3–3. 2020:155.
- Montag LFA, Winemiller KO, Keppeler FW, Leão H, Benone NL, Torres NR et al Land cover, riparian zones and instream habitat influence stream fish assemblages in the eastern Amazon. Ecol Freshw Fish. 2019; 28:317–29. https://doi.org/10.1111/eff.12455
» https://doi.org/10.1111/eff.12455 - Mori AS, Isbell F, Seidl R. β-Diversity, community assembly, and ecosystem functioning. Trends Ecol Evol. 2018; 33(7):549–64. https://doi.org/10.1016/j.tree.2018.04.012
» https://doi.org/10.1016/j.tree.2018.04.012 - Nimon K, Lewis M, Kane R, Haynes RM. Erratum to: An R package to compute commonality coefficients in the multiple regression case: An introduction to the package and a practical example. Behav Res Methods. 2017; 49(6):2275. https://doi.org/10.3758/s13428-017-0853-2
» https://doi.org/10.3758/s13428-017-0853-2 - Oksanen J, Blanchet FG, Friendly M, Kindt R, Legendre P, McGlinn D et al Vegan: Community ecology package. R Package 24–6. 2018:292.
- Paula FR, Ferraz SFB, Gerhard P, Vettorazzi CA, Ferreira A Large woody debris input and its influence on channel structure in agricultural lands of southeast Brazil. Environ Manage. 2011; 48(4):750–63. https://doi.org/10.1007/s00267-011-9730-4
» https://doi.org/10.1007/s00267-011-9730-4 - Pérez-Mayorga MA, Casatti L, Teresa FB, Brejão GL. Shared or distinct responses between intermediate and satellite stream fish species in an altered Amazonian River? Environ Biol Fishes. 2017; 100(12):1527–41. https://doi.org/10.1007/s10641-017-0663-5
» https://doi.org/10.1007/s10641-017-0663-5 - Petchey OL, Gaston KJ. Functional diversity: back to basics and looking forward. Ecol Lett. 2006; 9(6):741–58. https://doi.org/10.1111/j.1461-0248.2006.00924.x
» https://doi.org/10.1111/j.1461-0248.2006.00924.x - Püttker T, Bueno AA, Prado PI, Pardini R. Ecological filtering or random extinction? Beta-diversity patterns and the importance of niche-based and neutral processes following habitat loss. Oikos. 2015; 124(2):206–15. https://doi.org/10.1111/oik.01018
» https://doi.org/10.1111/oik.01018 - R Development Core Team. R: A language and environment for statistical computing. Vienna, Austria: R Foundation for Statistical Computing; 2014.
- Raup DM, Crick RE. Measurement of faunal similarity in paleontology. J Paleontol. 1979; 53(5):1213–227. https://www.jstor.org/stable/1304099
» https://www.jstor.org/stable/1304099 - Ray-Mukherjee J, Nimon K, Mukherjee S, Morris DW, Slotow R, Hamer M. Using commonality analysis in multiple regressions: A tool to decompose regression effects in the face of multicollinearity. Methods Ecol Evol. 2014; 5(4):320–28. https://doi.org/10.1111/2041-210X.12166
» https://doi.org/10.1111/2041-210X.12166 - Roa-Fuentes CA, Heino J, Cianciaruso MV, Ferraz S, Zeni JO, Casatti L. Taxonomic, functional, and phylogenetic β-diversity patterns of stream fish assemblages in tropical agroecosystems. Freshw Biol. 2019; 64(3):447–60. https://doi.org/10.1111/fwb.13233
» https://doi.org/10.1111/fwb.13233 - Schiesari L, Matias MG, Prado PI, Leibold MA, Albert CH, Howeth JG et al Towards an applied metaecology. Perspect Ecol Conserv. 2019; 17(4):172–81. https://doi.org/10.1016/j.pecon.2019.11.001
» https://doi.org/10.1016/j.pecon.2019.11.001 - Siqueira T, Lacerda CGT, Saito VS. How does landscape modification induce biological homogenization in tropical stream metacommunities? Biotropica. 2015; 47(4):509–16. https://doi.org/10.1111/btp.12224
» https://doi.org/10.1111/btp.12224 - Socolar JB, Gilroy JJ, Kunin WE, Edwards DP. How Should Beta-Diversity Inform Biodiversity Conservation? Trends Ecol Evo. 2016; 31(1): 67–80. https://doi.org/10.1016/j.tree.2015.11.005
» https://doi.org/10.1016/j.tree.2015.11.005 - Solar RRC, Barlow J, Ferreira J, Berenguer E, Lees AC, Thomson JR et al How pervasive is biotic homogenization in human-modified tropical forest landscapes? Ecol Lett. 2015; 18(10):1108–18. https://doi.org/10.1111/ele.12494
» https://doi.org/10.1111/ele.12494 - Sorice MG, Conner JR. Predicting private landowner intentions to enroll in an incentive program to protect endangered species. Hum Dimens Wildl. 2010; 15(2):77–89. https://doi.org/10.1080/10871200903551985
» https://doi.org/10.1080/10871200903551985 - Swenson NG. Functional and Phylogenetic Ecology in R. New York: Springer; 2014. https://doi.org/10.1007/978-1-4614-9542-0
» https://doi.org/10.1007/978-1-4614-9542-0 - Swenson NG Phylogenetic beta diversity metrics, trait evolution and inferring the functional beta diversity of communities. PLoS One. 2011; 6(6):e21264. https://doi.org/10.1371/journal.pone.0021264
» https://doi.org/10.1371/journal.pone.0021264 - Swenson NG, Stegen JC, Davies SJ, Erickson DL, Forero-Montaña J, Hurlbert AH et al Temporal turnover in the composition of tropical tree communities: Functional determinism and phylogenetic stochasticity. Ecology. 2012; 93(3):490–99. https://doi.org/10.1890/11-1180.1
» https://doi.org/10.1890/11-1180.1 - Townsend CR, Begon M, Harper JA. Essentials of ecology. Oxford, UK: Blackwell Science; 2003.
- Tucker CM, Shoemaker LG, Davies KF, Nemergut DR, Melbourne BA. Differentiating between niche and neutral assembly in metacommunities using null models of β-diversity. Oikos. 2016; 125(6):778–89. https://doi.org/10.1111/oik.02803
» https://doi.org/10.1111/oik.02803 - Tuomisto H, Ruokolainen K. Analyzing or explaining beta diversity? Understanding the targets of different methods of analysis. Ecology. 2006; 87(11):2697–708. https://doi.org/10.1890/0012-9658(2006)87[2697:AOEBDU]2.0.CO;2
» https://doi.org/10.1890/0012-9658(2006)87[2697:AOEBDU]2.0.CO;2 - Villéger S, Grenouillet G, Brosse S. Decomposing functional β-diversity reveals that low functional β-diversity is driven by low functional turnover in European fish assemblages. Glob Ecol Biogeogr. 2013; 22(6):671–81. https://doi.org/10.1111/geb.12021
» https://doi.org/10.1111/geb.12021 - Vitule JRS, Agostinho AA, Azevedo-Santos VM, Daga VS, Darwall WRT, Fitzgerald DB et al We need better understanding about functional diversity and vulnerability of tropical freshwater fishes. Biodivers Conserv. 2017; 26(3):757–62. https://doi.org/10.1007/s10531-016-1258-8
» https://doi.org/10.1007/s10531-016-1258-8 - Wang J, Shen J, Wu Y, Tu C, Soininen J, Stegen JC et al Phylogenetic beta diversity in bacterial assemblages across ecosystems: Deterministic versus stochastic processes. ISME J. 2013; 7(7):1310–21. https://doi.org/10.1038/ismej.2013.30
» https://doi.org/10.1038/ismej.2013.30 - Wear D, Turner M, Naiman R. Land cover along an urban-rural gradient: implications for water quality. Ecol Appl. 1998; 8(3):619–30. https://doi.org/10.1890/1051-0761(1998)008[0619:LCAAUR]2.0.CO;2
» https://doi.org/10.1890/1051-0761(1998)008[0619:LCAAUR]2.0.CO;2 - Webb C. Exploring the phylogenetic structure of ecological communities: An example for rain forest trees. Am Nat. 2000; 156(2):145–55. https://doi.org/10.1086/303378
» https://doi.org/10.1086/303378 - Welcomme RL. Morphology of river systems. In: Welcomme RL, editor. Rome: River Fisheries; 1985. p.1-34.
- Whittaker RH. Vegetation of the Siskiyou Mountains, Oregon and California. Ecol Monogr. 1960; 30(3):279–338. https://doi.org/10.2307/1943563
» https://doi.org/10.2307/1943563 - Wright JP, Flecker AS. Deforesting the riverscape: the effects of wood on fish diversity in a Venezuelan piedmont stream. Biol Conserv. 2004; 120(3):439–47. https://doi.org/10.1016/j.biocon.2004.02.022
» https://doi.org/10.1016/j.biocon.2004.02.022 - Zeni JO, Hoeinghaus DJ, Casatti L. Effects of pasture conversion to sugarcane for biofuel production on stream fish assemblages in tropical agroecosystems. Freshw Biol. 2017; 62(12):2026–38. https://doi.org/10.1111/fwb.13047
» https://doi.org/10.1111/fwb.13047 - Zeni JO, Hoeinghaus DJ, Roa-Fuentes CA, Casatti L. Stochastic species loss and dispersal limitation drive patterns of spatial and temporal beta diversity of fish assemblages in tropical agroecosystem streams. Hydrobiologia. 2020; 847: 3829–43. https://doi.org/10.1007/s10750-020-04356-1
» https://doi.org/10.1007/s10750-020-04356-1 - Zuanon J, Bockmann FA, Sazima I. A remarkable sand-dwelling fish assemblage from central Amazonia, with comments on the evolution of psammophily in South American freshwater fishes. Neotrop Ichthyol. 2006; 4(1):107–18. https://doi.org/10.1590/S1679-62252006000100012
» https://doi.org/10.1590/S1679-62252006000100012
-
HOW TO CITE THIS ARTICLE
Brejão GL, Hoeinghaus DJ, Roa-Fuentes CA, Pérez-Mayorga MA, Ferraz SFB, Casatti L. Taxonomic and functional turnover of Amazonian stream fish assemblages is determined by deforestation history and environmental variables at multiple scales. Neotrop Ichthyol. 2021; 19(3):e210042. https://doi.org/10.1590/1982-0224-2021-0042
Edited-by
Publication Dates
-
Publication in this collection
17 Sept 2021 -
Date of issue
2021
History
-
Received
30 Jan 2021 -
Accepted
12 May 2021