
Abstract
A new circle-arc model was established to present the cellular structure. Dynamic response of models with density gradients under constant velocities is investigated by employing Ls-dyna 971. Compared with the uniform models, the quasi-static plateau stress of different layers seems a significant parameter correlated with the deformation mode except for inertia effect when the density gradient is introduced. The impact velocity becomes much more vital on the deformation of the unit cell than the density gradient. The stress at both the impact and stationary sides is investigated in details. Furthermore, the stress-strain curve is compared with the modified shock wave theory. The density gradient does have some remarkable influence on the energy absorption capability, and a certain density gradient is not always beneficial to the energy absorption. Irrespective of the impact velocity, there seems always a critical strain where the energy absorbed by all these specimens could approximate to nearly the same value. So the critical strain-velocity curve is plotted and gives the beneficial area for energy absorption pertinent to density gradients and impact velocity.
Keywords:
Cellular structure; circle arc model; density gradient; dynamic crushing; critical strain
1 INTRODUCTION
Dynamic behaviors of metallic cellular materials greatly fascinate the researchers and engineers. Considerable experimental and numerical studies have been conducted to investigate the dynamic behavior of cellular structures (Li et al., 2005Li, K., Gao, X.L., Subhash, G., (2005). Effects of cell shape and cell wall thickness variations on the elastic properties of two-dimensional cellular solids. Int. J. Solids Struc. 42: 1777-1795.; Wang et al., 2006Wang, Z.H., Ma, H.W., Zhao, L.M., Yang, G.T., (2006). Studies on the dynamic compressive properties of open-celled aluminum alloy foams. Scripta. mater. 54: 83-87.; Zhou et al., 2012Zhou, Z.W., Wang, Z.H., Zhao, L.M., Shu, X.F., (2012). Experimental investigation on the yield behavior of Nomex honeycombs under combined shear-compression. Lat. Am. J. Solids Stru. 9: 515-530.; Wang et al., 2011Wang, Z.H., Shen, J.H., Lu, G.X., Zhao, L.M., (2011). Compressive behavior of closed-cell aluminum alloy foams at medium strain rates. Mater. Sci. Eng. A 528(6): 2326-2330.; Chen et al., 1999Chen, C., Lu, T.J., Fleck, N.A., (1999). Effect of imperfections on the yielding of two- dimensional foams. J. Mech. Phys. Solids 47(11): 2235-2272.; Tan et al., 2005Tan, P.J., Reid, S.R., Harrigan, J.J., Zou, Z., Li, S., (2005). Dynamic compressive strength properties of aluminum foams. Part II-'shock' theory and comparison with experimental data and numerical models. J. Mech. Phys. Solids 53: 2206-2230.; Masters and Evans, 2009; Blawi and Abot, 2008Blawi, S., Abot, J.L., (2008). A refined model for the effective in-plane elastic moduli of hexagonal honeycombs. Compos. Struct. 84: 147-158.; Xu et al., 2012Xu, S., Beynon, J.H., Ruan, D., Lu, G., (2012). Experimental study of the out-of plane dynamic compression of hexagonal honeycombs. Compos. Struct. 94: 2326-2336.). The deformation, crushing stress and energy absorption as well as the cell geometric topology of the uniform cellular structures have been studied systematically.
However, there are limited studies on the dynamic behaviors of the graded cellular structures (Wadley et al., 2008Wadley, H.N.G., Dharmasena, K.P., Chen, Y., Dudt, P., Knight, D., Charette, R., Kiddy, K., (2008). Compressive response of multilayered pyramidal lattices during underwater shock loading. Int. J. Impact Eng. 35: 1102-1114.; Ali et al., 2008Ali, M., Qamhiyah, A., Flugrad, D., Shakoor, M., (2008). Theoretical and finite element study of a compact energy absorber. Adv. Eng. Soft. 39: 95-106.; Gibson and Ashby, 1997Gibson, L.J., Ashby, M.F., (1997). Cellular solids: structures and properties, 2nd ed. UK: Cambridge University Press.). In the quasi-static conditions, Ajdari et al. (2009Ajdari, A., Canavan, P., Nayeb-Hashemi, H., Warner, G., (2009). Mechanical properties of Functionally graded 2-D cellular structures: a finite element simulation. Mater. Sci. Eng. A 499: 434-439.) investigated the compressive uniaxial and biaxial behavior of functionally graded Voronoi structures, as well as the effect of missing cell walls on its overall mechanical (elastic, plastic, and creep) properties. Ali et al. (2008)Ali, M., Qamhiyah, A., Flugrad, D., Shakoor, M., (2008). Theoretical and finite element study of a compact energy absorber. Adv. Eng. Soft. 39: 95-106. established a graded energy absorbing structure-a inspiration from the geometry in a banana peel, and gave the theoretical prediction of the behavior under low velocity based on the equations derived by Gibson and Ashby (1997)Gibson, L.J., Ashby, M.F., (1997). Cellular solids: structures and properties, 2nd ed. UK: Cambridge University Press.. Kiernan et al. (2009)Kiernan, S., Cui, L., Gilchrist, M.D., (2009). Propagation of a stress wave through a virtual functionally graded foam. Int. J. Non-Linear Mech. 44 (5): 456-468. had found the superiority of graded cellular materials on impact resistance and energy absorption for creating impact resistant structures and cushioning materials. Compared with a uniform foam with equal mass, Cui et al. (2009)Cui, L., Kiernan, S., Gilchrist, M.D., (2009). Designing the energy absorption capacity of functionally graded foam materials. Mat. Sci. Eng. A 507: 215-225. suggested that a functionally graded foam can exhibit superior energy absorption. Ajdari et al. (2011)Ajdari, A., Nayeb-Hashemi, H., Vaziri, A., (2011). Dynamic crushing and energy absorption of regular, irregular and functionally graded cellular structures. Int. J. Solids Struct. 48: 506-516. studied the dynamic crushing of functionally graded cellular structure with regular and irregular cellular arrangements. Results showed that decreasing the relative density along the loading direction enhanced the energy absorption of honeycombs at early stages of crushing. Zeng et al. (2010)Zeng, H.B., Pattofatto, S., Zhao, H., Girard, Y., Fascio, V., (2010). Impact behavior of hollow sphere agglomerates with density gradient. Int. J. Mech. Sci. 52: 680-688. performed a series of experiments to test the dynamic responses of hollow sphere metal foams with density gradients. It turned out that a winning strategy in term of more absorbed energy with a low transmitted force could consist of placing the "hardest" layer as the first impacted layer and the "weakest" layer in contact with the protected structure to reduce the transmitted force. Fan et al. (2013)Fan, J.H., Zhang, J.J., Wang, Z.H., Li, Z.Q., Zhao, L.M., (2013). Dynamic crushing behavior of random and functionally graded metal hollow sphere foams. Mater. Sci. Eng. A 561: 352-361. analyzed the influences of the impact loading rate, relative density and strain hardening on the capacity of energy absorption of the hollow sphere metal foams. It was found that the inertia effect of foam material was obvious at the impact side, but insensitive at the stationary side. Putting the strongest foam layer in the impact end could contribute to the energy absorption. Shen et al. (2013)Shen, C.J., Lu, G., Yu, T.X., (2013). Dynamic behavior of graded honeycombs - A finite element study. Compos. Struct. 98: 282-293. introduced the gradient in stress by assigning different values of yielding stress to the parent material of each layer of a regular hexagonal honeycomb, and investigated the response of graded honeycomb structures under in-plane impact loading. Karagiozova and Alves (in press)Karagiozova, D., Alves, M. Primary and reflected compaction waves in a foam rod due to an axial impact by a small mass. Lat. Am. J. Solids Stru. in press. extended the unified approach applied in the foam compaction within the wave reflected from a stationary boundary which is considered as a wave of strong discontinuity propagating in a media with non-uniform initial density. In the study, two types of deformation modes had been observed when the gradient was positive while three types of deformation modes existed when the gradient was negative. The investigation of the energy absorption showed that placing the weakest material at the impinged end led to higher energy absorption.
Limited investigations centers on mechanical responses of the graded cellular structures, so there are little comprehensive and systematical studies on the graded cellular structures. Particularly, in the aforementioned literatures, little detailed analysis focuses on the stress at both the impact and stationary side, moreover, there are some disagrees about the energy absorption of graded cellular structures (Ajdari et al., 2011Ajdari, A., Nayeb-Hashemi, H., Vaziri, A., (2011). Dynamic crushing and energy absorption of regular, irregular and functionally graded cellular structures. Int. J. Solids Struct. 48: 506-516.; Zeng et al., 2010Zeng, H.B., Pattofatto, S., Zhao, H., Girard, Y., Fascio, V., (2010). Impact behavior of hollow sphere agglomerates with density gradient. Int. J. Mech. Sci. 52: 680-688.; Fan et al., 2013Fan, J.H., Zhang, J.J., Wang, Z.H., Li, Z.Q., Zhao, L.M., (2013). Dynamic crushing behavior of random and functionally graded metal hollow sphere foams. Mater. Sci. Eng. A 561: 352-361.; Shen et al., 2013Shen, C.J., Lu, G., Yu, T.X., (2013). Dynamic behavior of graded honeycombs - A finite element study. Compos. Struct. 98: 282-293.). Therefore, it is much necessary to further investigate the dynamic behaviors of graded cellular structures. In this paper, a new circle arc model is established to present the cellular structure. In the simulation, the deformation modes, the stress at both the sides and the energy absorption capability are studied in details. In addition, the local strain field is built for better presenting the local deformation.
2 METHODOLOGY
2.1 Finite element models
In the study, a new model was established to demonstrate the cellular structure, denoted as circle arc model (c-a model), as shown in the Figure 1. The in-plane size of the model was 100mm×100mm with the out-plane thickness 0.8 mm, and the model contains 625 cells. A unit cell is presented in the right of the figure with the size d= 4mm, including four vertexes which divide the cell into eight arcs with equal length and in-plane thickness. Four arcs inside one cylinder are cut inside, and combine with this cylinder (the four arcs outside) forming the unit cell. By duplicating the unit cell in the plane, the whole model is obtained. So the relative density of the model can be defined as ρ = ρ*/ ρs = 2πdtNc /(LH), where ρ* and ρs are the densities of the c-a model and the base material of the model, respectively. t is the in-plane cell wall thickness and Nc the number of cells in the model. The finite element analysis is conducted on the graded cellular structures constructed above to simulate their dynamic crushing behavior at various impact velocities using Ls-dyna 971/Explicit. Each cell wall in FE models was meshed with shell elements. The model is comprised of 20000 elements and 32600 nodes. Every element had a set of elemental properties, which include the element length and thickness. For simplicity, one element was employed in the out-of-plane direction. A preliminary study showed that using such an element size to model each cell wall was sufficient for convergence. The literatures (Li et al., 2014Li, Z., Zhang, J., Fan, J., Wang, Z., Zhao, L., (2014). On crushing response of the three-dimensional closed-cell foam based on Voronoi model. Mech. Mater. 68: 85-94; Zheng et al., 2005Zheng, Z.J., Yu, J.L., (2005). Li JR. Dynamic crushing of 2D cellular structures: A finite element study. Int. J. Impact Eng. 32: 650-664.; Li et al., 2007Li, K., Gao, X.L., Wang, J., (2007). Dynamic crushing behavior of honeycomb structures with irregular cell shapes and non-uniform cell wall thickness. Int. J. Solids Struct. 44: 5003-5026.; Schaffner et al., 2000Schaffner, G., Guo, X.D.E., Silva, M.J., Gibson, L.J., (2000). Modeling fatigue damage accumulation in two-dimensional Voronoi honeycombs. Int. J. Mech. Sci. 42(4): 645-656.; Song et al., 2010Song, Y.Z., Wang, Z.H., Zhao, L.M., Luo, J., (2010). Dynamic crushing behavior of 3D closed-cell foams based on Voronoi random model. Mater. Des. 31: 4281-4289.) also applied the same method to ensure the success of the FE analysis. Following the references (Li et al., 2014Li, Z., Zhang, J., Fan, J., Wang, Z., Zhao, L., (2014). On crushing response of the three-dimensional closed-cell foam based on Voronoi model. Mech. Mater. 68: 85-94; Li et al., 2007Li, K., Gao, X.L., Wang, J., (2007). Dynamic crushing behavior of honeycomb structures with irregular cell shapes and non-uniform cell wall thickness. Int. J. Solids Struct. 44: 5003-5026.; Song et al., 2010Song, Y.Z., Wang, Z.H., Zhao, L.M., Luo, J., (2010). Dynamic crushing behavior of 3D closed-cell foams based on Voronoi random model. Mater. Des. 31: 4281-4289.; Papka and Kyriakides, 1994Papka, S.D., Kyriakides, S., (1994). In-plane compressive response and crushing of honeycomb. J. Mech. Phys. Solids 42: 1499-1532.), the cell wall material of the model is taken to be the bilinear strain-hardening material model, which is aluminum (Al) with the following properties: the density, Young's modulus, Poisson's ratio, yield stress and tangent modulus were assigned as 2.7×10³ kg/m3, 69 GPa, 0.3, 76 MPa and 0.69 GPa, respectively. Also, the behavior of the cell wall material is treated as rate-independent, as was done in the references (Ruan et al., 2003Ruan, D., Lu, G., Wang, B., Yu, T.X., (2003). In-plane dynamic crushing of honeycombs - a finite element study. Int. J. Impact Eng. 28(2): 161-182.; Tan et al., 2005Tan, P.J., Reid, S.R., Harrigan, J.J., Zou, Z., Li, S., (2005). Dynamic compressive strength properties of aluminum foams. Part II-'shock' theory and comparison with experimental data and numerical models. J. Mech. Phys. Solids 53: 2206-2230.; Li et al., 2014Li, Z., Zhang, J., Fan, J., Wang, Z., Zhao, L., (2014). On crushing response of the three-dimensional closed-cell foam based on Voronoi model. Mech. Mater. 68: 85-94; Zheng et al., 2005Zheng, Z.J., Yu, J.L., (2005). Li JR. Dynamic crushing of 2D cellular structures: A finite element study. Int. J. Impact Eng. 32: 650-664.; Li et al., 2007Li, K., Gao, X.L., Wang, J., (2007). Dynamic crushing behavior of honeycomb structures with irregular cell shapes and non-uniform cell wall thickness. Int. J. Solids Struct. 44: 5003-5026.; Song et al., 2010Song, Y.Z., Wang, Z.H., Zhao, L.M., Luo, J., (2010). Dynamic crushing behavior of 3D closed-cell foams based on Voronoi random model. Mater. Des. 31: 4281-4289.)

The model was sandwiched between two rigid plates, as in Figure 1. During the crushing in x direction, the right rigid plate subjected to the constant velocity moved toward left and the left rigid plate kept stationary. In the simulation, automatic single surface contact was specified for the c-a model. Meanwhile, the automatic surface to surface contact was applied between the moving plate and c-a model, as well as between the c-a model and the stationary plate. It should be noted that the contact walls of c-a model can slip on both plates with slight friction. The dynamic friction coefficient was assumed to be 0.2. It was found that the simulation results were not sensitive to the friction coefficient through simple parametric study (Ma et al., 2009Ma, G.W., Ye, Z.Q., Shao, Z.S., (2009). Modeling loading rate effect on crushing stress of metallic cellular materials. Int. J. Impact Eng. 36: 775-782.; Li and Meng, 2002Li, Q.M., Meng, H., (2002). Attenuation or enhancement-a one-dimensional analysis on shock transmission in the solid phase of a cellular material. Int. J. Impact Eng. 27: 1049-1065.). In the simulation, we adopted the explicit way and did not use any the mass scaling method, while just endowed the impact plate with a certain constant velocity. For better hourglass energy controlling, the element formulation - Fully integrated shell element (ELFORM=16) - is implemented instead of the default value - Belytschko-Tsay.
In this study, we constructed finite element models of functionally graded cellular structures by changing the thickness of the cell walls -and thus, the relative density- in the direction of crushing. The cellular structure was divided into five equal-size layers with height ΔH = H/5, and assigned different cell wall thicknesses to each layer to introduce a constant density gradient. The density gradient β was defined as β = ρi+1 - ρi (i = 1, 2, 3, 4), where ρi indicated the relative density of ith layer, as given in Figure 2. β = 0 presents the uniform specimen with total constant relative density, and a positive one gives the specimen with the relative density gradually increasing in the loading direction, that means the strongest layer is located approximate to the stationary side, and vice versa. But the total relative density of graded specimen is kept constant as 6%.

2.2 Local strain mapping
Several methods for calculating strain have been proposed in the literature but they are either limited for regular honeycombs (Zou et al., 2009Zou, Z., Reid, S.R., Tan, P.J., Li, S., Harrigan, J.J., (2009). Dynamic crushing of honeycombs and features of shock fronts. Int. J. Impact Eng. 36(1): 165-176.) or based on small strain definition (Tekoglu et al., 2011Tekoglu, C., Gibson, L.J., Pardoen, T., Onck, P.R., (2011). Size effects in foams: experiments and modeling. Prog. Mater. Sci. 56(2): 109-138.). Zheng et al. (2012)Zheng, Z.J., Liu, Y.D., Yu, J.L., Reid, S.R., (2012). Dynamic crushing of cellular materials: continuum-based wave models for the transitional and shock modes. Int. J. Impact Eng. 42: 66-79. suggested that strain should be defined as statistical average measured over a range of at least one cell size because of the cellular nature of the materials. The cellular nature of the materials allowed for only discrete displacement field of nodes, which prevented direct calculation of the deformation gradient, thus a discrete local deformation gradient based on the least square error defined in Refs.(Li and Shimizu, 2002; Gullett et al., 2008Gullett, P.M., Horstemeyer, M.F., Baskes, M.I., Fang, H., (2008). A deformation gradient tensor and strain tensors for atomistic simulations. Model Simul. Mater. Sci. Eng. 16(1): 5-11.; Zimmerman et al., 2009Zimmerman, J.A., Bammann, D.J., Gao, H., (2009). Deformation gradients for continuum mechanical analysis of atomistic simulations. Int. J. Solids Struct. 46(2): 238-253.; Liao et al., 2013Liao, S.F., Zheng, Z.J., Yu, J.L., (2013). Dynamic crushing of 2D cellular structures: Local strain field and shock wave velocity. Int. J. Impact Eng. 57: 7-16.) was employed.
The cellular structure is discretized as a series of corner nodes (vertices of cells) and other nodes on the cell walls, as illustrated in Figure 3. Interior strain of the cellular structure is discretely represented by the local strain at each corner node, which is regarded as a statistical average of the strain over the neighbourhood of each corner node. The nodal configurations at t = t0 and t = t1 are called reference configuration and current configuration, respectively. A corner node i and its neighbouring node j are located at the position  and
and  at t = t0 , and position xi and xj at t = t1 . The relative positions of nodes i and j are given by vectors

which are considered to be row vectors.

Motion in the neighbourhood of a corner node i with position vectors xi 0 and xi in the reference and current configurations, respectively.
The Lagrangian or Green strain tensor, E, is defined with respect to the reference configuration as

where I is the identity matrix, and the calculation of the Lagrangian or Green strain tensor is detailed in the Appendix
APPENDIX
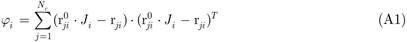
Based on the continuum mechanics, local deformation in the neighbourhood of a given node i is characterized by the transformation of node and its neighbouring nodes from the reference configuration to the current configuration. For homogeneous deformation, there exists a unique deformation gradient J (Reddy, 2008) and rji = × J, where j is any node around node i, and J is the deformation gradient. However, deformation in cellular structures is always heterogeneous, thus node i with a specific deformation gradient J cannot accurately transform all of its neighbours from the reference configuration to the current configuration. Thus in the least square approximation, it is assumed that there exists an optimal local deformation gradient Ji defined at node i best mapping {} → {rij }, ∀j ∈ Nc , where Nc is the number of neighbouring nodes of node i within a cut-off radius Rc , as illustrated in Figure 3. And the least square mapping error at node i is defined as
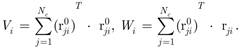
Superscript T denotes the transpose of a matrix. The cut-off radius is introduced to specify a domain around a node, only the neighbouring nodes located within which are assumed to contribute to the formulation of the local deformation gradient at the node. The optimal local deformation gradient Ji is determined by minimizing the mapping error φi with ∂φi /∂Ji = 0, this (Li and Shimizu, 2005) is Ji = Vi -1 Wi where
It is assumed that node i is in zero-strain state if the determinant of matrix Vi equals zero. The Lagrangian or Green strain tensor, E, is defined with respect to the reference configuration as
. Suppose that the deformation is considered in a rectangular Cartesian coordinate system (X 1, X 2, X 3), as we all know, the diagonal terms of Lagrangian strain tensor, eII (I =1, 2, 3), are the normal strains at a given material point, and the local engineering strain (Liao et al., 2013Liao, S.F., Zheng, Z.J., Yu, J.L., (2013). Dynamic crushing of 2D cellular structures: Local strain field and shock wave velocity. Int. J. Impact Eng. 57: 7-16.) in the direction of XI at the given point is given by εI = 1 -  .
.
The strain is considered as positive in compression. In the study, we only focus on the strain in the loading direction. To treat the cellular model as a 2D continuum, the data of 2D discrete strains were then interpolated into a 2D continuous strain field by using Matlab function TriScatteredInterp, which performs scattered data interpolation based on an underlying Delaunay triangulation. As no confinement is required for the meso-structures of a cellular material, there is no limit for the approach of constructing local strain fields introduced above.
2.3 Shock wave theory
The plateau stress and densification strain were two crucial parameters to characterize the mechanical properties of cellular materials, which have been widely applied in the design and analysis of cellular solids. Therefore, it was essential to determine these two parameters precisely and make the defined process clear. In this paper, an energy efficiency-based approach was adopted to calculate the plateau stress and densification strain (Li et al., 2006Li, Q.M., Magkiriadis, I., Harrigan, J.J., (2006). Compressive strain at the onset of the densification of cellular solids. J. Cell Plast. 42(5): 371-392.). Energy absorption efficiency η(εa) was defined as the energy absorbed up to a given nominal strain εa normalized by the corresponding stress value σc(ε), to remove the recoverable energy at the elastic stage and reflect the nature of energy absorption efficiency, it was in the following form
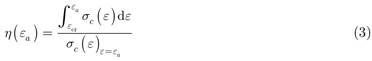
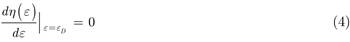
where εcr was the strain at the initial yield point corresponding to the first peak of the crushing stress. Densification strain εD was the strain value corresponding to the stationary point in the efficiency-strain curve where the efficiency was a global maximum, i.e.
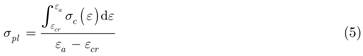
The plateau stress was determined by
Reid and Peng (1997)Reid, S.R., Peng, C., (1997). Dynamic uniaxial crushing of wood. Int. J. Impact Eng. 19(5-6): 531-570. proposed a shock wave theory to explain the rate-dependency of crushing stress at the impact side. The shock wave theory relied on an idealized rigid-perfectly plastic-locking (RPPL) stress-strain model with a constant plastic stress without the elastic deformation. The material was fully densified when the plastic strain reached up to a critical value of εD and no further deformation was allowed. The densification strain εD was determined by the aforementioned energy absorption efficiency method. The dynamic crushing stress can be expressed in the following form,

where σ0 was the quasi-static crushing stress and ρ0 was the density of the cellular material.
3 RESULTS AND DISCUSSIONS
3.1 Model verification
In this section, five kinds of models, H = 0.2L, 0.4L, 0.6L, 0.8L and L, were taken into consideration, and the relative density of the model was set as 7.8%. These models had different ratio of the length H to the width L. L/d for the models were large enough. Nominal stress and nominal strain were commonly defined in the literatures (Li et al., 2014Li, Z., Zhang, J., Fan, J., Wang, Z., Zhao, L., (2014). On crushing response of the three-dimensional closed-cell foam based on Voronoi model. Mech. Mater. 68: 85-94; Zheng et al., 2005Zheng, Z.J., Yu, J.L., (2005). Li JR. Dynamic crushing of 2D cellular structures: A finite element study. Int. J. Impact Eng. 32: 650-664.; Ma et al., 2009Ma, G.W., Ye, Z.Q., Shao, Z.S., (2009). Modeling loading rate effect on crushing stress of metallic cellular materials. Int. J. Impact Eng. 36: 775-782.) as
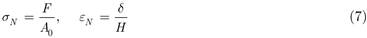
where F was the reaction force at the rigid plate, A0 the initial nominal contacting area between the rigid plate and specimen and δ the total deformation of the specimen. However, it should be noted that the nominal strain could only reflect macroscopic average deformation but not characterize the local deformation at the cell level.
For different models and impact velocities, the transverse constraint of friction and inertia effect may have different influence on the stress-strain relationship. Figure 4 gives the nominal stress-strain curves of these models at 10 m/s. It can be clearly seen that the stress of the model with H/L = 0.2 at both sides is much larger than that of the other four models while the stress for the four cases is almost the same except for the initial stress at both sides. This may be due to the transverse constraint of friction playing the major role in the reaction force under low impact velocities. This reveals that specimen size has some influence on the nominal stress-strain curve to some extent and the thin specimen contains insufficient cells to statistically represent the cellular material. In addition, the stress at the impact and the stationary side is almost the same, indicating an achievement of internal stress equilibrium. Figure 5 (a) indicates that the stress-strain curve at the impact side depends slightly on the specimen size except for some oscillations, i.e., compared with the transverse constraint, the inertia effect is much more paramount when the impact velocity is high. Clearly, the stress at the impact side oscillates much more greatly with the ratio of H/L decreasing in the plateau stage while it fluctuates almost over a constant value. This oscillation in a considerable range may be induced by lateral inertia effect and deformation localization during the crushing process at high impact velocity. Furthermore, due to the inertia effect, the stress at the impact side is much higher than one at stationary side. Meanwhile, from the comparison of Figures 4 (a) and 5(a), the nominal stress at v = 80 m/s is much higher than the one at v =10 m/s, this loading rate effect on the crushing stress at the impact side is mainly owe to the inertia effect (Li et al., 2014Li, Z., Zhang, J., Fan, J., Wang, Z., Zhao, L., (2014). On crushing response of the three-dimensional closed-cell foam based on Voronoi model. Mech. Mater. 68: 85-94). Moreover, when the nominal strain rates is defined as v/H here, for a specific impact velocity, the crushing stress at the impact side is similar for the thin and thick specimens, as shown in Figure 5 (a). This reveals that the crushing stress at the impact side is primarily related to the impact velocity rather than the nominal strain rate. At last, from the results in Figures 4 and 5, it can be concluded that the specimen with H = L contains sufficient cells to statistically represent the cellular material. Additionally, when the impact loading is high, the crushing bands are greatly localized near the impact side, so there will be some time for the plastic wave propagating to the stationary side, the stress at the stationary side transforms gradually from the elastic stage to the plastic plateau stage, as illustrated in Figure 5 (b). Here, corresponding to Figure 5 (b), the relationship of the Lagrangian coordinate location of the plastic wave, Z, and the time for the crushing wave propagating from the impact side to the stationary side, t, is plotted and linearly fitted in Figure 6. From the fitting the slope could be obtained as 220 with the standard error approximating to 11, and this is the crushing wave velocity.

Nominal stress-strain curves of different models at v = 10 m/s: (a) at the impact side; (b) at the stationary side.

Stress variation of different models at v = 80 m/s: (a) nominal stress-strain curve at the impact side; (b) nominal stress-time curve at the stationary side.

On the other side, in order to study the simulation convergence of the model, three kinds of models were established, as in Table 1. All of them included sufficient cells to statistically represent the properties of cellular materials, as verified above. Figure 7 presents the force variation at the both sides under v = 10 m/s and 50 m/s. It can be found that the results of M2 and M3 are almost the same while the force of M1 shows much deviation with that of M2 and M3, so to improve the computational efficiency, M2 is employed in the simulation hereinafter. In addition, from the results above, the amplitude of the dynamic response for the model we employed is slight, so it is not necessary to perform the system damping in the simulation to reduce the amplitude of the dynamic response.

3.2 Deformation modes
3.2.1 The uniform c-a model
It was suggested by Ruan et al. (2003)Ruan, D., Lu, G., Wang, B., Yu, T.X., (2003). In-plane dynamic crushing of honeycombs - a finite element study. Int. J. Impact Eng. 28(2): 161-182. that the impact velocity was the major factor that affected the deformation modes of the cellular structure. Based on the numerical simulation consequences, the uniform model gives X-shape, V-shape and I-shape deformation, corresponding to different impact velocities, as shown in Figure 8. Obviously, under the quasi-static condition, the deformation is initially localized in one or two bands of collapsing cells in X shape, which maybe the weakest regions of the specimen, and then, the crushing bands diffuse until all are fully densified (Li et al., 2014Li, Z., Zhang, J., Fan, J., Wang, Z., Zhao, L., (2014). On crushing response of the three-dimensional closed-cell foam based on Voronoi model. Mech. Mater. 68: 85-94). When the velocity is sufficiently high, the crushing bands are highly localized at the impact side, which is the I-shape deformation in usual (see Figure 8 (d)), and then propagate along the loading direction. While under moderate impact velocities, the V-shape deformation mode could be observed (see Figures 8 (b) and (c)). The deformation coincides with the previous correlated research of honeycomb. Figure 9 gives the deformation of a unit cell extracted from the central area of the c-a model. It can be seen that the cell walls bend at first, giving linear elastic deformation, beyond a critical strain the cells collapse by plastic yielding. After the yielding point, plastic hinges formulate at the section of maximum moment in the bent members. Under the low impact velocity, as in Figure 9 (a), the unit cell is overall crushed in the loading direction and stretched perpendicularly to the loading direction with more plastic hinges formulating. However, in the case of high impact velocity, collapse and plastic hinge firstly form in the part of the unit cell near the impact side with almost no deformation in the opposite part due to the inertia effect, and then the unit cell is overall crushed in the loading direction with little stretch perpendicularly to the loading direction. Cell collapse ends once the opposing cell walls begin to touch each other; as the cells close up the structure and its stiffness increases rapidly (Gibson and Ashby, 1997Gibson, L.J., Ashby, M.F., (1997). Cellular solids: structures and properties, 2nd ed. UK: Cambridge University Press.).

The deformation modes of uniform c-a model under different impact velocities: (a) quasi-static condition; (b) v = 10 m/s; (c) v = 30 m/s; (d) v = 50 m/s.

3.2.2 The graded c-a model
The uniform c-a model exhibits X-shape, V-shape and I-shape deformation corresponding to different impact velocities, but when the density gradient is introduced the specimen may present different deformations. So in this section, the graded models with β = 0.02 and -0.02 are taken into consideration.
When the relative density gradient is positive, the weakest layer is placed near to the impact side. Figures 10-12 show the deformation modes of graded c-a model with the gradient β = 0.02 for different impact velocities. It can be clearly observed that the I-shape deformation firstly occurs and then the V-shape collapse initiates ahead of the I-shape crushing bands under the low impact velocity, such as in Figures 10 (d) and 11(d). The difference in the two figures is that the V-shape collapse has reached the stationary side in Figure 10 (d) while not in Figure 11 (d), which may be because the inertia effect retards and localizes the V-shape deformation bands. Under high velocity impact, there is only the I-shape deformation in the crushing process. It is much different with the first two aforementioned deformation patterns of the uniform specimen. The deformation is mainly dominated by the quasi-static plateau stress of different layers under low velocity and quasi-static case, the initial crushing bands occur in the first layer (the weakest layer). Until the strength of this deformed layer reaches to the yield stress of the second layer, the crushing bands initiate in the next layer. Similar with uniform specimen, inertia effect plays the significant role in the crushing with the velocity increasing, so the deformation is much more localized at the impact end than before. The results agree with the deformation modes touched in the reference (Shen et al., 2013Shen, C.J., Lu, G., Yu, T.X., (2013). Dynamic behavior of graded honeycombs - A finite element study. Compos. Struct. 98: 282-293.).

Deformation profile of the graded c-a model in the quasi-static case with β = 0.02: (a) εN = 0.1; (b) εN = 0.25; (c) εN = 0.4; (d) εN = 0.6; (e) εN = 0.7.

Deformation profile of the graded c-a model with β = 0.02 and v = 25 m/s: (a) εN = 0.1; (b) εN = 0.25; (c) εN = 0.4; (d) εN = 0.6; (e) εN = 0.7.

Deformation profile of the graded c-a model with β = 0.02 and v = 50 m/s: (a) εN = 0.1; (b) εN = 0.25; (c) εN = 0.4; (d) εN = 0.6; (e) εN = 0.7.
When the relative density gradient is negative, the weakest layer locates approximate to the stationary side. Figures 13-16 illustrate the deformation patterns of graded c-a model with the gradient β = -0.02 for different impact velocities. The deformation, dominated by the quasi-static plateau stress of different layers, starts at the stationary side under the quasi-static condition, as in Figure 13, and just the I-shape deformation mode is observed during the crush. In the case of the low impact velocity, the deformation is affected by the quasi-static yielding strength combined with the inertia effect. In Figure 15, firstly the V-shape collapse of cells initiates from the impact side while little deformation occurs at the stationary side on account of the inertia effect, another V-shape collapse band is then observed in the weakest layer around εN = 0.5. Finally, the bands interact with each other until the whole structure is crushed. When the impact velocity is high, the inertia effect dominates the deformation compared with the quasi-static plateau stress, as in Figure 16, the I-shape deformation mode is observed. The collapse commences at the impact side and then propagates to the stationary side.

Deformation profile of the graded c-a model in the quasi-static case with β = -0.02: (a) εN = 0.15; (b) εN = 0.3; (c) εN = 0.5; (d) εN = 0.65; (e) εN = 0.75.

Deformation profile of the graded c-a model with β = -0.02 and v = 10 m/s: (a) εN = 0.15; (b) εN = 0.3; (c) εN = 0.5; (d) εN = 0.65; (e) εN = 0.75.

Deformation profile of the graded c-a model with β = -0.02 and v = 25 m/s: (a) εN = 0.15; (b) εN = 0.3; (c) εN = 0.5; (d) εN = 0.65; (e) εN = 0.75.

Deformation profile of the graded c-a model with β = -0.02 and v = 50 m/s: (a) εN = 0.15; (b) εN = 0.3; (c) εN = 0.5; (d) εN = 0.65; (e) εN = 0.75.
Comparing these figures, the uniform c-a model exhibits X-shape, V-shape and I-shape deformation corresponding to different impact velocities. However, when the positive relative density gradient is introduced, the I-shape deformation firstly occurs, the V-shape collapse initiates then ahead of the I-shape crushing bands mainly because of the quasi-static stress of different layers under low impact velocity, and just the I-shape deformation pattern is observed mostly due to the inertia effect under high velocity impact. For the specimen crushing with the negative relative density gradient, because of the quasi-static plateau stress combined with the inertia effect, two V-shape crushing bands are observed successively under low impact velocity, with the I-shape deformation under high impact velocity owing to inertia effect.
3.3 Crushing stress
In this section, the graded models with β = 0.02 and -0.02 are taken into consideration, and the dynamic stress in these graded specimens is investigated by analyzing the reaction stress of the two plates (the impact and stationary rigid plates). The nominal stress and nominal strain are defined as in Eq. (8).
Figures 17 and 18 depict the stress-strain relationships at both sides for the graded c-a model. On the one hand, the stress at the impact side is sensitive to the impact velocity owing to the inertia effect, which becomes much higher with the increase of the impact velocity. When the relative density gradient is positive, the weakest layer is placed near to the impact side, as mentioned before, the crushing starts from the weak layer to the strong layer, so the crushing stress increases with the increment of the nominal strain. However, for the negative gradient, under high velocity impact, the collapse initiates in the strong layer and propagates to the weak layer, so the crushing stress decreases as the nominal strain increases. In addition, as in Figure 17 (b), the nominal stress at v = 10 m/s approximates zero around 30% deformation, this may be because there is some oscillation for the strongest layer in the elastic stage near the loading side in crushing process. On the other hand, the plateau stress at the stationary side is almost the same as the quasi-static configuration in spite of the distinct impact velocities (Li et al., 2014Li, Z., Zhang, J., Fan, J., Wang, Z., Zhao, L., (2014). On crushing response of the three-dimensional closed-cell foam based on Voronoi model. Mech. Mater. 68: 85-94), nevertheless, there is some divergence when the density gradient is induced in the specimen. As in Figure 18, the crushing stress at stationary side is almost the same as the quasi-static case under low impact velocity. When the velocity is high, the yielding stress of different layers becomes a critical factor leading to the deviation of the stress at the stationary side from the quasi-static stress. Now taking the stress at v = 80 m/s as an example, in this case, the collapse is greatly localized at the impact side and propagates in the I-shape mode, so ahead of the wave front, the layer adjacent to the stationary plate is almost in the elastic stage or just before the initial collapse firstly, that means the stress at the stationary side is not higher than the quasi-static plateau stress of this layer. When the density gradient is negative, the weakest layer is placed near the stationary side, so the stress is close to the quasi-static plateau stress of the weakest layer and not increases sharply until the wave front reaches the stationary side.


Corresponding to Figure 18 (b), the local engineering strain field in the loading direction is given in Figure 19. In the figure, for v = 25 m/s, when εN = 0.2, the V-shape crushing band is observed before the I-shape crushing region while the weakest layer adjacent to the stationary side has little deformation, and around εN = 0.5, the nominal stress increases greatly as the V-shape deformation band forms in the weakest layer. For v = 80 m/s, when around εN = 0.7, the wave front just approaches to the stationary side, so the stress surges after this point. When the density gradient is positive, the weakest layer is placed near the impact side, so the crushing bands begin locally from this side and the stronger layer before the wave front is still in the elastic stage. Therefore, the crushing stress at the stationary side is equal to the quasi-static plateau stress of the layer just behind the wave front and then increases gradually as the strongest layer collapses. Corresponding to Figure 18 (a), Figure 20 gives the local engineering strain field in the loading direction, under v = 25 m/s, the wave front reaches to the second and the forth layer when the nominal strain is 0.2 and 0.5, respectively, so the crushing stress at the stationary side approximates to the corresponding quasi-static plateau stress. Under v = 80 m/s, it should be noticed that the crushing stress should be close to the quasi-static plateau stress of forth layer when εN = 0.5, but it is near zero in Figure 18 (a). This may be interpreted that the collapse localizes at the impact side and propagates in the I-shape mode, meanwhile the gradient amplitude of different layers is great, and the gradation is positive, this means the weakest layer is rapidly deforming and nearly all the kinetic energy is transformed into internal energy for crushing the cells at the front side.


For the low velocity impact, the stress of both plates is nearly the same as the quasi-static crushing stress, neglecting the inertia effect. On the other side, when the impact velocity is sufficiently high, the specimen deforms in the I-shape mode with the propagation of a plane plastic wave front, indicating that the shock wave theory may be applicable in this case. Considering the relative density gradient, Eq. (6) is modified into the formulation
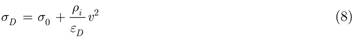
Figure 21 compares the simulated and analytical results of the nominal stress-strain curves with positive density gradient from Eq. (8) under different impact velocities. At the low velocity impact, compared with the simulated results, the analytical prediction agrees well with the simulations except for the prediction around εN = 0.6. This may be owing to the occurrence of the V-shape crushing bands before the compaction region in Figures 10 (d) and 11(d). And the nominal stress at both sides is almost the same and similar to the quasi-static crushing stress, but this at the impact side is much higher than the one at the stationary side which is equal to the quasi-static crushing stress under relative high velocity impact. Meanwhile, the analytical results almost coincide with the simulations at the impact side apart from some slight deviation which may be on account of the large density gradient amplitude. Figure 22 displays the nominal stress versus strain curves of the simulated and analytical results when the density gradient is 0.01. It can be found that the theoretical results are always in accordance well with the simulations. This reveals that the shock wave theory could be employed for the graded cellular structures with the positive density gradient.

The stress-strain relationship with positive gradient β = 0.02: (a) v = 10 m/s; (b) v = 25 m/s; (c) v = 50 m/s.

The stress-strain relationship with positive gradient β = 0.01: (a) v = 25 m/s; (b) v = 50 m/s.
As in Figure 18, it can be found that there is some divergence of the crushing stress at the stationary side and the quasi-static crushing stress when the density gradient is induced in the specimen. The crushing stress at stationary side is almost identical with the quasi-static case under low impact velocity, however, for the relative high velocity impact, because of the inertia effect, the crushing stress seems to be postponed compared with the quasi-static case. So in the shock wave theory, the stress at the stationary side, corresponding to the FE results at the impact side, is used to substitute the quasi-static plateau stress to calculate the analytical prediction. Figure 23 demonstrates the simulated and analytical results for different velocities when the density gradient is negative. Under the high velocity impact, because of the inertial effect, the stress at the loading side is much higher than that at the stationary side. The stress decreases with the increase of the nominal strain because the collapse occurs from the loading end with strong material to the supporting end with weak material. There is some deviation for the FE and analytical results even though the variation tendency is accordant. This is also owing to the large amplitude of density gradients.

3.4 Energy absorption capability
In this section, the graded models with β = 0.01, 0.02, 0, -0.01 and -0.02 are taken into consideration. The energy absorbed by the graded specimen under the dynamic loading conditions is investigated. And here, the absorbed energy is calculated by integrating the nominal stress-strain curves at the impact side under different impact loadings, the nominal stress and strain are defined as in section 3.1.
Figure 24 presents the energy absorbed by graded models with different density gradients subjected to low velocity and high velocity dynamic crushing. It can be found that, under dynamic loading, the density gradient does have some remarkable influence on the energy absorption capability. In the quasi-static case, at the early stage, introducing the density gradient decreases the energy absorption of the models up to crushing strain ~33% roughly and the uniform specimen absorbs the maximum energy for this crushing strain range. After this point, the graded model seems much better than the uniform one in energy absorption. Moreover, there are minimal differences between the response of graded specimens with positive and negative density gradients, as quantified in Figure 24 (a). Under low impact velocity (v ≥ 25 m/s), in the first phase, the energy absorbed by the negative graded model is the maximum while the positive graded model absorbs the minimum energy, afterwards, the models with positive gradient seem possess better energy absorption ability than other models. The reason can be found in the deformation profiles, such as in Figure 15, on the contrary with the positive graded model, for the model with negative gradient, the collapse initiates from the strongest layer because of inertia effect and then the weakest layer begins to deform, so the capability of energy absorption is enhanced firstly and weakened afterwards. When the impact velocity is sufficiently high, such as v = 50 m/s, the negative graded models always absorb much more energy than the positive graded and the uniform one until the energy approaches almost near the same value at a certain nominal strain. Notably, except for the elastic energy, regardless of the crushing velocities, the absorbed energy of the model with constant relative density (the uniform model) changes approximately linearly with the crushing nominal strain, this is because there is a almost constant stress plateau in the crushing process.

Relationship of the absorbed energy and the nominal strain: (a) quasi-static; (b) v = 10 m/s; (c) v = 25 m/s; (d) v = 50 m/s; (e) v = 80 m/s.
More remarkably, independent of the impact velocity, there seems always a certain nominal strain (or a small region of nominal strain under low velocity), nominated as a critical strain in Figure 24, where the energy absorbed by all these different specimens could approximate to nearly the same value. And the critical strain varies as the impact velocity changes, so based on Figure 24 this critical strain correlated with the impact velocity is plotted and fitted in the Figure 25. When the impact velocity is lower than 50 m/s, the data is described in the polynomial fitting as in Eq. (9.a),


And for the impact velocity larger than 50 m/s, the data is performed the exponential fitting in the formulation Eq. (9.b).

From Eq. (9.b), we could obtain the limit point-the limit strain, and the maximum nominal strain gradually approximate to the limit strain as the impact velocity increases. It hints that the energy absorbed by these different graded specimens is always equal to the same value after this limit strain. As aforementioned, the model with negative density gradient is not always of benefit concerning the energy absorption, in order to give the beneficial area, the strain-impact velocity plane is divided into five sections according to the influence of density gradient in Figure 24. In section I, the uniform model shows better energy absorption ability than a graded one, while in section II, the graded model seems better in energy absorption. The reason is that, in the quasi-static case, the inertia effect can be neglected so that the deformation always initiates from the weakest layer and then transmits to the stronger layers regardless the loading direction, and the stronger layer will dissipate more energy than the weak layer in the crushing process. Under low impact velocity, section III indicates that the cellular structure with positive density gradient has superior energy absorbing capability than others, this is because the crushing initiates from the impact side due to inertia effect and propagates from the weakest layer to the strongest one, after the critical strain, the strong layer starts to collapse and absorbs much more energy. However, for the specimen with negative density gradient, the strongest layer is placed adjacent to the impact plate and deforms firstly, so the negative graded model has conspicuous advantages in energy absorption before reaching the critical strain, and the section IV presents this favorable area. Under high impact loading, owing to the inertia effect, the deformation bands always begin from the impact side in the I-shape mode and propagate layer by layer thereafter, as observed in Figure 24 (e), the energy absorbed by these different graded models approaches the same value at the critical strain, and remains consistent with the nominal strain increasing. This uncovers the different density gradient has no influence on the energy absorption capability in the section V. Overall, the density gradient does have some remarkable influence on the energy absorption capability, and a certain density gradient is not always beneficial to the energy absorption. Additionally, for different impact velocities and density gradients, the deformation modes are different, as in section 3.2.2, thus this strain is correlated with the velocity and gradient, this is to say the results of Eq. 9 are case sensitive but the trend in Figure 25 is remarkable. To dispense with this case sensitivity, it still needs much more study.
4 CONCLUSIONS
In the paper, a new circle arc model was established to present the cellular structure. The dynamic response of the uniform and graded models under different constant velocities is simulated and analyzed by employing the Ls-dyna 971. The model verification indicates that the model size has some influence on the nominal stress at both sides until the number of the cells is sufficient. Different density gradients are introduced in the models to investigate the deformation modes, the crushing stress as well as the energy absorption capability.
The uniform c-a model exhibits X-shape, V-shape and I-shape deformation corresponding to different impact velocities. However, when the density gradient is introduced, the quasi-static plateau stress of different layers seems a significant parameter related to deformation mode except for the inertia effect. For the specimen with positive relative density gradient, the I-shape deformation firstly occurs, the V-shape collapse initiates then ahead of the I-shape crushing bands mainly because of the quasi-static stress of different layers under low impact velocity. For the negative graded model, two V-shape crushing bands successively appear under low impact velocity, with the I-shape deformation under high impact velocity. Compared with the density gradient, the impact velocity becomes much more vital on the deformation of the unit cell.
For one thing, the nominal stress at the impact side is sensitive to the impact velocity and the density gradient. For another, the stress at the stationary side is much correlated with the quasi-static plateau stress of different layers and the deformation modes. Furthermore, the shock wave theory is modified for the density gradient case, the analytical results indicates that the modificatory shock wave theory is still feasible in the graded cellular material.
The density gradient does have some remarkable influence on the energy absorption capability, and a certain density gradient is not always beneficial to the energy absorption. Irrespective of the impact velocity, there seems always a critical strain where the energy absorbed by all these different specimens could approximate to nearly the same value. So the critical strain - impact velocity plane gives the beneficial area for energy absorption pertinent to different density gradients and impact loading.
Acknowledgements
This work is supported by the National Natural Science Foundation of China (Grant Nos.11172196), Shanxi Scholarship Council of China (2013-046), the Top Young Academic Leaders of Shanxi, the Outstanding Innovative Teams of Higher Learning Institutions of Shanxi and the Graduate student innovation Fund of TYUT (B2014025). The financial contributions are gratefully acknowledged.
References
- Ajdari, A., Canavan, P., Nayeb-Hashemi, H., Warner, G., (2009). Mechanical properties of Functionally graded 2-D cellular structures: a finite element simulation. Mater. Sci. Eng. A 499: 434-439.
- Ajdari, A., Nayeb-Hashemi, H., Vaziri, A., (2011). Dynamic crushing and energy absorption of regular, irregular and functionally graded cellular structures. Int. J. Solids Struct. 48: 506-516.
- Ali, M., Qamhiyah, A., Flugrad, D., Shakoor, M., (2008). Theoretical and finite element study of a compact energy absorber. Adv. Eng. Soft. 39: 95-106.
- Blawi, S., Abot, J.L., (2008). A refined model for the effective in-plane elastic moduli of hexagonal honeycombs. Compos. Struct. 84: 147-158.
- Chen, C., Lu, T.J., Fleck, N.A., (1999). Effect of imperfections on the yielding of two- dimensional foams. J. Mech. Phys. Solids 47(11): 2235-2272.
- Cui, L., Kiernan, S., Gilchrist, M.D., (2009). Designing the energy absorption capacity of functionally graded foam materials. Mat. Sci. Eng. A 507: 215-225.
- Fan, J.H., Zhang, J.J., Wang, Z.H., Li, Z.Q., Zhao, L.M., (2013). Dynamic crushing behavior of random and functionally graded metal hollow sphere foams. Mater. Sci. Eng. A 561: 352-361.
- Gibson, L.J., Ashby, M.F., (1997). Cellular solids: structures and properties, 2nd ed. UK: Cambridge University Press.
- Gullett, P.M., Horstemeyer, M.F., Baskes, M.I., Fang, H., (2008). A deformation gradient tensor and strain tensors for atomistic simulations. Model Simul. Mater. Sci. Eng. 16(1): 5-11.
- Karagiozova, D., Alves, M. Primary and reflected compaction waves in a foam rod due to an axial impact by a small mass. Lat. Am. J. Solids Stru. in press.
- Kiernan, S., Cui, L., Gilchrist, M.D., (2009). Propagation of a stress wave through a virtual functionally graded foam. Int. J. Non-Linear Mech. 44 (5): 456-468.
- Li, J., Shimizu, F., (2005). Least-square atomic strain. http://mt.seas.upenn.edu/Archive/Graphics/A/annotate_atomic_strain/Doc/main.pdf
» http://mt.seas.upenn.edu/Archive/Graphics/A/annotate_atomic_strain/Doc/main.pdf - Li, K., Gao, X.L., Subhash, G., (2005). Effects of cell shape and cell wall thickness variations on the elastic properties of two-dimensional cellular solids. Int. J. Solids Struc. 42: 1777-1795.
- Li, K., Gao, X.L., Wang, J., (2007). Dynamic crushing behavior of honeycomb structures with irregular cell shapes and non-uniform cell wall thickness. Int. J. Solids Struct. 44: 5003-5026.
- Li, Q.M., Magkiriadis, I., Harrigan, J.J., (2006). Compressive strain at the onset of the densification of cellular solids. J. Cell Plast. 42(5): 371-392.
- Li, Q.M., Meng, H., (2002). Attenuation or enhancement-a one-dimensional analysis on shock transmission in the solid phase of a cellular material. Int. J. Impact Eng. 27: 1049-1065.
- Li, Z., Zhang, J., Fan, J., Wang, Z., Zhao, L., (2014). On crushing response of the three-dimensional closed-cell foam based on Voronoi model. Mech. Mater. 68: 85-94
- Liao, S.F., Zheng, Z.J., Yu, J.L., (2013). Dynamic crushing of 2D cellular structures: Local strain field and shock wave velocity. Int. J. Impact Eng. 57: 7-16.
- Ma, G.W., Ye, Z.Q., Shao, Z.S., (2009). Modeling loading rate effect on crushing stress of metallic cellular materials. Int. J. Impact Eng. 36: 775-782.
- Masters, I.G., Evans, K.E., (1996). Models for the elastic deformation of honeycombs. Compos. Struct. 35: 403-422.
- Papka, S.D., Kyriakides, S., (1994). In-plane compressive response and crushing of honeycomb. J. Mech. Phys. Solids 42: 1499-1532.
- Reddy, J.N., (2008). An introduction to continuum mechanics: with applications, New York: Cambridge University Press.
- Reid, S.R., Peng, C., (1997). Dynamic uniaxial crushing of wood. Int. J. Impact Eng. 19(5-6): 531-570.
- Ruan, D., Lu, G., Wang, B., Yu, T.X., (2003). In-plane dynamic crushing of honeycombs - a finite element study. Int. J. Impact Eng. 28(2): 161-182.
- Schaffner, G., Guo, X.D.E., Silva, M.J., Gibson, L.J., (2000). Modeling fatigue damage accumulation in two-dimensional Voronoi honeycombs. Int. J. Mech. Sci. 42(4): 645-656.
- Shen, C.J., Lu, G., Yu, T.X., (2013). Dynamic behavior of graded honeycombs - A finite element study. Compos. Struct. 98: 282-293.
- Song, Y.Z., Wang, Z.H., Zhao, L.M., Luo, J., (2010). Dynamic crushing behavior of 3D closed-cell foams based on Voronoi random model. Mater. Des. 31: 4281-4289.
- Tan, P.J., Reid, S.R., Harrigan, J.J., Zou, Z., Li, S., (2005). Dynamic compressive strength properties of aluminum foams. Part II-'shock' theory and comparison with experimental data and numerical models. J. Mech. Phys. Solids 53: 2206-2230.
- Tekoglu, C., Gibson, L.J., Pardoen, T., Onck, P.R., (2011). Size effects in foams: experiments and modeling. Prog. Mater. Sci. 56(2): 109-138.
- Wadley, H.N.G., Dharmasena, K.P., Chen, Y., Dudt, P., Knight, D., Charette, R., Kiddy, K., (2008). Compressive response of multilayered pyramidal lattices during underwater shock loading. Int. J. Impact Eng. 35: 1102-1114.
- Wang, Z.H., Ma, H.W., Zhao, L.M., Yang, G.T., (2006). Studies on the dynamic compressive properties of open-celled aluminum alloy foams. Scripta. mater. 54: 83-87.
- Wang, Z.H., Shen, J.H., Lu, G.X., Zhao, L.M., (2011). Compressive behavior of closed-cell aluminum alloy foams at medium strain rates. Mater. Sci. Eng. A 528(6): 2326-2330.
- Xu, S., Beynon, J.H., Ruan, D., Lu, G., (2012). Experimental study of the out-of plane dynamic compression of hexagonal honeycombs. Compos. Struct. 94: 2326-2336.
- Zeng, H.B., Pattofatto, S., Zhao, H., Girard, Y., Fascio, V., (2010). Impact behavior of hollow sphere agglomerates with density gradient. Int. J. Mech. Sci. 52: 680-688.
- Zheng, Z.J., Yu, J.L., (2005). Li JR. Dynamic crushing of 2D cellular structures: A finite element study. Int. J. Impact Eng. 32: 650-664.
- Zheng, Z.J., Liu, Y.D., Yu, J.L., Reid, S.R., (2012). Dynamic crushing of cellular materials: continuum-based wave models for the transitional and shock modes. Int. J. Impact Eng. 42: 66-79.
- Zhou, Z.W., Wang, Z.H., Zhao, L.M., Shu, X.F., (2012). Experimental investigation on the yield behavior of Nomex honeycombs under combined shear-compression. Lat. Am. J. Solids Stru. 9: 515-530.
- Zimmerman, J.A., Bammann, D.J., Gao, H., (2009). Deformation gradients for continuum mechanical analysis of atomistic simulations. Int. J. Solids Struct. 46(2): 238-253.
- Zou, Z., Reid, S.R., Tan, P.J., Li, S., Harrigan, J.J., (2009). Dynamic crushing of honeycombs and features of shock fronts. Int. J. Impact Eng. 36(1): 165-176.
APPENDIX
Based on the continuum mechanics, local deformation in the neighbourhood of a given node i is characterized by the transformation of node and its neighbouring nodes from the reference configuration to the current configuration. For homogeneous deformation, there exists a unique deformation gradient J (Reddy, 2008Reddy, J.N., (2008). An introduction to continuum mechanics: with applications, New York: Cambridge University Press.) and rji =  × J, where j is any node around node i, and J is the deformation gradient. However, deformation in cellular structures is always heterogeneous, thus node i with a specific deformation gradient J cannot accurately transform all of its neighbours from the reference configuration to the current configuration. Thus in the least square approximation, it is assumed that there exists an optimal local deformation gradient Ji defined at node i best mapping {} → {rij }, ∀j ∈ Nc , where Nc is the number of neighbouring nodes of node i within a cut-off radius Rc , as illustrated in Figure 3. And the least square mapping error at node i is defined as
Superscript T denotes the transpose of a matrix. The cut-off radius is introduced to specify a domain around a node, only the neighbouring nodes located within which are assumed to contribute to the formulation of the local deformation gradient at the node. The optimal local deformation gradient Ji is determined by minimizing the mapping error φi with ∂φi /∂Ji = 0, this (Li and Shimizu, 2005Li, J., Shimizu, F., (2005). Least-square atomic strain. http://mt.seas.upenn.edu/Archive/Graphics/A/annotate_atomic_strain/Doc/main.pdf.
http://mt.seas.upenn.edu/Archive/Graphic...
) is Ji = Vi -1 Wi where
It is assumed that node i is in zero-strain state if the determinant of matrix Vi equals zero. The Lagrangian or Green strain tensor, E, is defined with respect to the reference configuration as

Publication Dates
-
Publication in this collection
June 2015
History
-
Received
12 Oct 2014 -
Reviewed
19 Dec 2014 -
Accepted
12 Jan 2015

 Thumbnail
 Thumbnail
 Thumbnail
 Thumbnail
 Thumbnail
 Thumbnail
 Thumbnail
 Thumbnail
 Thumbnail
 Thumbnail


