Abstract
Structural reliability theory has long been recognized as the proper tool to guide selection of partial safety factors in limit state structural design codes. Brazilian design codes, however, have never been through this calibration process. This paper addresses the reliability-based calibration of partial safety factors of Brazilian design codes for loads (NBR8681:2003ABNT NBR 8681 (2003) Actions and safety of structures - procedure, Associação Brasileira de Normas Técnicas, Rio de Janeiro, RJ.), and for steel (NBR8800:2008ABNT NBR8800 (2008) Design of Steel and Steel-Concrete Composite Structures: Procedures, Associação Brasileira de Normas Técnicas, Rio de Janeiro, RJ.) and concrete (NBR6118:2014ABNT NBR6118 (2014) Design of concrete structures - procedure. Associação Brasileira de Normas Técnicas, Rio de Janeiro, RJ.) structures. The study is based on an extensive dataset of load and strength variables, addressing the Brazilian reality, as much as possible. Calibration minimizes the variations of reliability indexes of the most diverse structures designed according to the codes of interest, with regard to a target reliability index chosen by the analyst. The main result of calibration is to make reliability indexes more uniform, for different design configurations. In case of Brazilian codes, this could be achieved by increasing main variable loads, and reducing the combination values of secondary loads. This paper presents results that are not (yet) recommended for adoption in Brazilian codes, but which should be discussed with the community in order to reach minimal consensus.
Keywords:
code calibration; steel structures; concrete structures; reliability analysis; partial factor design; structural safety
1 INTRODUCTION
In the seventies and eighties, great efforts were made to produce more rational structural design procedures and codes. As a result of these efforts, allowable stress design was replaced by limit state design in most codes. Recognizing that different sources of uncertainties affect structural design, the single design factor of allowable stress design was replaced by partial safety factors, which reduce the design strength of materials or elements, and increases de design value of each load. This resulted in a more comprehensive way of creating the desired safety margins in design.
Parallel to this development, structural reliability theory was developed. The uncertainties in strength of materials and of structural members, uncertainties in loads, and uncertainties in engineering calculation models were described with use of probability theory. The concept of limit states was introduced, to analyze serviceability and ultimate states of a structure. The concepts of failure probability and reliability index were developed, and several techniques were developed to evaluate failure probabilities. These include the First and Second Order Reliability methods (FORM and SORM), Monte Carlo simulation and several variants. The main achievements of these decades were reported by the Joint Committee on Structural Safety (Vrouwenvelder, 1997Vrouwenvelder, T. (1997) Joint Committee on Structural Safety. Elsevier Science: Structural Safety, V. 19, n. 3, 245-251.; JCSS 2001JCSS (2001) Probabilistic Model Code, Joint Committee on Structural Safety, disponível em http://www.jcss.byg.dtu.dk/Publications/Probabilistic_ Model_Code.aspx, acessado em 16/06/2018.
http://www.jcss.byg.dtu.dk/Publications/...
) and by Ellingwood et al. (1980Ellingwood, B., Galambos, T.V., MacGregor, J.G., Cornell, C.A. (1980) Development of a Probability Based Load Criterion for American National Standard A58. U.S. National Bureau of Standard Special Publication 577. Washington, DC.).
With a more practical approach to design, the United States were the first to migrate to the partial safety factor format (which was called Load and Resistance Factor Design or LRFD). This migration was heavily supported in structural reliability theory, with calibration been used to find a new set of partial factors which would produce the same average reliability experienced with the allowable stress format being retired. This process is well documented in Ellingwood et al. (1980Ellingwood, B., Galambos, T.V., MacGregor, J.G., Cornell, C.A. (1980) Development of a Probability Based Load Criterion for American National Standard A58. U.S. National Bureau of Standard Special Publication 577. Washington, DC.) and Ellingwood and Galambos (1982)Ellingwood, B., Galambos, T.V. (1982) Probability-based criteria for structural design, Structural Safety 1, 15-26.. The process was later verified and refined, in the case of concrete structures, by Nowak and co-authors (Nowak and Szerszen, 2003Nowak, A.S., Szerszen, M.M. (2003) Calibration of design codes for buildings (ACI 318): Part 1 - Statistical model for resistance. ACI Structural Journal, V. 100, n. 3, 77-382. New York.; Szerszen and Nowak, 2003; Nowak et al., 2011; Nowak and Collins, 2012Nowak, A.S., Collins, K.R. (2012) Reliability of Structures, McGraw-Hill International Editions, Civil Engineering Series, 2nd Edition.).
The new Eurocodes migrated to the limit state design format more recently. Eurocode 0 (EN 1990:2002EN 1990 (2002) Basis of structural design, European Committee for Standardization, Eurocode, Brussels.) enforces the limit state design format, but each member state was allowed to develop their set of partial design factors. This is being done nowadays. Individual efforts are reported in Gayton et al. (2004Gayton, N., Mohamed, A., Sorensen, J.D., Pendola, M., Lemaire, M. (2004) Calibration methods for reliability-based design codes, Structural Safety 26, 91-121.), Gulvanessian and Holicky (2005Gulvanessian, H., Holicky, M. (2005) Eurocodes: using reliability analysis to combine action effects, Proceedings of the Institution of Civil Engineers, Structures and Buildings, Thomas Telford.), Holicky (2008)Holicky, M. (2008) Reliability-based analysis of codified design allowing for production quality, Proceedings of 4th International ASRANet Colloquium, Athens. and Holicky and Sykora (2011).
Brazilian structural design codes migrated to the limit state design format in the seventies, NB1-78 - Design and Construction of Concrete Structures, after some 10 years of studies. Since 1940, the first version of our NB1, the code had criteria for calculating flexure (1940) and composed flexure and compression (1950) in an “Ultimate Limit State” with only one safety factor. The commission of the 1978 version calibrated the new format, with four safety factors, based on some 30 years of experience. Along those 30 years the safety factor changed many times, arriving in 1960 to four different numbers applicable to: buildings beams and columns and bridge beams and columns. This is why Brazilian safety factors are different from those in Eurocodes. The idea of calibration is very important, but the safety should not be constant for all elements. For example, a column of a thirty store building should be safer in the 1st floor than in the last one, because of its responsibility. A bridge beam, with a height of 3.5m, spanning 70m, should be safer than a building beam, with 50cm, spanning 5m, also because of responsibility. In this paper, only building structures are addressed. The same calibration is performed for beams and columns, because load factors should be the same for these elements, and we believe responsibility differentiation should be made by adding responsibility factors (ideally), or by changing strength partial factors. In the calibration work presented herein, different target reliability indexes are used. Hence, present results can still guide the choice of different partial factors for elements with different responsibility. In future work, we should look at adding responsibility factors for increasing column reliability.
The partial design factors of Brazilian structural design codes were never calibrated using structural reliability theory. One difficulty has always been the lack of data reflecting the local reality of loads, material strengths and calculation models. A first attempt to reliability-based calibration was made by Beck and Souza Jr. (2010Beck, A.T., Souza Jr, A.C. (2010) A first attempt towards reliability-based calibration of Brazilian structural design codes. J, of the Braz. Soc of Mech. Sci & Eng. V.32, 119-127.), but limited to the case of bending of steel elements. Reliability-based design factors for prestressed concrete bridges were proposed by Nova and Silva (2017Nova, S.J.S., Silva, M.C.A.T. (2017) Cálculo dos Coeficientes Parciais de Segurança para Pontes de Concreto Protendido sob Solicitações Normais com Base na Teoria de Confiabilidade Estrutural, 59º Congresso Brasileiro do Concreto. Bento Gonçalves, IBRACON.). Studies on reliability of concrete beams and slabs, not addressing calibration, were reported by Stucchi and Santos (2007Stucchi, F.R., Santos, S. H. C. (2007) Reliability based comparison between ACI 318-05 and NBR 6118. Revista Ibracon de Estruturas, São Paulo, V. 3, n. 2.) and Santos et al. (2014Santos, D.M., Stucchi, F.R., Beck, A.T. (2014) Confiabilidade de vigas projetadas de acordo com as normas brasileiras. Revista IBRACON de Estruturas e Materiais 7, 723-746., 2015Santos, D.M., Stucchi, F.R., Beck, A.T. (2015) Discussion of: Concrete structures. Contribution to the safety assessment of existing structures. Revista IBRACON de Estruturas e Materiais 8, 744 - 748.). Studies on reliability of columns were reported by Oliveira et al. (2008Oliveira, W.L.A., Beck, A.T., El Debs, A.L.H.C. (2008) Safety evaluation of circular concrete-filled steel columns designed according to Brazilian building code NBR 8800:2008. IBRACON Structures and Materials Journal 1, 212-236.), Beck et al. (2009) and Pereira et al. (2017Pereira, M.F., Beck, A.T., El Debs, A.L.H.C. (2017) Reliability of partially encased steel-concrete composite columns under eccentric loading, IBRACON Structures and Materials Journal 10, 298-316.). The reliability against punching of concrete structures designed to comply with NBR6118 were addressed by Carvalho et al. (2017Carvalho, M.L., Silva, C.R., Stucchi, F.R. (2017) Study on reliability of punching shear of flat slabs without shear reinforcement according to NBR6118, IBRACON Structures and Materials Journal 10, 276-297.) and da Silva et al. (2018)Silva, G.R., Campos Filho, A., Real, M.V. (2018) Reliability of internal column-slab connection under punching according to NBR 6118:2014, IBRACON Structures and Materials Journal 11, 931-948.. Reliability of structures designed to comply with NBR6118 in serviceability limit states was addressed by Corelhano et al. (2012Corelhano, G., Correa, M.R.S., Beck, A.T. (2012) Confiabilidade de edifícios no estado limite de serviço para deslocamentos horizontais máximos, IBRACON Structures and Materials Journal 5, 84-103.).
This paper reports the first comprehensive study on reliability based calibration of partial factors of Brazilian design codes. The study addresses steel structures (NBR8800:2008), reinforced concrete structures (NBR6118:2014), and the design code for loads and safety of structures (NBR8681:2003). The study addresses steel beams in bending and shear, linear elements under tensile and compressive loads, and bolted connections. The study also addresses reinforced concrete beams in bending and shear, beam-columns subject to compressive bending, RC slabs subject to bending, and prestressed beams under bending. The study includes a comprehensive database of statistics obtained for the Brazilian reality, in terms of strengths of materials, loads and NBR calculation models. The study proposes a new set of partial safety coefficients to be used in design. The study is not conclusive, for reasons reported later on.
The remainder of the paper is organized as follows. Brazilian statistics for material strengths, loads and calculation models are presented in Section 2. Structural design and reliability analysis are explained in Section 3. The calibration procedure is briefly described in Section 4. Results are presented in Section 5, and concluding remarks in Section 6. Two appendix detail the strength equations for the structural elements considered in the calibration.
2 BRAZILIAN STATISTICS
This item presents a summary of statistics reflecting the Brazilian reality, reported in greater detail in Santiago (2019Santiago, W.C. (2019) Reliability-Based Calibration of Partial Safety Factors from Main Brazilian Codes. Thesis (D.Sc.), São Carlos School of Engineering, University of São Paulo.). All probability distributions reported herein passed goodness-of-fit tests Chi-Square, Anderson-Darling and Kolmogorov-Smirnov, after exclusion of outliers from data.
2.1 Concrete strength and model error variables
The following strength variables related to concrete structures built in Brazil were collected in this study: concrete compressive strength (), yield strength of reinforcing bars (), tensile strength of prestressing strands (), cross section dimensions ( and ), effective depth ( and ), area of prestressing strands () and model uncertainties ().
2.1.1 Concrete compressive strength
The characteristics of the random variable resistance were derived from results of axial compression tests, performed at 28 days, in more than 39 thousand cylindrical specimens of concrete, molded “in loco” all over Brazil, between 2011 and 2016, as reported by Santiago and Beck (2017aSantiago, W.C., Beck, A.T. (2017a) A new study of Brazilian concrete strength conformance. Revista IBRACON de Estruturas e Materiais, V. 10, n. 4, 906-923.), Santiago and Beck (2017b)Santiago, W.C., Beck, A.T. (2017b) Um estudo da conformidade da resistência do concreto convencional produzido no Brasil, 59º Congresso Brasileiro do Concreto. Bento Gonçalves, IBRACON. and Santiago and Beck (2018)Santiago, W.C., Beck, A.T. (2018) Um estudo da conformidade do concreto de resistência moderada produzido no Brasil, 60º Congresso Brasileiro do Concreto. Foz do Iguaçu, IBRACON..
Table 1 presents the results concerning this variable, where the mean (µ) is expressed as a function of the characteristic strength of concrete (). The data were provided by the following educational institutions and companies: AJL, UFAL, CONSULTARE, CSP, EGELTE, ITAIPU BINACIONAL, FACENS, UNIVASF, MPA, SENAI-DF, SILCO, TECNOL, TECNOCON and VENTURSCORE (Personal communication, 2018).
2.1.2 Yield strength of reinforcing bars
The characteristics of random variable were obtained from results of tensile tests performed in approximately nine thousand samples of CA-50 reinforcing bars, with different diameters, and produced in several batches in Brazil throughout 2016.
Results about this variable are shown in Table 2, where the mean is expressed as a function of the characteristic yield strength of reinforcing bars (). The data were provided directly by ArcelorMittal, which is the largest producer of steel in Latin American, and one of the main manufacturers of reinforcing bars in Brazil (Personal communication, 2016).
2.1.3 Tensile strength of prestressing strand
The characteristics of random variable were obtained from tensile tests performed in more than four thousand samples of CP 190 low-relaxation prestressing strands, with different cross-sections, produced in Brazil between 2011 and 2015. Results in terms of the characteristic tensile strength are also presented in Table 2. The data were provided directly by ArcelorMittal, which is one of the main manufacturers of prestressing strands in Brazil.
2.1.4 Cross-section area of pre-stressing strand
The random variable was obtained from dimensional analysis performed in more than one thousand samples of CP 190 low-relaxation prestressing strands, with different cross-sections, produced in Brazil between 2011 and 2015. Results are presented in terms of the nominal area () in Table 2. The data were also provided by ArcelorMittal.
2.1.5 Concrete cross section and effective depth of reinforcement
The geometrical random variables height (), width (), effective depth from the top of rectangular sections to the centroid of reinforcing bars () and effective depth from the top of the section to the centroid of prestressing strand () were obtained from the recommendations of JCSS (2001) and of Brazilian code NBR14931:2004ABNT NBR 14931 (2004) Execution of concrete structures - procedure. Associação Brasileira de Normas Técnicas, Rio de Janeiro, RJ.. Results are shown in Table 3, expressed in terms of their nominal values (hn, bn, and ); standard deviations are expressed in millimeters.
2.1.6 Professional factors or resistance model uncertainties
Model error variables () measure the deviation between model-predicted strengths of structural elements, and the strengths observed in the actual structures. The strength models considered in this section are those of NBR6118:2014, which are briefly described in Appendix A. Results are summarized in Table 4. The original reference to each result is presented in the last column of Table 4. Further details are given in Santiago (2019Santiago, W.C. (2019) Reliability-Based Calibration of Partial Safety Factors from Main Brazilian Codes. Thesis (D.Sc.), São Carlos School of Engineering, University of São Paulo.).
2.2 Steel strength and model error variables
The following strength variables related to steel structures built in Brazil were collected in this study: yield strength of steel members (), ultimate strength of steel members (), depth (), web thickness (), area ( e ), section modulus (Z and W), ultimate strength of steel bolts (), diameter of steel bolts () and model uncertainties ().
2.2.1 Yield and ultimate strength of steel members
The characteristics of random variables and were derived from results of tensile tests performed in more than one thousand samples of two types of structural steel (ASTM A36 and ASTM A572 GR50), both manufactured between 2011 and 2016 in Brazil and China.
Table 5 presents the results concerning these variables, where the mean (µ) is expressed as a function of the characteristic yield or ultimate strength of steel members (). The data were provided by the following companies: ArcelorMittal, SIDERTEC and Aço Vertical Edificações.
2.2.2 Geometry of steel members
The characteristics of random variables depth (d) and web thickness () were obtained from the JCSS (2001), as well as the Brazilian codes NBR15980:2011ABNT NBR 15980 (2011) Rolled steel shapes for structural use - dimensions and tolerances. Associação Brasileira de Normas Técnicas, Rio de Janeiro, RJ., NBR 5884:2013ABNT NBR 5884 (2013) Structural profile type I welded steel joint by electric arc - requirements. Associação Brasileira de Normas Técnicas, Rio de Janeiro, RJ. and NBR 11888:2015ABNT NBR 11888 (2015) Sheet and coils of carbon and high strength alloy steel - general requirements. Associação Brasileira de Normas Técnicas, Rio de Janeiro, RJ.. Results are shown in Table 6, expressed in terms of their nominal values (dn and twn); the standard deviations are expressed in millimeters.
2.2.3 Geometric properties of steel members
The characteristics of random variables gross area (), effective net area (), plastic section modulus (Z) and elastic section modulus (W) were obtained from the recommendations of JCSS (2001). Results are shown in Table 7, expressed in terms of nominal values (Agn, Aen, and ).
2.2.4 Ultimate strength and diameter of steel bolts
The characteristics of the random variables and were obtained from tensile tests and dimensional evaluations performed in more than two hundred samples of ASTM A325 structural bolts, with different diameters, produced in Brazil between 2016 and 2017. Results in terms of the characteristic tensile strength and of the nominal diameters are presented in Table 8. The data were provided directly by HARD and Walsywa, which are the main manufacturers of bolts in Brazil.
2.2.5 Professional factors or resistance model uncertainties
The random variable concerning to strength models considered in this section are those of NBR8800:2008, which are briefly described in Appendix B. Results are summarized in Table 9. The original reference to each result is presented in the last column of Table 9. Further details are given in Santiago (2019Santiago, W.C. (2019) Reliability-Based Calibration of Partial Safety Factors from Main Brazilian Codes. Thesis (D.Sc.), São Carlos School of Engineering, University of São Paulo.).
2.3 Load Variables
Accidental and environmental (wind, snow, earthquakes) loads acting on structures are random processes in time. As such, there is uncertainty about their maximum intensities, but also about the time at which these intensities occur. Nominal values for time-varying loads are obtained by choosing a mean return period, which is related (but not equal) to the design life of a given structure. For usual structures, such as buildings and bridges, and usual loadings, such as accidental and wind loads, the mean return period of foreign codes varies between 140 and 200 years. In the past, using the 50-year mean return period was common. In this paper, nominal values of accidental load and wind load are denoted and , respectively. Regardless of which return period is used to define nominal values for actions, reliability analysis is usually performed for a design life of fifty years.
In Brazil, NBR 8681:2003 states, in free translation: “the characteristic values of variable actions, established by consensus and indicated in specific codes, correspond to values which have 25% to 35% probability of being exceeded, in the unfavorable sense, in a period of 50 years”. Considering the Gumbel distribution for maxima, which is frequently used to represent yearly and fifty year extremes (see Tables 10 and 11), these values correspond to mean return periods of 170 and 116 years, respectively.
The maximum intensity of a load process in a given time interval is a random variable, which depends on the length of the interval. The maximum wind pressure acting on a structure, in 50 years, is denoted W50 in this paper. It is a random variable with Gumbel distribution, as argued in Beck and Correa (2013Beck, A.T., Correa, M.R.S. (2013) New Design Chart for Basic Wind Speeds in Brazil. Latin American Journal of Solids and Structures 10, 707-723.). In a similar way, the maximum live load on a structure, in a period of 50 years, is a random variable, denoted in this paper.
A significant problem in reliability analysis of structures submitted to two or more time-varying loads is to find the maximum combined load effect. One practical case is the sum of live load () and wind load (): .
In a given time interval (50 years, for instance), the maximum intensity of the sum of two load processes is generally not the sum of the maximum intensities of each load (), because usually the maximum value of the two processes do not coincide in time. Finding the maximum intensity of the sum of two or more stochastic load processes is a non-trivial load combination problem, as described in Melchers and Beck (2018Melchers, R.E., Beck, A.T. (2018) Structural Reliability Analysis and Prediction, 3nd edition, John Wiley and Sons.) and Beck (2019)Beck, A.T. (2019) Confiabilidade e Segurança das Estruturas, Elsevier, 448 páginas. ISBN: 978-85-352-8688-5.
In code calibration process, it is customary to consider the so-called Turkstra load combination rule (Melchers and Beck, 2018Melchers, R.E., Beck, A.T. (2018) Structural Reliability Analysis and Prediction, 3nd edition, John Wiley and Sons.; Beck, 2019). The maximum value of the sum of two load processes is approximated as the sum of the maximum value of one load process, in the given time interval, and the arbitrary point-in-time (apt) value of the other load. Since there are two processes, two combinations are possible, and the largest value should be considered. With the notation introduced earlier, this becomes:
where is the average point-in-time value for the accidental load, and is the maximum annual wind load (it is customary to use the maximum annual wind load instead of the arbitrary point-in-time value). The same reasoning leads to the combination values for secondary actions in codified design.
In this study, we consider Brazilian values for variables dead load (), live loads ( and ), wind loads (and) and load model uncertainties (). Use of the Turkstra load combination rule (Eq. 1) is usual in code calibration process, but it should be reviewed and avoided in the future.
2.3.1 Dead load
The dead load random variable corresponds to the action of gravity on the mass of structural and non-structural elements of a structure. This random variable should reflect the accuracy with which engineers are able to estimate self-weight of structural and non-structural elements. This is usually done by multiplying the volume of each material by its specific weight. Surely, any single engineer will have a lot of confidence about his evaluation of this value. In code calibration process, however, variable should reflect the uncertainty resulting from the calculations of all design offices acting in a given country. Different engineers or offices have different approaches to quantifying filling quantities, thickness of plaster, etc; and they use different tables for self-weight. Hence, the national value for will reflect a much larger uncertainty than that of a single individual.
The ideal way of obtaining statistics for would be to get different structural engineers to design example buildings, and then weight all material going in and coming out of the actual construction site. As this is very difficult to achieve, the next best thing is to just compare the estimates of self-weight obtained by different engineers for the same building. In this work, a single usual building was considered. The CAD design files were sent to different design offices, and D was estimated from the deviation between results. Results are presented in Table 10, in terms of the nominal dead load value (). These results are compared with results used by Ellingwood et al. (1980Ellingwood, B., Galambos, T.V., MacGregor, J.G., Cornell, C.A. (1980) Development of a Probability Based Load Criterion for American National Standard A58. U.S. National Bureau of Standard Special Publication 577. Washington, DC.) in the calibration of ASCE design codes (ASCE, 2016ASCE/SEI 7 (2016) Minimum Design Loads for Buildings and other Structures. American Society of Civil Engineering. Washington, DC.). We observe that the values are compatible.
The following structural engineers took part of the study: Carlos Baccini, Cesar Pinto, Daniel Miranda, Douglas Couto, Enio Barbosa, Fernando Stucchi, Josafá de Oliveira Filho, Luiz Cabral, Murilo Marques, Paulo Sousa, Rodrigo Numberg and Vitor Hugo.
2.3.2 Accidental or live load
A stochastic model for live loads is proposed in the Probabilistic Model Code (JCSS, 2001). This model considers the fluctuations in time and in space of usual life loads in buildings, as well as a sum of sustained and intermittent terms. Details of this stochastic model are found in JCSS (2001) and in Melchers and Beck (2018Melchers, R.E., Beck, A.T. (2018) Structural Reliability Analysis and Prediction, 3nd edition, John Wiley and Sons.).
In this paper, a stochastic model for live loads was implemented and studied, considering tributary areas of 20 and 30 m2, and two shape factor values: 2.0 and 2.4. The only adaptation to Brazilian reality, in this case, was to evaluate the parameters of and with respect to the nominal values () prescribed in Brazilian Code NBR 6120:1980 “Loads for structural design”1 1 An updated version was published late 2019 (NBR6120:2019), after results herein had been processed. . Details of the simulation procedure are presented in Santiago (2019Santiago, W.C. (2019) Reliability-Based Calibration of Partial Safety Factors from Main Brazilian Codes. Thesis (D.Sc.), São Carlos School of Engineering, University of São Paulo.).
Results obtained in our simulation are shown in Table 10, and compared to foreign values in Table 11. It is observed that obtained results for the arbitrary point-in-time load () are identical to those obtained and used by Ellingwood et al. (1980Ellingwood, B., Galambos, T.V., MacGregor, J.G., Cornell, C.A. (1980) Development of a Probability Based Load Criterion for American National Standard A58. U.S. National Bureau of Standard Special Publication 577. Washington, DC.). Results obtained for the fifty-year extreme load () are somewhat different. The mean value we obtained () is the same obtained by Ellingwood et al. (1980); yet our coefficient of variation (c.o.v.) is significantly larger. We are not sure which live load model was employed by Ellingwood et al. (1980). The c.o.v. we obtained (0.4) is slightly larger than the one (0.35) obtained by Holicky & Sykora (2011Holicky, M, Sykora, M. (2011) Conventional probabilistic models for calibration of codes. Applications of Statistics and Probability in Civil Engineering (ICASP11), London.), and that (0.18) obtained by Szerszen & Nowak (2003Szerszen, M.M., Nowak, A.S., (2003) Calibration of design codes for buildings (ACI 318): Part 2 - Reliability analysis and resistance factors. ACI Structural Journal, V. 100, n. 3, 383-391. New York.).
The JCSS (2001) live load model employed herein is well described in the literature, and inspires more confidence than the models used by Ellingwood et al. (1980Ellingwood, B., Galambos, T.V., MacGregor, J.G., Cornell, C.A. (1980) Development of a Probability Based Load Criterion for American National Standard A58. U.S. National Bureau of Standard Special Publication 577. Washington, DC.), Szerszen and Nowak (2003Szerszen, M.M., Nowak, A.S., (2003) Calibration of design codes for buildings (ACI 318): Part 2 - Reliability analysis and resistance factors. ACI Structural Journal, V. 100, n. 3, 383-391. New York.) and Holicky & Sykora (2011Holicky, M, Sykora, M. (2011) Conventional probabilistic models for calibration of codes. Applications of Statistics and Probability in Civil Engineering (ICASP11), London.). For the statistics employed herein ()), the probability that nominal load () is exceeded in fifty years is 43%, and mean return period is 116 years. These values do not comply exactly with NBR 8681: 2003, which states that exceedance probability of nominal loads in 50 years should be between 25 and 35%. However, this return period is in agreement with the recently updated version of NBR 6120:2019, which states that the return period should be between 174 and 117 years.
Past studies on reliability analysis of steel, concrete and composite structures designed following Brazilian codes have used smaller coefficients of variation (c.o.v.) for live load: Stucchi and Santos (2007Stucchi, F.R., Santos, S. H. C. (2007) Reliability based comparison between ACI 318-05 and NBR 6118. Revista Ibracon de Estruturas, São Paulo, V. 3, n. 2.), Santos et al. (2014, 2015) and Pereira et al. (2017Pereira, M.F., Beck, A.T., El Debs, A.L.H.C. (2017) Reliability of partially encased steel-concrete composite columns under eccentric loading, IBRACON Structures and Materials Journal 10, 298-316.) have used 20% or less; Beck and Dória (2008Beck, A.T., Dória, A.S. (2008) Reliability analysis of I-section steel columns designed according to new Brazilian building codes. Journal of the Brazilian Society of Mechanical Sciences and Engineering 30, 152 - 159.), Oliveira et al. (2008Oliveira, W.L.A., Beck, A.T., El Debs, A.L.H.C. (2008) Safety evaluation of circular concrete-filled steel columns designed according to Brazilian building code NBR 8800:2008. IBRACON Structures and Materials Journal 1, 212-236.), Beck et al. (2009) and Beck and Souza Jr. (2010) used 25%. These papers used as reference the works of Ellingwood et al. (1980Ellingwood, B., Galambos, T.V., MacGregor, J.G., Cornell, C.A. (1980) Development of a Probability Based Load Criterion for American National Standard A58. U.S. National Bureau of Standard Special Publication 577. Washington, DC.) and Szerszen and Nowak (2003Szerszen, M.M., Nowak, A.S., (2003) Calibration of design codes for buildings (ACI 318): Part 2 - Reliability analysis and resistance factors. ACI Structural Journal, V. 100, n. 3, 383-391. New York.). Moreover, with the exception of Beck and Souza Jr. (2010), the above authors considered life load as single variable action, whereas herein life and wind loads are combined. Hence, we expect our reliability indexes to be smaller than those found by these authors.
The results shown in Table 10 for live loads are the averages of the results obtained for different floor area uses (office, residential, hospital, school and library). Results for these particular uses are detailed in Santiago (2019Santiago, W.C. (2019) Reliability-Based Calibration of Partial Safety Factors from Main Brazilian Codes. Thesis (D.Sc.), São Carlos School of Engineering, University of São Paulo.).
2.3.3 Wind load
Beck and Souza Jr. (2010Beck, A.T., Souza Jr, A.C. (2010) A first attempt towards reliability-based calibration of Brazilian structural design codes. J, of the Braz. Soc of Mech. Sci & Eng. V.32, 119-127.) investigated the statistics of wind loads in Brazil. Beck and Correa (2013) proposed the updating of design winds of NBR 6123:1988, which are long outdated. There is current work being done with respect to updating NBR 6123, but new design charts are not yet ready.
Based on the outdated design charts of NBR 6123:1988, Beck and Souza Jr. (2010Beck, A.T., Souza Jr, A.C. (2010) A first attempt towards reliability-based calibration of Brazilian structural design codes. J, of the Braz. Soc of Mech. Sci & Eng. V.32, 119-127.) derived extreme wind statistics for Brazil, as reported in Table 10. The table reports one-year () and fifty-year () extreme values for wind pressure. The relation between wind speeds and pressures is described in Beck and Correa (2013) or Melchers and Beck (2018Melchers, R.E., Beck, A.T. (2018) Structural Reliability Analysis and Prediction, 3nd edition, John Wiley and Sons.). The corresponding statistics for wind speeds are ) and ), with being the design wind from NBR 6123:1988.
Brazilian statistics are compared with those used in the calibration of ASCE codes in Table 11. We notice that the c.o.v. value for is smaller in Brazil (0.47 against 0.59), with same mean value. For the c.o.v.s are virtually the same, but the Brazilian mean is larger; this can be attributed to different design values being used in the countries. The data used to derive the above statistics (Riera and Rocha, 1998Riera J.D., Rocha M.M. (1998). Load definition for wind design and reliability assessments: extreme wind climate. Capítulo em Rieira e Davenport (eds.), Wind effects on Buildings and Structures, Balkema, Rotterdam.) is not (necessarily) the same used to obtain nominal wind speeds reported in NBR6123:1988. Using wind speed statistics reported in Beck and Souza Jr. (2010Beck, A.T., Souza Jr, A.C. (2010) A first attempt towards reliability-based calibration of Brazilian structural design codes. J, of the Braz. Soc of Mech. Sci & Eng. V.32, 119-127.), we find that the above model for leads in a probability of 28% that nominal wind load () is exceeded in fifty years, and a mean return period of 179 years. This is a surprising result, as according to NBR 6123:1988, the basic design wind speed () should be exceeded on average once every 50 years, which corresponds to a mean return period of 50 years. We believe this difference is due to use of different probabilistic models, and/or due to conservativeness in evaluating design wind speeds in NBR6123:1988. Nevertheless, the wind pressure statistics reported in Table 10 are compatible with the required 25 to 35% exceedance probability of NBR8681:2003.
2.3.4 Load model uncertainties
The random variable describing load model uncertainties () was based on definitions of the JCSS (2001), due the lack of other data. Statistics used herein are reported in Table 12 for completeness.
2.3.5 On the compatibility between stochastic models for variable loads and their nominal values
The Brazilian code on Actions and Safety of Structures (NBR8681:2003), and the codes that specify nominal values for life loads (NBR6120:2019ABNT NBR 6120 (2019) Cargas para o cálculo de estruturas de edificações. Associação Brasileira de Normas Técnicas, Rio de Janeiro, RJ.) and for wind loads (NBR6123:1988ABNT NBR 6123 (1988) Wind Loads in Buildings, Associação Brasileira de Normas Técnicas, Rio de Janeiro, RJ.) do not describe the probabilistic models from which nominal values were derived. NBR 6123:1988 specifically states that nominal winds in design charts (v0) where evaluated for mean return period of 50 years; hence, the probability of exceedance in 50 years is 63%, in clear contradiction to the text of NBR8681:2003. The recently superseded code NBR6120:1980ABNT NBR 6120 (1980) Cargas para o cálculo de estruturas de edificações. Associação Brasileira de Normas Técnicas, Rio de Janeiro, RJ. did not mention the return period in which nominal values were based. The updated code NBR6120:2019 mentions the exceedance probabilities of 25 to 35%, and the mean return periods of 174 to 117 years, but the nominal design values are very similar.
Considering the limitations above, it is not surprising that the stochastic models for live loads and for wind loads, which have been used herein, do not comply exactly with the requirements of NBR8681:2003 and NBR6120:2019. However, considering that we do not have alternative stochastic model for variable loads, and that there was a good match in terms of return periods, we understand that the models in Table 10 are representative of the Brazilian reality.
The design code for wind loads NBR6123:1988 is currently being updated, and we expect that new design winds be evaluated for mean return periods between 170 and 116 years, to make this code compatible with NBR8681:2003.
Tree alternatives are proposed herein for making the stochastic live load model more compatible with requirements of NBR8681:2003 and NBR6120:2019: using ), ) or ). The three alternatives have nominal value with mean return period of 116 years. For the three alternatives, has exceedance probability of 35% in fifty years. These alternatives are presented here for discussion only; they are not employed in the current analysis.
3 STRUCTURAL DESIGN AND RELIABILITY ANALYSIS
In this paper, we use the notation of ASCE codes (ASCE, 2016) because it is more explicit and easy to follow. Hence, D is for dead load, L is for live load (called accidental load in Brazilian standards) and W is for wind loads. Using this notation, the basic load combination equations of NBR8681:2003 and NBR6118:2014 can be written as:
where is the design strength; is the design load; is the partial safety factor for dead load; and are partial safety factors for the main variable load, and ´s are load combination factors, for the secondary variable load in the combination. Following the Turkstra load combination rule (Eq. 1), which is the theoretical basis for Equation (2), the load combination factors should reduce the extreme value of a given action to its “arbitrary point-in-time” value, or similar. Hence, it can be observed that there is no theoretical justification for the reduced value for wind being , or for the reduced value for live load being . For practical design using NBR6118:2014, this does not make much difference, because . From a theoretical point of view, however, it is more appropriate to consider the load combination from NBR8800:2008, which is also the format of the EUROCODES:
This is the format adopted herein. Hence, partial factors are calibrated following Eq. (3), and this format is recommended to be adopted in future revisions of NBR8681 and NBR6118. After calibration, the partial factors become different (); hence, the format in Eq. (2) is no longer justified.
In usual structural design, the nominal loads are given, and member strength is determined such as to make in Eqs. (2) or (3). In code calibration process, it is easier to reverse the procedure: element cross-section and reinforcement ratio are given, and the design equation is used to evaluate the allowable loading, for a given (pre-defined) ratio between loads.
Let and denote the ratios between nominal values of live and dead loads, and wind and dead loads, respectively. In this paper, the following load ratios are considered:
By dividing both sides of Eq. (3) by the nominal dead load , this equation becomes a function of the load ratios. By choosing a member configuration and evaluating its design strength, using the partial factors or , and using the characteristic strength of the materials, Eq. (3) can be written in terms of the nominal dead load:
With evaluated, and are obtained from the specified load ratios (Eq. (4)). From the data in Table 10, the probability distribution of the loads is readily evaluated.
Reliability analysis is done using limit state functions derived from Eq. (3). The partial safety factors are removed (safety margin has already been incorporated in design, eq. (5)), and nominal values of loads and characteristic values of material strengths are replaced by the corresponding random variables:
where is the vector of random variables.
In Eq. (6), is a member strength function, the same used to evaluate the design strength . This function is described in Appendix, for the most relevant structural configurations considered in this paper. Also in Eq. (6), is a load effect function, which is considered the identity function in this paper. In Eq. (6), the random resistance and the random load effect are multiplied by the respective model error variables, described in Tables (9) and (11).
The failure probability, for each limit state, is obtained as:
where is the failure domain, and is the joint probability distribution of the random variable vector . The random variables are assumed as independent; hence, is obtained as the product of the marginal distributions (Melchers and Beck, 2018Melchers, R.E., Beck, A.T. (2018) Structural Reliability Analysis and Prediction, 3nd edition, John Wiley and Sons.).
As will be evident in the results section, the most relevant random variables in the calibration problem are , and . Since the limit state functions (Eq. 6) are linear in these variables, and the marginal probability distributions are not excessively non-Gaussian, accurate estimates of the failure probability are obtained using the First Order Reliability Method or FORM (Melchers and Beck, 2018Melchers, R.E., Beck, A.T. (2018) Structural Reliability Analysis and Prediction, 3nd edition, John Wiley and Sons.; Beck, 2019). In the FORM method, Eq. (7) is mapped to standard Gaussian space; an optimization problem is solved to find the design point (the point over the limit state function, closest to the origin); and the limit state function is linearized at the design point. The reliability index () is the distance between the design point and the origin. The first order estimate of the failure probability is obtained as:
As will be shown in the sequence, the calibration problem is formulated directly in terms of reliability indexes. Since the two limit state equations (Eq. 6) represent two loading cases for the same failure mode of the structural element, the smallest reliability index is considered.
One advantage of using FORM to evaluate Eq. (7) is that sensitivity factors are readily available, as sub-products of the solution. Sensitivity factors are obtained from:
where is the number of random variables, is the design point and is the gradient of the limit state function (in standard Gaussian space). Since is an unitary vector, ; hence, the sensitivity factor shows the relative contribution of random variable(or ) towards the failure probability, for linear or approximately linear limit state functions. Observation of these factors is relevant in interpreting the results of reliability analysis, and of calibration in particular.
4 CALIBRATION PROCEDURE
The calibration procedure is briefly presented in this section. The procedure follows the guidelines in Melchers and Beck (2018Melchers, R.E., Beck, A.T. (2018) Structural Reliability Analysis and Prediction, 3nd edition, John Wiley and Sons.). The procedure can be summarized in the following steps:
-
Define structural materials and loads to be covered in the calibration procedure. In this work, codes NBR8681, NBR8800 and NBR6168 are considered; hence, the calibration involves steel and concrete structures, as well as the load combination factors of NBR 8681.
-
Define structural configurations and load ratios to be considered in the calibration. Structural configurations are described in Appendix A, and load ratios were described in Section 3. Each structural configuration, material and load ratio corresponds to one calibration point.
-
Obtain the statistics of all random variables involved in calibration. These were presented in Section 2.
-
Define the limit state functions (Section 3).
-
Evaluate reliability indexes obtained at the calibration points, using current partial factors. This is done to check the implementation, but also to compare results with the calibration. In the past, reliability indexes using current partial factors were used to guide the choice of target reliability indexes to be used in the calibration.
-
Define the target reliability index (). In this work, is employed. This is a conservative value obtained by rounding the average reliability index obtained using current partial factors ().
-
Solve the optimization problem. This is presented in the sequence.
Each calibration point corresponds to one structural configuration, one construction material (reinforced concrete, prestressed concrete or steel, in this paper), and two load ratios. Because the partial safety factors are constant, the reliability index obtained for each calibration point is different, both before and after calibration. The calibration points represent the range of structural elements within the scope of a given code.
Calibration is the process of finding the set of partial safety factors that minimizes the variations of the reliability indexes of the different calibration points, with respect to the target reliability index (), chosen by the analyst. This is a typical Reliability-Based Design Optimization (RBDO) problem:
where is the weight of each structural configuration (given in Tables 13 and 14), is the weight of each load ratio in the combination (given in Table 15), is the reliability index, and is the critical limit state (Eq. 6). In this paper, the calibration is made independently for steel structures (NBR8800:2008) and concrete structures (NBR6118:2014). The optimal partial factors are merged later (Section 5.3), based on similarity. This is why the structural configuration weights () add up to unity, for each structural material.
The optimization problem in Eq. (10) is solved through the Particle Swarm Optimization (PSO) algorithm. This meta-heuristic algorithm is able to identify the global minimum in non-convex design spaces (Kennedy and Eberhart, 1995Kennedy, J., Eberhart, R. (1995) Particle Swarm Optimization. Proceedings of IEEE International Conference on Neural Networks. 1942-1948.). However, any other global optimization algorithm could be employed.
Finally, the entire calibration procedure is implemented and solved in the StRAnD - Structural Reliability Analysis and Design software, developed at the Department of Structural Engineering, São Carlos School of Engineering, University of São Paulo (Beck, 2007Beck, A.T. (2007) StRAnD: Manual do usuário. Escola de Engenharia de São Carlos - Universidade de São Paulo. São Carlos.; Beck, 2019).
5 RESULTS
5.1 Results for concrete structures
5.1.1 General results for concrete structures
Results obtained for concrete structures, with the calibration procedure presented herein, and using a target reliability index , are shown in Table 16, together with partial safety factors currently indicated in NBR6118:2014.
Reliability indexes for reinforced concrete beam in bending, in terms of (above) and (below).
First, it can be noticed that material factors and have not changed much, their rounded values are the same as proposed in NBR6118:2014. The largest change is observed for load factors: significant reduction in , and significant increase in and . The reduction in has already been identified and incorporated into ASCE design codes, since the work of Ellingwood et al. (1980Ellingwood, B., Galambos, T.V., MacGregor, J.G., Cornell, C.A. (1980) Development of a Probability Based Load Criterion for American National Standard A58. U.S. National Bureau of Standard Special Publication 577. Washington, DC.). It is justified by the much smaller c.o.v. for , in comparison to and (Table 10). The increase in and is accompanied by a reduction in the combination value for the secondary action, in such a way that the economic impact is virtually neutralized, as will be shown.
Figure 1 shows the reliability indexes obtained for the case of reinforced concrete beams in bending, designed with concrete of class C40, ratio between width and effective depth equal to 0.5, longitudinal reinforcement ratio of 0.5%, and equal to 0.5. The same results are plotted with regard to the variation of live load ratios () and wind load ratios (). Results before calibration are shown in blue lines, and after calibration are shown in red lines.
The first result observed in Figure 1 is the reduction in the dispersion of reliability indexes. This is the main and direct consequence of using Eq. (10) in the calibration. It is also noted that the smallest s are slightly larger for the calibrated set, in comparison to the current set. The crossing between the curves is typical of this problem, and reflects the effect of the different proportions of variable loads considered in the combination. The “kinks” observed in the curves, for small values of the load ratios, are due to Eq. (6): they occur when there is a change in the dominating limit state.
It is important to illustrate the crossing of lines in Figure 1, to stress that each point in this figure corresponds to a different structural configuration, or to a different calibration point. However, the lines become too many when all results are combined. Hence, from this point on, we only illustrate the maximum and minimum reliability indexes obtained, or the envelope of s.
Figure 2 shows the reliability index envelopes (maximum and minimum values) obtained for all concrete configurations considered herein. In this figure, it becomes more evident that the calibration procedure reduces the dispersion of s. It is also evident that average and minimum reliability indexes increase with the calibration. The average before calibration is 2.83, and with calibration it goes to 3.0.
Table 17 shows the smallest reliability indexes obtained before and after calibration, for the most usual load ratios for concrete structures: . We notice that the smallest reliability indexes obtained are quite low, and smaller than those found elsewhere (Stucchi and Santos, 2007Stucchi, F.R., Santos, S. H. C. (2007) Reliability based comparison between ACI 318-05 and NBR 6118. Revista Ibracon de Estruturas, São Paulo, V. 3, n. 2.; Santos et al., 2014; Pereira et al., 2017Pereira, M.F., Beck, A.T., El Debs, A.L.H.C. (2017) Reliability of partially encased steel-concrete composite columns under eccentric loading, IBRACON Structures and Materials Journal 10, 298-316.). This is a consequence of the larger c.o.v. considered for , in this work, and to effect of random wind loads, not considered in these references. Nevertheless, we point out that calibrated factors lead to increase in the smallest reliability indexes.
Reliability index envelope for all concrete structure configurations (βtarget = 3.0), in terms of (above) and (below).
The smallest reliability indexes before and after calibration, for the most usual load ratios for concrete structures: .
5.1.2 Reinforced concrete beams in bending
The impact of the new partial safety factors varies according to structural configuration. In this and in the following subsections, the impact and the relevance of random variables for each concrete structure configuration is discussed.
For reinforced concrete beams in bending, the calibration increased average reliability index from 2.95 to 3.23, also reducing dispersion of results (Figure 1). The smallest reliability indices observed were 1.87 before, and 2.31 after calibration. For the more usual load ratios, the smallest reliability indexes were 2.21 before and 2.62 after the calibration (Table 17).
The reliability indexes found herein for RC beams in bending are smaller than those found by Stucchi and Santos (2007Stucchi, F.R., Santos, S. H. C. (2007) Reliability based comparison between ACI 318-05 and NBR 6118. Revista Ibracon de Estruturas, São Paulo, V. 3, n. 2.): 2.8 to 4.7 and Santos et al. (2014): 2.7 to 4.3. This is due to larger c.o.v. considered for , and to the additional consideration of random wind loads.
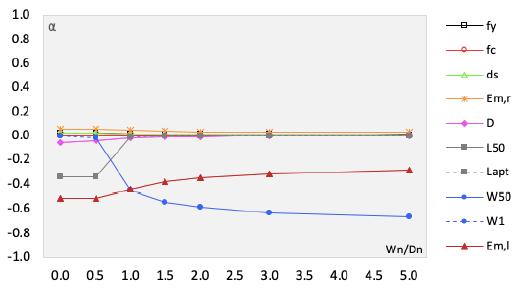
Figure 3 shows sensitivity coefficients (Eq. 9) of the random variables, for the case of bending of reinforced concrete beams, designed with concrete C40, ratio between width and effective depth of 0.5, longitudinal reinforcement ratio of 0.5%, and . Figure 3 shows that the most relevant random variables are the live load () and wind load (); this explains why calibrated partial factors changed the balance between these loads in design.
5.1.3 Reinforced concrete beams in shear
For reinforced concrete beams in shear, the calibration increased average reliability index from 2.89 to 3.09, also reducing dispersion of results. The smallest reliability indices observed were 1.85 before, and 2.16 after calibration. For the more usual load ratios, the smallest reliability indexes were 2.10 before and 2.40 after the calibration (Table 17).
The reliability indexes found herein for RC beams in shear are smaller than those found by Stucchi and Santos (2007Stucchi, F.R., Santos, S. H. C. (2007) Reliability based comparison between ACI 318-05 and NBR 6118. Revista Ibracon de Estruturas, São Paulo, V. 3, n. 2.): 2.5 to 4.4. This is due to larger c.o.v. considered for , and to the additional consideration of random wind loads.
Figure 4 shows sensitivity coefficients (Eq. 9) of the random variables, for the case of shear of reinforced concrete beams, designed with concrete C40, ratio between width and effective depth of 0.5, longitudinal reinforcement ratio of , and . Figure 4 shows that the most relevant random variables are the live load () and wind load (). The member strength and load model error variables also have some importance.
5.1.4 Reinforced concrete slabs in bending
For reinforced concrete slabs in bending, the calibration increased average reliability index from 2.62 to 2.83, also reducing dispersion of results. The smallest reliability indices observed were 1.70 before, and 2.13 after calibration. For the more usual load ratios, the smallest reliability indexes were 1.96 before and 2.30 after the calibration. The reliability indexes found herein for RC slabs in bending are similar to those found by Stucchi and Santos (2007Stucchi, F.R., Santos, S. H. C. (2007) Reliability based comparison between ACI 318-05 and NBR 6118. Revista Ibracon de Estruturas, São Paulo, V. 3, n. 2.), which varied from 2.0 to 2.3.
Figure 5 shows sensitivity coefficients (Eq. 9) of the random variables, for the case of bending of reinforced concrete slabs, designed with concrete C40, ratio between width and effective depth of 0.5, longitudinal reinforcement ratio of , and . Figure 5 shows that uncertainty in the load model is the most relevant random variable, followed closely by live load () and wind load ().
5.1.5 Reinforced concrete beam-columns under compression and bending
For reinforced concrete beam-columns under compression and bending, the calibration increased average reliability index from 3.21 to 3.38, also reducing dispersion of results. The smallest reliability indices observed were 2.22 before, and 2.63 after calibration. For the more usual load ratios, the smallest reliability indexes were 2.57 before and 2.90 after the calibration (Table 17).
The reliability indexes found herein for RC columns under eccentric loading are similar to those found by Oliveira et al. (2008Oliveira, W.L.A., Beck, A.T., El Debs, A.L.H.C. (2008) Safety evaluation of circular concrete-filled steel columns designed according to Brazilian building code NBR 8800:2008. IBRACON Structures and Materials Journal 1, 212-236.) and Beck et al. (2009Beck, A.T., Oliveira, W.L.A., DeNardim, S., ElDebs, A.L.H.C. (2009) Reliability-based evaluation of design code provisions for circular concrete-filled steel columns. Engineering Structures 31, 2299-2308.) for composite columns under compressive loading: 2.4 to 4,6; and smaller than those found by Pereira et al. (2017Pereira, M.F., Beck, A.T., El Debs, A.L.H.C. (2017) Reliability of partially encased steel-concrete composite columns under eccentric loading, IBRACON Structures and Materials Journal 10, 298-316.) for composite columns under eccentric loading: 4.5 to 5.0. These authors considered significantly smaller c.o.v. for , and did not consider wind loads.
Figure 6 shows sensitivity coefficients (Eq. 9) of the random variables, for the case of concrete beam-columns under compression and bending, designed with concrete C40, ratio between width and effective depth of 0.6, longitudinal reinforcement ratio of 2.0%, and . Figure 6 shows that uncertainty in the column strength model is the most relevant random variable, followed closely by wind load ().
Sensitivity coefficients for reinforced concrete beam-columns under compression and bending.
5.1.6 Prestressed concrete beams in bending
For prestressed concrete beams in bending, the calibration increased average reliability index from 2.64 to 2.87, also reducing dispersion of results. The smallest reliability indices observed were 1.52 before, and 1.97 after calibration. For the more usual load ratios, the smallest reliability indexes were 1.79 before and 2.17 after calibration (Table 17).
Figure 7 shows sensitivity coefficients (Eq. 9) of the random variables, for the case of prestressed concrete beams in bending, designed with concrete C40, ratio between width and effective depth of 0.5, longitudinal reinforcement ratio of 0.35%, prestressing ratio of 0.30%, and . Figure 7 shows that the most relevant random variables are the live load () and wind load (). The model uncertainties for member strength and loading are not negligible.
5.2 Results for steel structures
5.2.1 General results for steel structures
Results obtained for steel structures, with the calibration procedure presented herein, and using a target reliability index , are shown in Table 18, together with partial safety factors currently indicated in NBR8800:2008.
Initially, we notice that material factors and have not changed much, their rounded values are similar to proposed in NBR8800:2008. The largest change is observed for load factors: significant reduction in , and significant increase in and . The reduction in has already been identified and incorporated into ASCE design codes, since the work of Ellingwood et al. (1980Ellingwood, B., Galambos, T.V., MacGregor, J.G., Cornell, C.A. (1980) Development of a Probability Based Load Criterion for American National Standard A58. U.S. National Bureau of Standard Special Publication 577. Washington, DC.). It is justified by the much smaller c.o.v. for , in comparison to and (Table 10). The increase in and is accompanied by a reduction in the combination value for the secondary action, in such a way that the economical impact is minimized, as will be shown.
Figure 8 shows the reliability index envelopes (maximum and minimum values) obtained for all concrete configurations considered herein. In this figure, it becomes more perceptible that the calibration procedure reduces the dispersion of s. It is also evident that average and minimum reliability indexes increase with the calibration. The average before calibration is 2.93, and with calibration it goes to 3.0.
Table 19 shows the smallest reliability indexes obtained before and after calibration, for the most usual load ratios for steel structures: .
Reliability index envelope for all steel structure configurations (βtarget = 3.0), in terms of (above) and (below).
The smallest reliability indexes before and after calibration, for the most usual load ratios for steel structures: .
5.2.2 Steel beams in bending
The impact of the new partial safety factors varies according to structural configuration. In this and in the following subsections, we discuss the impact and the relevance of random variables for each steel structure configuration.
For steel beams in bending, the calibration increased average reliability index from 2.72 to 2.86, also reducing dispersion of results. The smallest reliability indices observed were 1.69 before, and 2.09 after calibration. For the more usual load ratios, the smallest reliability indexes were 2.26 before and 2.49 after the calibration (Table 19).
The reliability indexes found herein for steel beams in bending are greater than those found by Freitas et al. (2007Freitas, M.S.R., Castanheiras, A.M., Freitas, A.M.S. (2007) Confiabilidade de vigas metálicas dimensionadas pela norma brasileira NBR 8800. Revista Escola de Minas, V. 60, n. 2, 261-269.): 1.2 to 1.9. It is important to mention, however, that these authors considered deterministic loads.
Figure 9 shows sensitivity coefficients (Eq. 9) of the random variables, for the case of bending of steel beams, designed with ASTM A36 Steel, section W 610 x 174, and . Figure 9 shows that the most relevant random variables are the live load () and wind load (); although the model error and yield strength variables also impact the results.
5.2.3 Steel beams in shear
For steel beams in shear, the calibration increased average reliability index from 2.68 to 2.80, also reducing dispersion of results. The smallest reliability indices observed were 1.64 before, and 2.01 after calibration. For the more usual load ratios, the smallest reliability indexes were 2.16 before and 2.36 after the calibration (Table 19).
Figure 10 shows sensitivity coefficients (Eq. 9) of the random variables, for the case of shear of steel beams, designed with ASTM A36 Steel, section W 610 x 174, and . Figure 10 shows that the most relevant random variables are the live load () and wind load (). The model error variables also have importance.
5.2.4 Steel members under compression
For steel members under compression, the calibration increased average reliability index from 2.87 to 3.03, also reducing dispersion of results. The smallest reliability indices observed were 1.77 before, and 2.18 after calibration. For the more usual load ratios, the smallest reliability indexes were 2.38 before and 2.66 after the calibration (Table 19).
The reliability indexes found herein for steel member under compressive loading are similar to those found by Beck and Dória (2008Beck, A.T., Dória, A.S. (2008) Reliability analysis of I-section steel columns designed according to new Brazilian building codes. Journal of the Brazilian Society of Mechanical Sciences and Engineering 30, 152 - 159.) for I-section steel columns under compression: 2.4 to 3.4. These authors did not consider wind loads.
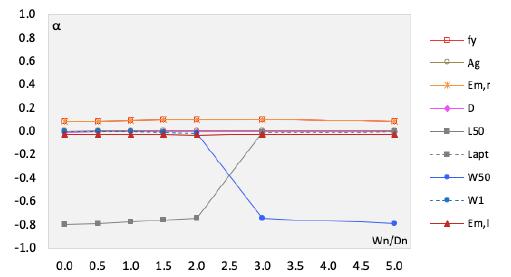
Figure 11 shows sensitivity coefficients (Eq. 9) of the random variables, for the case of steel members under compression, designed with ASTM A36 Steel, section CS 250 x 66, and . Figure 11 shows that live load () and wind load () are most relevant random variables, followed distantly by the model uncertainties for member strength.
5.2.5 Steel members under tension
For steel members under tension, the calibration increased average reliability index from 3.32 to 3.40, also reducing dispersion of results. The smallest reliability indices observed were 1.74 before, and 2.17 after calibration. For the more usual load ratios, the smallest reliability indexes were 2.37 before and 2.64 after the calibration (Table 19).
Figure 12 shows sensitivity coefficients (Eq. 9) of the random variables, for the case of steel members under tension, designed with ASTM A36 Steel, flat bar 152 x 6.35, five bolts 16 mm, and . Figure 12 shows that the most relevant random variables are the live load () and wind load (). The ultimate strength of steel members also have some importance.
5.2.6 Steel bolted connections
For steel bolted connection, the calibration maintained average reliability index 3.07, but reducing dispersion of results. The smallest reliability indices observed were 1.94 before, and 2.23 after calibration. For the more usual load ratios, the smallest reliability indexes were 2.56 before and 2.67 after calibration (Table 19).
The reliability indexes found herein for bolted connections are similar to those found by Freitas et al. (2007Freitas, M.S.R., Castanheiras, A.M., Freitas, A.M.S. (2007) Confiabilidade de vigas metálicas dimensionadas pela norma brasileira NBR 8800. Revista Escola de Minas, V. 60, n. 2, 261-269.) for bolted connections in cold-formed steels section: 1.93 to 3.01. It is important to note, however, that these authors did not consider wind loads.
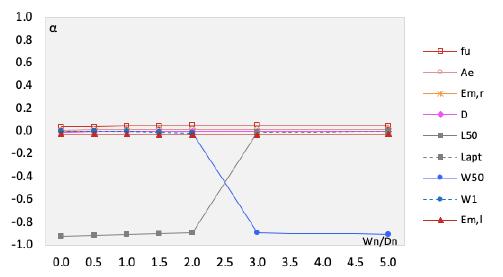
Figure 13 shows sensitivity coefficients (Eq. 9) of the random variables, for the case of steel bolted connections, designed with ASTM A325 bolts, 20 mm diameter, and . Figure 13 shows that the most relevant random variables are live load () and wind load (). The bolts diameter is not a negligible variable.
5.3 Combined results for concrete and steel structures
The analysis of partial safety factors should not be limited to technical aspects. It is important to also appreciate the economical impact of suggested changes (Beck and Souza Jr., 2010Beck, A.T., Souza Jr, A.C. (2010) A first attempt towards reliability-based calibration of Brazilian structural design codes. J, of the Braz. Soc of Mech. Sci & Eng. V.32, 119-127.). Using the same weights indicated in Tables (13) to (15), and the partial factors listed in Tables 16 and 18, we evaluated the weighted (or averaged) design loads. For concrete structures and = {0.5, 0.7, 0.8}, the calibrated factors increase the average load by 2.5%, 1.0%, and 0%, respectively. For steel structures, the calibrated factors increase the average load by 1.5% for = {0.5}, and decrease the average load by 1.0% and 3.0% for = {0.7, 0.8}, respectively. Of course, this is a trade-off for larger reliability indexes and smaller dispersion of s.
As a matter of completeness, the calibration process was repeated using a target reliability equal to the average reliability before calibration (), and for the Eurocode recommended value of , for the whole set of concrete and steel configurations considered herein. The resulting partial safety factors are compared in Tables 20 and 21.
Partial safety factors obtained in calibration for concrete structures and different βtarget values.
Partial safety factors obtained in calibration for steel structures and different βtarget values.
First, it is observed that, also for these different values of , the main load is increased, and the combination value of the secondary load is decreased. This is a consequence of the load combination rule in Eq. (1).
In terms of concrete structures, it was observed that for , the calibrated factors increase the average design load by 2.0% and 0.5% for = {0.5, 0.6}, and decrease the average load by 0.5% for = {0.8}. For and = {0.5, 0.7, 0.8}, the calibrated factors increase the average load by 20%, 18.5%, and 17.5%, respectively.
Concerning steel structures, it was observed that for , the calibrated factors reduce the average load by 0.0%, 2.5% and 4.5% for = {0.5, 0.7, 0.8}, respectively. In the other hand, for and = {0.5, 0.7, 0.8}, the calibrated factors increase the average load by 9.5%, 12%, and 14%, respectively.
6 CONCLUDING REMARKS
This paper addressed the reliability-based calibration of partial safety factors of Brazilian design codes for steel (NBR8800:2008) and concrete (NBR6118:2014) structures, as well as the design code for loading in structures (NBR8681:2003). The study included a compilation of statistics on strength of materials, loading and modelling uncertainties either derived for or adjusted to reflect the Brazilian reality. The study included several structural configurations: steel beams in bending and shear, linear steel elements under tensile and compressive loads, and bolted connections; also reinforced concrete beams in bending and shear, RC beam-columns subject to compressive bending, RC slabs subject to bending, and prestressed beams under bending. The study considered seven ratios between live and dead loads and seven ratios between wind and dead loads. In total, 13867 configurations, or calibration points, where considered for concrete (283 elements times 49 load ratios), and 17640 configurations (360 elements times 49 load ratios) were considered for steel.
The calibration was formulated as a Reliability-Based Design Optimization (RBDO) problem, which was solved using a Particle Swarm Optimization (PSO) algorithm. With 60 particles and around 6 iterations, multiplied by the (31507) calibration points, this means that over 11 million reliability analyses were done to arrive at the calibrated sets of partial safety factors. Reliability analysis was done using the First Order Reliability Method (FORM), which allowed us to deal efficiently with the batch reliability analyses involved. The target reliability index used in the calibration was .
The calibration process has shown that more uniform reliability indexes can be obtained by increasing the main variable load and reducing the secondary load in the combinations. This was considered as a direct result of using Turkstra´s load combination rule in design and in the reliability analysis. The calibration for resulted in a small increase in minimum and average reliability indexes, and in a small (0 to 2%) increase in average design loads.
Although this work is a clear contribution towards progress of Brazilian design codes, the calibrated partial factors found herein are not (yet) recommended for incorporation in NBR8800:2008, NBR6118:2014 and NBR8681:2003, for the following reasons:
-
The design code for wind loads in structures (NBR6123: 1988) is outdated, but is currently being reviewed. As we have shown herein, extreme wind loads have a very large contribution to failure probabilities. As NBR6123: 1988 is updated, we expect the extreme wind statistics in Table 10 to change significantly, and this could have a significant impact on optimal partial safety factors.
-
In performing this ample study, covering a variety of steel and concrete elements, it became evident to us that the main result (the increase in main loads and reduction in secondary loads) is a direct consequence of using Turkstra´s load combination rule in reliability analysis. This is known to be an unconservative approximation, which has been used in the calibration of north-American and European design codes. Yet, we believe it is avoidable, and we should avoid using it in future calibration studies.
-
There are still controversies about some of the statistics used in the modelling, in particular model errors for RC beams in shear, model errors for RC columns under eccentric loading, and the statistics of the fifty-year extreme live load (). The life load statistics employed herein correspond to a nominal load with exceedance probability of 43%, larger than the 25 to 35% required in NBR6120:2019 and NBR8681:2003. As a consequence, our analysis produced smaller reliability indexes for many of the structural configurations tested, in comparison to previous studies addressing Brazilian design codes. Three proposals were presented for making the live load model compatible with NBR 6120:2019 and NBR8681:2003; these models should be discussed with the community, with the objective or reaching a minimal consensus.
-
In future work, we should look at incorporating responsibility partial factors, in order to differentiate the reliability of structural elements with different failure consequences, such as beams and columns.
In spite of the above points, since the same models and statistics were used to evaluate reliability before and after the calibration, we believe the general trends observed herein are valid, and indicate the way to go in terms of achieving more uniform reliability in structural design in Brazil.
ACKNOWLEDGMENTS
The authors are grateful to CNPq and CAPES for funding this research. The authors are grateful to the companies and professionals who provided data used to characterize statistics associated to steel and concrete structures built in Brazil.
REFERENCES
- ABNT NBR 8681 (2003) Actions and safety of structures - procedure, Associação Brasileira de Normas Técnicas, Rio de Janeiro, RJ.
- ABNT NBR8800 (2008) Design of Steel and Steel-Concrete Composite Structures: Procedures, Associação Brasileira de Normas Técnicas, Rio de Janeiro, RJ.
- ABNT NBR6118 (2014) Design of concrete structures - procedure. Associação Brasileira de Normas Técnicas, Rio de Janeiro, RJ.
- ABNT NBR 14931 (2004) Execution of concrete structures - procedure. Associação Brasileira de Normas Técnicas, Rio de Janeiro, RJ.
- ABNT NBR 15980 (2011) Rolled steel shapes for structural use - dimensions and tolerances. Associação Brasileira de Normas Técnicas, Rio de Janeiro, RJ.
- ABNT NBR 5884 (2013) Structural profile type I welded steel joint by electric arc - requirements. Associação Brasileira de Normas Técnicas, Rio de Janeiro, RJ.
- ABNT NBR 11888 (2015) Sheet and coils of carbon and high strength alloy steel - general requirements. Associação Brasileira de Normas Técnicas, Rio de Janeiro, RJ.
- ABNT NBR 6120 (1980) Cargas para o cálculo de estruturas de edificações. Associação Brasileira de Normas Técnicas, Rio de Janeiro, RJ.
- ABNT NBR 6120 (2019) Cargas para o cálculo de estruturas de edificações. Associação Brasileira de Normas Técnicas, Rio de Janeiro, RJ.
- ABNT NBR 6123 (1988) Wind Loads in Buildings, Associação Brasileira de Normas Técnicas, Rio de Janeiro, RJ.
- ASCE/SEI 7 (2016) Minimum Design Loads for Buildings and other Structures. American Society of Civil Engineering. Washington, DC.
- Beck, A.T. (2007) StRAnD: Manual do usuário. Escola de Engenharia de São Carlos - Universidade de São Paulo. São Carlos.
- Beck, A.T., Dória, A.S. (2008) Reliability analysis of I-section steel columns designed according to new Brazilian building codes. Journal of the Brazilian Society of Mechanical Sciences and Engineering 30, 152 - 159.
- Beck, A.T. (2019) Confiabilidade e Segurança das Estruturas, Elsevier, 448 páginas. ISBN: 978-85-352-8688-5
- Beck, A.T., Souza Jr, A.C. (2010) A first attempt towards reliability-based calibration of Brazilian structural design codes. J, of the Braz. Soc of Mech. Sci & Eng. V.32, 119-127.
- Beck, A.T., Correa, M.R.S. (2013) New Design Chart for Basic Wind Speeds in Brazil. Latin American Journal of Solids and Structures 10, 707-723.
- Beck, A.T., Oliveira, W.L.A., DeNardim, S., ElDebs, A.L.H.C. (2009) Reliability-based evaluation of design code provisions for circular concrete-filled steel columns. Engineering Structures 31, 2299-2308.
- Carvalho, M.L., Silva, C.R., Stucchi, F.R. (2017) Study on reliability of punching shear of flat slabs without shear reinforcement according to NBR6118, IBRACON Structures and Materials Journal 10, 276-297.
- Corelhano, G., Correa, M.R.S., Beck, A.T. (2012) Confiabilidade de edifícios no estado limite de serviço para deslocamentos horizontais máximos, IBRACON Structures and Materials Journal 5, 84-103.
- Silva, G.R., Campos Filho, A., Real, M.V. (2018) Reliability of internal column-slab connection under punching according to NBR 6118:2014, IBRACON Structures and Materials Journal 11, 931-948.
- Ellingwood, B., Galambos, T.V. (1982) Probability-based criteria for structural design, Structural Safety 1, 15-26.
- Ellingwood, B., Galambos, T.V., MacGregor, J.G., Cornell, C.A. (1980) Development of a Probability Based Load Criterion for American National Standard A58. U.S. National Bureau of Standard Special Publication 577. Washington, DC.
- EN 1990 (2002) Basis of structural design, European Committee for Standardization, Eurocode, Brussels.
- Freitas, M.S.R., Castanheiras, A.M., Freitas, A.M.S. (2007) Confiabilidade de vigas metálicas dimensionadas pela norma brasileira NBR 8800. Revista Escola de Minas, V. 60, n. 2, 261-269.
- Gayton, N., Mohamed, A., Sorensen, J.D., Pendola, M., Lemaire, M. (2004) Calibration methods for reliability-based design codes, Structural Safety 26, 91-121.
- Gulvanessian, H., Holicky, M. (2005) Eurocodes: using reliability analysis to combine action effects, Proceedings of the Institution of Civil Engineers, Structures and Buildings, Thomas Telford.
- Holicky, M. (2008) Reliability-based analysis of codified design allowing for production quality, Proceedings of 4th International ASRANet Colloquium, Athens.
- Holicky, M, Sykora, M. (2011) Conventional probabilistic models for calibration of codes. Applications of Statistics and Probability in Civil Engineering (ICASP11), London.
- JCSS (2001) Probabilistic Model Code, Joint Committee on Structural Safety, disponível em http://www.jcss.byg.dtu.dk/Publications/Probabilistic_ Model_Code.aspx, acessado em 16/06/2018.
» http://www.jcss.byg.dtu.dk/Publications/Probabilistic_ Model_Code.aspx - Kennedy, J., Eberhart, R. (1995) Particle Swarm Optimization. Proceedings of IEEE International Conference on Neural Networks. 1942-1948.
- Melchers, R.E., Beck, A.T. (2018) Structural Reliability Analysis and Prediction, 3nd edition, John Wiley and Sons.
- Nova, S.J.S., Silva, M.C.A.T. (2017) Cálculo dos Coeficientes Parciais de Segurança para Pontes de Concreto Protendido sob Solicitações Normais com Base na Teoria de Confiabilidade Estrutural, 59º Congresso Brasileiro do Concreto. Bento Gonçalves, IBRACON.
- Nowak, A.S., Szerszen, M.M. (2003) Calibration of design codes for buildings (ACI 318): Part 1 - Statistical model for resistance. ACI Structural Journal, V. 100, n. 3, 77-382. New York.
- Nowak, A.S., Rakoczy, A.M., Szeliga, E. (2011) Revised Statistical Resistance Models for R/C Structural Components, ACI SP honoring Andy Scanlon.
- Nowak, A.S., Collins, K.R. (2012) Reliability of Structures, McGraw-Hill International Editions, Civil Engineering Series, 2nd Edition.
- Oliveira, W.L.A., Beck, A.T., El Debs, A.L.H.C. (2008) Safety evaluation of circular concrete-filled steel columns designed according to Brazilian building code NBR 8800:2008. IBRACON Structures and Materials Journal 1, 212-236.
- Pereira, M.F., Beck, A.T., El Debs, A.L.H.C. (2017) Reliability of partially encased steel-concrete composite columns under eccentric loading, IBRACON Structures and Materials Journal 10, 298-316.
- Riera J.D., Rocha M.M. (1998). Load definition for wind design and reliability assessments: extreme wind climate. Capítulo em Rieira e Davenport (eds.), Wind effects on Buildings and Structures, Balkema, Rotterdam.
- San Martins, D.A. (2014) Confiabilidade de vigas pré-tracionadas de concreto protendido, dissertação de mestrado, Engenharia Civil, Universidade Federal do Rio Grande do Sul.
- Santos, E.S. (2012) Avaliação estatística do erro de modelos de resistência para elementos lineares de concreto armado da ABNT NBR 6118:2007, dissertação de mestrado, Engenharia de Estruturas, Escola de Engenharia de São Carlos, Universidade de São Paulo.
- Santiago, W.C. (2019) Reliability-Based Calibration of Partial Safety Factors from Main Brazilian Codes. Thesis (D.Sc.), São Carlos School of Engineering, University of São Paulo.
- Santiago, W.C., Beck, A.T. (2017a) A new study of Brazilian concrete strength conformance. Revista IBRACON de Estruturas e Materiais, V. 10, n. 4, 906-923.
- Santiago, W.C., Beck, A.T. (2017b) Um estudo da conformidade da resistência do concreto convencional produzido no Brasil, 59º Congresso Brasileiro do Concreto. Bento Gonçalves, IBRACON.
- Santiago, W.C., Beck, A.T. (2018) Um estudo da conformidade do concreto de resistência moderada produzido no Brasil, 60º Congresso Brasileiro do Concreto. Foz do Iguaçu, IBRACON.
- Santos, D.M., Stucchi, F.R., Beck, A.T. (2014) Confiabilidade de vigas projetadas de acordo com as normas brasileiras. Revista IBRACON de Estruturas e Materiais 7, 723-746.
- Santos, D.M., Stucchi, F.R., Beck, A.T. (2015) Discussion of: Concrete structures. Contribution to the safety assessment of existing structures. Revista IBRACON de Estruturas e Materiais 8, 744 - 748.
- Stucchi, F.R., Santos, S. H. C. (2007) Reliability based comparison between ACI 318-05 and NBR 6118. Revista Ibracon de Estruturas, São Paulo, V. 3, n. 2.
- Szerszen, M.M., Nowak, A.S., (2003) Calibration of design codes for buildings (ACI 318): Part 2 - Reliability analysis and resistance factors. ACI Structural Journal, V. 100, n. 3, 383-391. New York.
- Vrouwenvelder, T. (1997) Joint Committee on Structural Safety. Elsevier Science: Structural Safety, V. 19, n. 3, 245-251.
-
1
An updated version was published late 2019 (NBR6120:2019), after results herein had been processed.
APPENDIX A: STRUCTURAL CONFIGURATIONS FOR CONCRETE
This appendix describes the resistance or strength functions, for the different concrete elements considered in the calibration process. The strength equations are presented as employed in the reliability analysis, i.e., involving random variables and without partial factors. The same equations are used in design; in this case, random variables are replaced by characteristic values, and partial factors and have to be considered. As shown in the sequence, 283 concrete configurations are studied herein.
A.1 Reinforced concrete beams in bendingThis paper considers beams in bending, with concrete of five classes (C20, C30, C40, C50 and C60), three longitudinal reinforcement ratios (ρmin, 0.5% and ρmax) and three ratios between width and effective depth (0.25, 0.50 and 0.75). The bending resistance (strength) is given by:
where is the cross-section area of reinforcing bars, determined from the longitudinal reinforcement ratio, is the factor related to the Rüsch effect, and is the ratio between depth of the rectangular and the parabolic-rectangular concrete stress blocks. Random variables (, , , ) are described in Tables 1 to 3. A subtotal of 45 configurations are analyzed.
A.2 Reinforced concrete beams in shearThis paper considers beams in shear, with concrete of five classes (C20, C30, C40, C50 and C60), three transverse reinforcement ratios (, and ) and three ratios between width and effective depth (0.25, 0.50 and 0.75). The shear resistance (strength) is given by:
It is important to mention that the classical Ritter-Morsch truss with 45 degrees angle is considered. Therefore, resistance is given by the sum of shear force absorbed by the stirrups and shear force absorbed by the complementary mechanisms. A subtotal of 45 configurations are analyzed.
A.3 Reinforced concrete slabs in bendingThis paper considers slabs in bending, with concrete of four classes (C20, C30, C40 and C50), three longitudinal reinforcement ratios (, and ), and four effective depths (7.5, 12.5, 17.5 and 22.5 cm). The resistance (strength) function is given by:
The width adopted was equal to 100 cm. The entire evaluation was made for metric bands of reinforced concrete slabs. A subtotal of 48 configurations are analyzed.
A.4 Reinforced concrete beam-columns under compression and bendingThis paper considers beam-columns with concrete of three classes (C20, C40 and C60), three longitudinal reinforcement ratios (ρmin, 2.0 and 4.0%), three ratios between width and height (0.2, 0.6 and 1.0) and three ratios between effective depth from the bottom of the section to the centroid of reinforcing bars and height (e1,min/h, 0.2 and 0.4). The resistance (strength) function is:
where , and are coefficients that define approximated lines from the non-dimensional bending moment-axial load interaction diagrams. A subtotal of 81 configurations are analyzed.
A.5 Prestressed concrete beams in bendingThis paper considers bonded prestressed beams with concrete of four classes (C30, C40, C50 and C60), two longitudinal reinforcement ratios (0.35 and 0.70%), two prestressing ratios (0.30 and 0.60%), two ratios between width and effective depth (0.25 and 0.50) and two prestressing steel eccentricities (0.20.h and 0.40.h). The resistance function is:
where is the coefficient that relates the tension level in the prestressing steel with the neutral axis depth previously found by the bisection method. A subtotal of 64 configurations are analyzed.
APPENDIX B: STRUCTURAL CONFIGURATIONS FOR STEEL
This appendix describes the resistance or strength functions, for the different steel elements considered in the calibration process. The strength equations are presented as employed in the reliability analysis, i.e., involving random variables and without partial factors. The same equations are used in design; in this case, random variables are replaced by characteristic values, and partial factors and have to be considered. As shown in the sequence, 360 steel configurations are studied herein.
B.1 Steel beams in bendingThis paper considers beams in bending, with two structural steel (ASTM A36 and ASTM A572 GR50), eighteen rolled steel sections (W 150 x 13, W 150 x 29,8, W 200 x 15, W 200 x 46,1, W 250 x 17,9, W 250 x 73, W 310 x 21, W 310 x 70, W 360 x 32,9, W 360 x 91, W 410 x 38,8, W 410 x 75, W 460 x 52, W 460 x 89, W 530 x 66, W 530x 92, W 610 x 101 and W 610 x 174), eighteen welded steel sections (VS 400 x 68, VS 450 x 71, VS 500 X 86, VS 550 x 88, VS 600 x 125, VS 650 x 128, VS 700 x137, VS 750 x140, VS 800 x 143, VS 850 x 155, VS 900 x 159, VS 950 x 162, VS 1000 x 180, VS 1100 x 199, VS 1200 x 244, VS 1300 x 281, VS 1400 x 309, VS 1500 x 319) and two limit states (FLB - Flange Local Buckling and WLB - Web Local Buckling). The bending resistance (strength) is given by:
where is the lateral-torsional buckling modification factor, is the elastic moment, is the elastic lateral-torsional moment, is the slenderness for flange or web, is the limiting slenderness for compact flange or web, and is the limiting slenderness for noncompact flange or web. Random variables ( and ) are described in Tables 5 to 7. A subtotal of 72 configurations are analyzed.
B.2 Steel beams in shearThis paper considers beams in shear, with two structural steel (ASTM A36 and ASTM A572 GR50), eighteen rolled steel sections (W 150 x 13, W 150 x 29,8, W 200 x 15, W 200 x 46,1, W 250 x 17,9, W 250 x 73, W 310 x 21, W 310 x 70, W 360 x 32,9, W 360 x 91, W 410 x 38,8, W 410 x 75, W 460 x 52, W 460 x 89, W 530 x 66, W 530x 92, W 610 x 101 and W 610 x 174) and eighteen welded steel sections (VS 400 x 68, VS 450 x 71, VS 500 X 86, VS 550 x 88, VS 600 x 125, VS 650 x 128, VS 700 x137, VS 750 x140, VS 800 x 143, VS 850 x 155, VS 900 x 159, VS 950 x 162, VS 1000 x 180, VS 1100 x 199, VS 1200 x 244, VS 1300 x 281, VS 1400 x 309, VS 1500 x 319). The shear resistance (strength) is given by:
where is the slenderness for flange, is the limiting slenderness for compact flange, and is the limiting slenderness for noncompact flange. Random variables (, and ) are described in Tables 5 to 7. It is important to mention that web without transverse stiffeners is considered. A subtotal of 72 configurations are analyzed.
B.3 Steel members under compressionThis paper considers members under compression, with two structural steel (ASTM A36 and ASTM A572 GR50), six steel sections (W 250 x 73, W360 x 101, HP 250 x 85, CS 250 x 66, CVS 350 x 118 and L 203 x 19), two lengths (295 and 590 cm) and three effective length factors (0.65, 1.0 and 2.1). The resistance (strength) is given by:
where is the global buckling factor, determined according to the Euler formula, and is the local buckling factor, which is related to the element slenderness. Random variables ( and ) are described in Tables 5 to 7. A subtotal of 72 configurations are analyzed.
B.4 Steel members under tensionThis paper considers members under tension, with two structural steel (ASTM A36 and ASTM A572 GR50), two steel flat bars (152 x 6.35 and 152 x 12.7), four steel sections (L 102 x 76 x 9.5, L 102 x 102 x 9.5, C 152 x 15.6 and W 150 x 18), three connections whit bolts of nominal diameter 16 mm (4, 5 and 6 bolts), and two connections whit longitudinal fillet welds ( and 2.0.d), except to W 150 x 18 that are considers three connections whit transverse fillet welds (, and ). The resistance (strength) is given by:
where is the shear lag factor, depending on the type of structural connection. Random variables (, , and ) are described in Tables 5 to 7. A subtotal of 72 configurations are analyzed.
B.5 Steel bolted connectionsThis paper considers bolted connections, with one structural steel (ASTM A325), six nominal diameters (16, 20, 22, 24, 30 and 36 mm) and six numbers of holes (2, 4, 6, 8, 10 and 12). Eq. (B5) gives the tension resistance (strength) of bolts, while Eq. (B6) gives the shear resistance (strength) of bolts.
where is the shear plane factor, it varies when threads are or are not excluded from the shear plane. Random variables ( and ) are described in Table 7. A subtotal of 72 configurations are analyzed.
Edited by
Editor:
Publication Dates
-
Publication in this collection
21 Feb 2020 -
Date of issue
2020
History
-
Received
05 Aug 2019 -
Reviewed
06 Dec 2019 -
Accepted
06 Dec 2019 -
Published
12 Dec 2019