
Abstract
The rupture in metals can occur by cleavage, where all process is controlled by stresses, or by ductile fracture, which takes into account the damage caused by nucleation and growth of voids.The process is then dependent on stresses and strains. The Linear Elastic Fracture Mechanics, widely used in engineering practice, is based on the assumption that the first process prevails, which occurs only under certain conditions. Consideration of the second fracture process is not so well disseminated. In this work, two methodologies are considered to take into account the cleavage-ductile transition. One is based on the Tvergaard-Hutchinson's cohesive model and the other is based on the Gurson- Tvergaard-Needleman's ductile damage model. The two methodologies are considerably different and, in this work, initially the relationships between the two models are established. Then, the conditions for a transition from cleavage to ductile fracture are determined and discussed. Most of the results are presented based on crack growth resistence curves obtained for different material parameters. A strip in mode I rupture is considered firstly. It is shown that, depending on the yield stress and other factors, the two fracture modes can coexist. Also, even when only cleavage is occurring, it is affected by interactions with voids. Lastly, the present simulations are compared withCompact Tension experimental results.Results considering the coupling between the two fracture models presented a better fitting with experiments than other simulations where the coupling is not considered.
Keywords:
Ductile fracture; Cohesive Model; Cleavage-ductile transition; Crack propagation

1 INTRODUCTION
Cohesive zone models (CZMs) are extensively explored in the study of cleavage fracture. The concept of this model is based on the principles developed by Dugdale [1[1] Dugdale, D. S. Yielding of steel sheets containing slits.Journal of the Mechanics and Physics of Solids, v. 8, n. 2, p. 100-104, 1960.] and Barenblatt [2[2] Barenblatt, G. I. The mathematical theory of equilibrium cracks in brittle fracture. In: Advances in applied mechanics. Elsevier, p. 55-129, 1962.]. They considered tractions with opposite modules regarding applied stresses at the crack tip front, known as cohesive zone. The fracture process in the CZM takes place at the crack line, relating tractions to displacements at the coesive zone. Among the existing CZMs, some models developed over the years stand out, such as the constitutive laws formulated by Xu and Needleman [3[3] Xu, X.-P.; Needleman, A. Numerical simulations of fast crack growth in brittle solids. Journal of the Mechanics and Physics of Solids, v. 42, n. 9, p. 1397-1434, 1994.], Tvergaard and Hutchinson [4[4] Tvergaard, V.; Hutchinson, J. W. The relation between crack growth resistance and fracture process parameters in elastic-plastic solids. Journal of the Mechanics and Physics of Solids, v. 40, n. 6, p. 1377-1397, 1992.], Zhang and Paulino [5[5] Zhang, Z. J.; Paulino, G. H. Cohesive zone modeling of dynamic failure in homogeneous and functionally graded materials. International journal of plasticity, v. 21, n. 6, p. 1195-1254, 2005.], Roth [6[6] Roth, S.; Hütter, G.; Kuna, M. Simulation of fatigue crack growth with a cyclic cohesive zone model. International Journal of Fracture, v. 188, n. 1, p. 23-45, 2014.], among others. The Tvergaard-Hutchinson [4[4] Tvergaard, V.; Hutchinson, J. W. The relation between crack growth resistance and fracture process parameters in elastic-plastic solids. Journal of the Mechanics and Physics of Solids, v. 40, n. 6, p. 1377-1397, 1992.] trapezoid model will be the basis for this work regarding this matter. In the model, the forces applied on the body cause the opening of the cohesive zone.Tractions increase until reaching a maximum value that will remain constant for a certain opening, and then they will finally decrease when the opening further increases. When tractions approach zero at the final stage, all of the material toughness is then consumed, completing the rupture process.
Ductile failure in continuum damage mechanics is established by softening through degradation of mechanical properties of the material [7[7] Cunda, L. A. B. Gurson Model for Ductile Damage: Computational Approach and Applications (in Portuguese), Ph.D. Thesis, Universidade Federal do Rio Grande do Sul, Brazil, 2006.]. Unlike cleavage rupture, the ductile fracture considers plastic strains and not only stresses generated in the process as governing variables of the process. Among the various formulations explored for material damage, this work focuses on the formulation developed by Gurson [8[8] Gurson, A. L. Continuum theory of ductile rupture by void nucleation and growth: parti-yield criteria and flow rules for porus ductile media. ASME Journal of Engineering Materials and Technology, v. 99, p.2-15, 1977.], which takes into account voids as a degradation variable. Voids nucleate by debonding or fracture of second phase particles, which would grow until later agglomeration, triggering the phenomenon of coalescence. Most of the voids are nucleated in the loading process, even though an initial fraction of porosity may be considered. Tvergaard [9[9] Tvergaard, V. Influence of void nucleation on ductile shear fracture at a free surface. Journal of the Mechanics and Physics of Solids, v. 30, n. 6, p. 399-425, 1982.] states that the most significant part of the voids are formed in the early stages of deformation.
Over the years, many modifications have been made to Gurson initial model. Tvergaard & Needleman [9[9] Tvergaard, V. Influence of void nucleation on ductile shear fracture at a free surface. Journal of the Mechanics and Physics of Solids, v. 30, n. 6, p. 399-425, 1982.,10[10] Tvergaard, V. Influence of voids on shear band instabilities under plane strain conditions. International Journal of Fracture, v.17, p.389-407, 1981.] proposed the insertion of new parameters to modify the effect of hydrostatic pressure at all stages of deformations, modeling problems that comprise shear bands in a more precise way. This new formulation became known as the Gurson-Tvergaard-Needleman (GTN) law of continuous damage, and it is the model used in the present work. Other modifications such as the ones made by Zhang & Niemi [11[11] Zhang, Z. L.; Niemi, E. A new failure criterion for the Gurson-Tvergaard dilational constitutive model. International Journal of Fracture, v. 70, n. 4, p. 321-334, 1994.] and Nahshon & Hutchinson [12[12] Nahshon, K.; Hutchinson, J. W. Modification of the Gurson model for shear failure. European Journal of Mechanics-A/Solids, v. 27, n. 1, p. 1-17, 2008.], were not taken into account in this work.
It is essential to establish that considerably less energy is dissipated during cleavage crack propagation compared to ductile failure [13[13] Hütter, G., Linse, T., Roth, S., Mühlich, U., & Kuna, M. A modeling approach for the complete ductile-brittle transition region: cohesive zone in combination with a non-local Gurson-model. International Journal of Fracture, 185(1-2), 129-153, 2014], so one fracture mode can fundamentally change the other when both are considered together. Over the years, a few studies investigated crack propagation by using a sort of combination between CZM and Gurson's modified model. Tvergaard and Hutchinson [19[19] Tvergaard, V.; Hutchinson, J. W. Effect of strain-dependent cohesive zone model on predictions of crack growth resistance. International Journal of Solids and Structures, v. 33, n. 20-22, p. 3297-3308, 1996.] studied the reduction of the peak stress in the CZM through a plastic strain effect from the acceleration of void growth and nucleation, with the help of the GTN model. Tvergaard [35[35] Tvergaard, V. Crack growth predictions by cohesive zone model for ductile fracture.Journal of the Mechanics and Physics of Solids, 49(9), 2191-2207, 2001.] made predictions of ductile fracture by CZM making use of a special interface element. In this element, unlike the initial CZM proposed by Tvergaard and Hutchinson [19[19] Tvergaard, V.; Hutchinson, J. W. Effect of strain-dependent cohesive zone model on predictions of crack growth resistance. International Journal of Solids and Structures, v. 33, n. 20-22, p. 3297-3308, 1996.] where the initial width of the interface element is zero, the separation law is calculated based on a background element with a non-zero width indicating the porosity of the material, where the GTN is applied. However, this approach would only allow ductile fracture analysis, considering that the separation law would no longer be based on cleavage.Uthaisangusuk et al. [30[30] Uthaisangsuk, V. et al. Micromechanical modeling of damage behavior of multiphase steels. Computational Materials Science 43.1: 27-35, 2008.] analyzed the evolution of voids and cleavage in multiphase steels by RVE calculations, using GTN and CZM simultaneously, finding a good comparison with experimental results. In a more recent study, Hutter et al. [13[13] Hütter, G., Linse, T., Roth, S., Mühlich, U., & Kuna, M. A modeling approach for the complete ductile-brittle transition region: cohesive zone in combination with a non-local Gurson-model. International Journal of Fracture, 185(1-2), 129-153, 2014] proposed the combination of the two rupture models for a complete analysis of the crack propagation. An exponential CZM by Xu and Needleman [31[31] Xu, X. P., & Needleman, A. Numerical simulations of fast crack growth in brittle solids. Journal of the Mechanics and Physics of Solids, 42(9), 1397-1434. (1994)] was implemented in combination with a non-local modified Gurson model [24[24] Linse, T., Hütter, G., & Kuna, M. Simulation of crack propagation using a gradient-enriched ductile damage model based on dilatational strain. Engineering Fracture Mechanics, 95, 13-28, 2012.]. They found that this kind of approach captures qualitative effects of corresponding experiments such as the cleavage initiation in front of a stretch zone, the formation of secondary cracks and possible crack arrest. Nevertheless, no analysis has been done associating the interference of one model functionality with the other.
The cleavage-ductile transition will be investigated in this work through numerical analyses of elastic-plastic materials modelled by finite elements.In particular, it will be explored how mechanical and fracture properties as well as inertial properties affect transition between the two fracture modes. This is a subject not fully understood or explored and it is a fundamental issue in the fracture ofmetals.The rupture analysis will be done mostly by the use of the crack growth resistance curves (R-curves) [9[9] Tvergaard, V. Influence of void nucleation on ductile shear fracture at a free surface. Journal of the Mechanics and Physics of Solids, v. 30, n. 6, p. 399-425, 1982.][10[10] Tvergaard, V. Influence of voids on shear band instabilities under plane strain conditions. International Journal of Fracture, v.17, p.389-407, 1981.][17[17] Tvergaard, V.; Needleman, A. Analysis of the cup-cone fracture in a round tensile bar. Acta metallurgica, v. 32, n. 1, p. 157-169, 1984.][19[19] Tvergaard, V.; Hutchinson, J. W. Effect of strain-dependent cohesive zone model on predictions of crack growth resistance. International Journal of Solids and Structures, v. 33, n. 20-22, p. 3297-3308, 1996.][28[28] Brocks, W. Cohesive strength and separation energy as characteristic parameters of fracture toughness and their relation to micromechanics. Structural Durability & Health Monitoring, 1(4), 233, 2005.][14[14] Beremin, F. M. et al. A local criterion for cleavage fracture of a nuclear pressure vessel steel. Metallurgical transactions A, v. 14, n. 11, p. 2277-2287, 1983.]. In section 2 the methodology is described. Applications, comparisons and discussion are presented in section 3. Finally, in section 4 conclusions are made.
2 FAILURE MODELS
In this section the two types of failure models considered in this work, cleavage and ductile fracture, are briefly described as well as computational implementation. Aspects related to definition of the crack size when the ductile model is used are also explored.
2.1 Cleavage fracture by Cohesive Zone Model
Cleavage fracture is considered by a cohesive zone model based on the Tvergaard-Hutchinson proposal [4[4] Tvergaard, V.; Hutchinson, J. W. The relation between crack growth resistance and fracture process parameters in elastic-plastic solids. Journal of the Mechanics and Physics of Solids, v. 40, n. 6, p. 1377-1397, 1992.]. Traction vs separation relation is shownin Figure 1.

λ is a parameter obtained as a function of the cohesive zone separation and λ1 and λ2 appear as form factors of the separation law.
In Equation 1, Δn and Δt are respectively the normal and tangential openings and δn and δt are their respective critical values. Thus, as observed in Figure 1, λ will increase with crack opening, characterizing the rupture when λ=1. Unlike the model disseminated by Needleman [15[15] Needleman, A. A continuum model for void nucleation by inclusion debonding. J. Appl. Mech. Trans. ASME 54 (3), 525-531, 1987.], this factor will cause tangential displacements also to be accounted for in determining the traction in the cohesive zone. Thus, according to Tvergaard [4[4] Tvergaard, V.; Hutchinson, J. W. The relation between crack growth resistance and fracture process parameters in elastic-plastic solids. Journal of the Mechanics and Physics of Solids, v. 40, n. 6, p. 1377-1397, 1992.] as long as λ increases monotonically, tractions are expressed by:
where the potential of consumed fracture energy (or distribution of fracture energy) is:
Gc is the energy consumed per unit area in the cleavage fracture process and can be obtained by the area below the function, Figure 1, as:
2.2 GTN-Model for ductile fracture
The development of the ductile fracture is modelled using the formulation of Gurson [8[8] Gurson, A. L. Continuum theory of ductile rupture by void nucleation and growth: parti-yield criteria and flow rules for porus ductile media. ASME Journal of Engineering Materials and Technology, v. 99, p.2-15, 1977.], modified by Tvergaard [9[9] Tvergaard, V. Influence of void nucleation on ductile shear fracture at a free surface. Journal of the Mechanics and Physics of Solids, v. 30, n. 6, p. 399-425, 1982.] [10[10] Tvergaard, V. Influence of voids on shear band instabilities under plane strain conditions. International Journal of Fracture, v.17, p.389-407, 1981.], and Tvergaard and Needleman [17[17] Tvergaard, V.; Needleman, A. Analysis of the cup-cone fracture in a round tensile bar. Acta metallurgica, v. 32, n. 1, p. 157-169, 1984.], which included the parameters and to change the effect of the hydrostatic pressure at all stages of deformation (GTN-Model).
The yield condition in the GTN-Model is:
Where is the current void volume fraction, p the hydrostatic stress, s ij the deviatoric part of the stress tensor, the yield stress and the Kronecker delta.
The void growth rate () will depend on the value of a critical void volumetric fraction, which will dictate the beginning of the void coalescence:
Where is the rate of nucleated voids, is the growth rate and the rate of void coalescence. Their values are expressed by:
where is the plastic strain; is the equivalent plastic strain and is the rate of it. is the volumetric fraction of nucleated voids; is an equivalent deformation value around which the voids are formed and is the corresponding standard deviation.
Needleman and Tvergaard [17[17] Tvergaard, V.; Needleman, A. Analysis of the cup-cone fracture in a round tensile bar. Acta metallurgica, v. 32, n. 1, p. 157-169, 1984.] have been using the parameters of and in their studies for different types of materials. It is observed that these values offer a good range for analysis since nucleation does not occur abruptly.
In Equation 10, and are the parameters that control the void coalescence and is the void volume fraction corresponding to the rupture in the absence of hydrostatic stress and it is approximated by:
Coalescence occurs in a volumetric void fraction between 0.1 and 0.2 [18[18] Brown, L. M; Emburry, J. D. The initiation and growth of voids at second phase particles. In: 3rd. Int. Conf. On Strength of Metals and Alloys, Proc. Londres: Institute of Metals. p.164-169, 1973.]. Tvergaard and Needleman [9[9] Tvergaard, V. Influence of void nucleation on ductile shear fracture at a free surface. Journal of the Mechanics and Physics of Solids, v. 30, n. 6, p. 399-425, 1982.][10[10] Tvergaard, V. Influence of voids on shear band instabilities under plane strain conditions. International Journal of Fracture, v.17, p.389-407, 1981.][17[17] Tvergaard, V.; Needleman, A. Analysis of the cup-cone fracture in a round tensile bar. Acta metallurgica, v. 32, n. 1, p. 157-169, 1984.][20[20] Needleman, A., & Tvergaard, V. An analysis of dynamic, ductile crack growth in a double edge cracked specimen. International Journal of Fracture, 49(1), 41-67, 1991.] previously used an from 0.15 to 0.2 in numerical analysis, which will be taken into consideration in the first phase of the applications in this work. However, higher values of become very critical when considering the cleavage-ductile transition, given that the cleavage failure will dominate the process before the void volume reaches.
2.3 Numerical implementation
The use of cohesive models in finite element simulations is based on the insertion of interface elements between volumetric elements of the mesh. The opening is controlled by the separation law established in the CZM, as seen in Figure 2.

Cohesive zone openings are stored in a vector as shown below:
Work of separation is calculated as:
Where Te is the traction vector and ΓT,e the surface of the cohesive element. In the present work, four Gauss points are used to integrate Equation 13. The term can be introduced in the Principle of Virtual Work, which can be written for the body as follows:
U represent displacements in the volume body Ω; Δ are the crack openings; ρ is the material specific mass; B are the volume forces; F are the forces on surface ΓF; T are the cohesive tractions and σ are the Cauchy stresses. δ defines a virtual variation. Equation 14 is solved by a Central Difference Method when inertial contributions are taken into consideration (second term, on the left). Otherwise the equation is solver by a Newton-Raphson procedure.
The ductile model is implemented through the volumetric constitutive equations. The increment in Cauchy stress is obtained by:
where Δσc is the increment of Cauchy stress tensor in a corotational system, is he Hooke tensor, is the strain rate tensor and the logarithmic strain rate, both calculated also on the corotational system. Total stresses are calculated as:
where Δσ can be obtained from Δσ c (Equation 15) by rotation through the rotation matrix of the polar decomposition. Integration of Equation 15 is done by a predictor-corrector type of algorithm, as in small deformation algorithms. Details can be found for instance in Bittencourt and Creus [32[32] Bittencourt, E. & Creus, G.J. Finite Element Analysis of Three-dimensional Contact and Impact in Large Deformation Problems. 69, 219-234, 1998.] and Bittencourt [33[33] Bittencourt, E. On the effects of hardening models and lattice rotations in strain gradient crystal plasticity simulations. International Journal of Plasticity, 108, 169-185, 2018.]. Plastic strains must be also obtained from equations described in section 2.2. Details can be found in Cunda [7[7] Cunda, L. A. B. Gurson Model for Ductile Damage: Computational Approach and Applications (in Portuguese), Ph.D. Thesis, Universidade Federal do Rio Grande do Sul, Brazil, 2006.].
Bi-linear 4-node isoparamentric finite elements are used. 4 Gauss points are used to integrate deviatoric part of stresses and 1 Gauss point is used to integrate the volumetric part in Equation 15. Hence, the two fracture models are coupled with the CZM working through the interface elements and the GTN-model acting on the constitutive law of the volumetric elements.
2.4 Ductile propagation
In order to analyze the transition between the two processes, it is important to define a relationship for the propagation of damage at the crack tip in the form of propagation of the crack itself (). Differently from cleavage failure, in the continuous damage model there is not a discrete macroscopic crack. Propagation can be inferred following the porosity parameter in the volumetric finite elements.
In previous studies dealing with cleavage-ductile transition, the use of cells [21[21] XIA, L.; SHIH, C. F. Ductile crack growth-III. Transition to cleavage fracture incorporating statistics. Journal of the Mechanics and Physics of Solids, v. 44, n. 4, p. 603-639, 1996.] in finite element meshes were widely used, mainly in dynamic analysis [22[22] Tvergaard, V., & Needleman, A. An analysis of the brittle-ductile transition in dynamic crack growth. International Journal of Fracture, 59(1), 53-67, 1993.][23[23] Anvari, M., Scheider, I., & Thaulow, C. Simulation of dynamic ductile crack growth using strain-rate and triaxiality-dependent cohesive elements. Engineering fracture mechanics, 73(15), 2210-2228, 2006.]. However, this kind of methodology has been used less frequently in recent years since the stresses that trigger the cleavage cannot be precisely defined. Also, it is desirable to have a model where the damage propagates continuously and homogeneously in the material, and not through a discrete distribution of cells.
Needleman and Tvergaard [29[29] Needleman, A., and Tvergaard, V.. Numerical modeling of the ductile-brittle transition. International Journal of Fracture 101.1-2: 73, 2000.] studied cases of ductile-cleavage transition, defining a boundary in front of the crack tip where . The length of this region,, is added to the crack length. In more recent studies, such as Linse et al. [24[24] Linse, T., Hütter, G., & Kuna, M. Simulation of crack propagation using a gradient-enriched ductile damage model based on dilatational strain. Engineering Fracture Mechanics, 95, 13-28, 2012.] and Hütter et al. [13[13] Hütter, G., Linse, T., Roth, S., Mühlich, U., & Kuna, M. A modeling approach for the complete ductile-brittle transition region: cohesive zone in combination with a non-local Gurson-model. International Journal of Fracture, 185(1-2), 129-153, 2014], crack growth amount was measured as:
where is the total solid length, the initial crack length, the initial void volume fraction, the ultimate void volume fraction and the current void fraction volume. This definition is used in the present applications, considering only regions where.
3 APPLICATION AND RESULTS
Applications, comparisons and discussions are presented in this section. It is divided in two parts. First a strip in pure mode I is analyzed and then a Compact Tension test is simulated and compared to experiments.
3.1 Stripcase
Analyzed problem is a strip in plane strain, shown in Fig. 3. Dimensions of the strip are 0.003 vs.0.001 mm. The elastic-plastic solid has an initial tensile yield stress σ y , with an uniaxial behavior defined as follows:
Where E is the Young’s Modulus, h the strain hardening modulus. An aluminum piece with E=70000 MPa, ν=0.33 (Poisson’s ratio) is investigated. Different values of h andσ y were considered.
In the middle of the strip a crack 1.4 x 10⁻⁴ mm long is placed in x direction, as indicate by the red horizontal line in Figure 3. Prescribed nodal displacements of 3 x 10⁻⁵ mm are applied at all the upper nodes of the piece in y direction and prescribed displacement of -3 x 10⁻⁵ mm are applied at all bottom nodes of the piece, in the same direction. Therefore the crack is under pure mode I fracture. In Figure 3 is possible to see the used mesh, as well as the refined part along the fracture line. The mesh has 5920 elements with 6118 nodes, where the size of the finite elements near the crack tip is 2 x 10⁻⁶ mm.

Cohesive interface elements are placed only in the plane of the crack. The CZM toughness was considered equal to 0.001 N/mm, with a equal to 1750 MPa (except when mentioned otherwise).
The values of and used were respectively 0.15 and 0.5, according to Tvergaard previously studies. Therefore, it is possible to obtain (Equation 4) a normal critical opening equal to 8.4656x10⁻⁷mm. Below three distinct situations are considered: first pure cleavage; then it is investigatigated the effects of the damage model on cleavage behavior; finally the transition cleavage-ductile is studied.
3.1.1 Pure Cleavage
First, cases with pure cleavage rupture are investigated, or only the CZM is acting in the failure process. In Fig. 4 and Fig. 5, R-curves (normalized applied energy J/G c vs.normalized crack propagation Δa/δn) for distinct values of r (σ max /σ y ) are presented. Different normalized strain hardening modulus h/E are also considered.
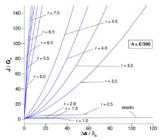

As noticed, the higher the r value, the greater the material toughness. In other words, for crack propagation to occur, the increase in r will require more energy to create new surfaces due to plastic dissipation. There was practically no gain in toughness for r below 2.5, as also observed by Tvergaard [4[4] Tvergaard, V.; Hutchinson, J. W. The relation between crack growth resistance and fracture process parameters in elastic-plastic solids. Journal of the Mechanics and Physics of Solids, v. 40, n. 6, p. 1377-1397, 1992.]. The peak stress required in the fracture process is around 2.5 σ y and then lower stresses will cause the crack to propagate without full development of the plastic zone.
Another important factor is that the crack propagation becomes slower with the reduction of the strain hardening modulus h. On the other hand, the computational analyzes were more stable with the increase of this parameter.
3.1.2 The influence of the GTN properties on the CZM
In the next applications, the ductile model is introduced. The effects of void nucleation followed by void growth are analyzed, allowing to investigate how much this process affects cleavage rupture in the body when the two models are coupled.
Nucleation effects:
Volumetric fraction of nucleated voids f N is fixed at 0.05 with s N =0.1 and ε N ranging between 0.1 to 0.4.The corresponding R-curves are observed in Figure 6, with r=3.5.

R-curve for CZM tests considering nucleation and growth of voids. (a) Elastic-perfect plastic material. (b) h=E/100.
In Figure 6, a delay was observed in the crack propagation with the beginning of nucleation. This is due to the fact that, with the increase in the void volume, stresses in the solid decrease, with part of the applied fracture energy (J) being consumed in the process.
The nucleation of voids occurred more slowly with the increase of ε N . Such occurrence takes place because ε N causes the nucleation law to change or the higher its value, the slower the nucleation phenomenon.
Growth and coalescence effects:
In this second part, growth and coalescence are also considered.The parameters used are f N =0.05, ε N =0.3, s N =0.1, h=E/100 and r=5. Three different values of impurities/initial porosity f 0 =0.01, 0.005, 0.001, two values of Δε= 0.25, 0.6 and also two values of f C =0.1, 0.15 are considered.
It was possible to obtain the variation of normalized stressesσ 22 /σ y and void volume fraction f at the crack tip during growth and after coalescence (Figure 7 and Figure 8). The figures are a function of the equivalent plastic deformation .
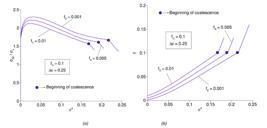
Normalized longitudinal stress (a) and void volume fraction (b) versus equivalent plastic strain: fC=0.1, Δε=0.25.
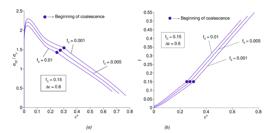
Normalized longitudinal stress (a) and void volume fraction (b) versus equivalent plastic strain: fC=0.15, Δε=0.6.
For a given stress, a greater equivalent plastic strain was found with the reduction of the initial impurity/porosity level, implying that despite the cleavage fracture being controlled only by stresses, it is indirectly affected by these aspects. In previous studies, Tvergaard and Hutchinson [19[19] Tvergaard, V.; Hutchinson, J. W. Effect of strain-dependent cohesive zone model on predictions of crack growth resistance. International Journal of Solids and Structures, v. 33, n. 20-22, p. 3297-3308, 1996.] reported that a decrease in the maximum traction σ max of the cohesive law should be taken when the effective plastic strain exceeds a critical value. This would be necessary because the cohesive zone model does not account for the reduction in material resistance due to plastic deformation.This is an important issue, mainly because σ max and G c are the most significant parameters in the CZM. In the present work this correction of σ max value is not done.
3.1.3 Transition between cleavage-ductile modes
The transition between fracture modes will be investigated below. For the examples that follow, a symmetric version of the previous mesh is used. This means that only the part above the crack line is considered, being all nodes at the crack line being blocked in y direction, with exception of the nodes of the initial crack surface. The GTN-Model parameters used in the examples are: f U =0.6, f N =0.04, ε N =0.4, s N =0.17, h=E/100, r=5, f 0 =0.001, Δε = 0.6, f C =0.15 α 1 =1.5 and α 2 =1.0.
For low values of initial yield stress, r=5, the transition occurred more quickly, with the propagation of damage accumulating in front of the crack tip and generating a crack blunting, as seen in Figure 9.

The increase in the initial yield stress will delay the propagation of the damage, making the transition to take place later. For a high enough yield stress, the region where the damage is formed cannot keep up with the crack propagation by cleavage, resulting in a low density of voids in front of the crack tip. It will cause the solid to fail predominantly by cleavage, even if the material damage slightly changes the speed of crack propagation. This event can be seen in Figure 10, for r=3.5.

Distribution of damage (a) and Pressure field (b) near crack tip for r = 3.5. Elements with p>1000 MPa are ruptured by ductile mode.
However, still for low r values, in the course of propagation the hydrostatic stress at the crack tip may reach high enough values to trigger ductile fracture, even if there is nota considerable density of voids in the region. Then the ductile fracture is no longer triggered by the void evolution and starts to be controlled by hydrostatic stress. This aspect is shown in Fig. 10, where even for low f values (a), ductile rupture still takes place due to high values of pressure (b).
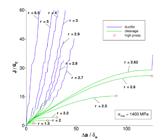
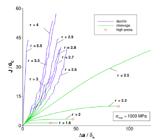
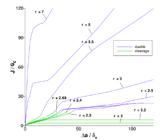
Figures 11 to 15 show R-curves depicting where the transition occurs. In Figures 12 and 13 different σ max are also considered. In Figures 14 and 15 inertial terms are added. In general, initially the curves follow the behavior observed in the pure cleavage examples, where the greater the r value, the slower the cleavage fracture propagation. Also for greater r values, ductile rupture tends to dominate the propagation process, as expected.
It was also found that during the transition, in some cases, the two rupture processes occurred simultaneously for a brief period. The tendency of this event and its duration was increased by the beginning of coalescence in the material.
The numerical solution for a few cases stopped due to convergence problems during the ductile regime. The numerical problems are related to elements close to the crack tip that are near the failure and are being excessively deformed by the "weakening" effect of the damage process in the GTN-Model. The same kind of problem was reported by Linse et al. [24[24] Linse, T., Hütter, G., & Kuna, M. Simulation of crack propagation using a gradient-enriched ductile damage model based on dilatational strain. Engineering Fracture Mechanics, 95, 13-28, 2012.] and by Samal et al. [25[25] Samal, M. K., Seidenfuss, M., Roos, E., Dutta, B. K., & Kushwaha, H. S. Finite element formulation of a new nonlocal damage model. Finite Elements in Analysis and Design, 44(6-7), 358-371, 2008.] in highly refined meshes.
The reduction of σ max in the CZM caused the crack to propagate more quickly, delaying the transition to the ductile process, as seen in Figures 12 and 13, for the same r. This is an interesting aspect, indicating that the ratio r alone does not uniquely define propagation. However, ratior tends to be the dominant factor in the transition. For instance for r values below 2.68, 2.62 and 2.52 for respectively σ max equal to 1750 MPa, 1400 MPa and 1000 MPa, propagation always occurs only by cleavage. Conversely, propagation always occurs only by ductile fracture for r>5.5, approximately.
The R-curves for cases where inertial terms are considered are shown in Figure 15.The impact velocity on the following dynamic examples was 3000 mm/s. Transitions occurred in different energy ranges, compared to quasi-static cases.
Therein, r values less than 2.2 cause the crack to propagate exclusively by cleavage, and for r values above 4.3, the rupture was completely ductile. The brittle-ductile transition occurred for r values inside this interval. Figure 15 shows a comparin between dynamic and quasi-static cases for few r combinations.
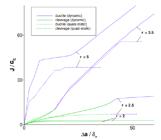
In all cases, ductile and cleavage propagation was delayed by the inertial effect. The effect is expected, see for instance Freund [34[34] Freund, L.B. Dynamic fracture mechanics. Cambridge University Press, New York, 1998.], as stresses increase more slowly due to inertial effects. It is important noticing also that the transitions occurred at the same values of Δa, for each r, regardless of inertial contributions. The curves do not differ initially, with a tendency for higher energy dissipation in the dynamic case.
3.2 C(T) case - comparison with experiments
Below, simulations of a C(T) (Compact Tension) specimen are performed and compared with experimental and numerical data obtained by the studies in the references [26[26] Brocks, W., Klingbeil, D., Künecke, G., & Sun, D. Z. Application of the Gurson model to ductile tearing resistance. In Constraint Effects in Fracture Theory and Applications: Second Volume. ASTM International, 1995.][27[27] Siegmund, T. and Brocks, W., "The Role of Cohesive Strength and Separation Energy for Modeling of Ductile Fracture," Fatigue and Fracture Mechanics: 30th Volume, ASTM STP 1360, P. C. Paris and K. L. Jerina, Eds., American Society for Testing and Materials, West Conshohocken, PA, pp. 139-151, 2000.][28[28] Brocks, W. Cohesive strength and separation energy as characteristic parameters of fracture toughness and their relation to micromechanics. Structural Durability & Health Monitoring, 1(4), 233, 2005.].
The dimensions of the solid used for the test are: W=50 mm, a0/W=0.59 where W is the full length of the piece, and a0 the initial crack length, see Figure 16.The material is a ferric structural steel with the German classification StE460. It has the following properties: E=210000 MPa, ν=0.3, σy=470 MPa. The hardening properties used by the authors in the experiments were not specified, so simulations in the present work are made for cases with and without strain hardening in order to find a better fit to the experiments.
The CZM parameters followed the same data given by the references [26[26] Brocks, W., Klingbeil, D., Künecke, G., & Sun, D. Z. Application of the Gurson model to ductile tearing resistance. In Constraint Effects in Fracture Theory and Applications: Second Volume. ASTM International, 1995.][27[27] Siegmund, T. and Brocks, W., "The Role of Cohesive Strength and Separation Energy for Modeling of Ductile Fracture," Fatigue and Fracture Mechanics: 30th Volume, ASTM STP 1360, P. C. Paris and K. L. Jerina, Eds., American Society for Testing and Materials, West Conshohocken, PA, pp. 139-151, 2000.][28[28] Brocks, W. Cohesive strength and separation energy as characteristic parameters of fracture toughness and their relation to micromechanics. Structural Durability & Health Monitoring, 1(4), 233, 2005.]: σmax =3.36σy, =1579 MPa, Gc=53.3 N/mm, Gc /(σy D)=0.567, where D is a scale factor [27[27] Siegmund, T. and Brocks, W., "The Role of Cohesive Strength and Separation Energy for Modeling of Ductile Fracture," Fatigue and Fracture Mechanics: 30th Volume, ASTM STP 1360, P. C. Paris and K. L. Jerina, Eds., American Society for Testing and Materials, West Conshohocken, PA, pp. 139-151, 2000.], and it is widely used as a definition of the characteristic size L of finite elements in numerical analyzes, with Lmin=D/2. Therefore, D=0.2 mm and Lmin=0.1 mm.The characteristic cohesive lengthδn, Equation 4, is then 0.05 mm.
The GTN model properties determined by Brocks et al. [26[26] Brocks, W., Klingbeil, D., Künecke, G., & Sun, D. Z. Application of the Gurson model to ductile tearing resistance. In Constraint Effects in Fracture Theory and Applications: Second Volume. ASTM International, 1995.] are: fU=0.19, fN=0.2, εN=0.3, sN=0.1, f0=0.0025, fC=0.021. The finite element mesh built for this simulation is shown in Figure 16.

Symmetric mesh used for simulation of the C(T) test - (a) Full mesh. (b) Refined mesh around the crack tip. Dimensions in mm.
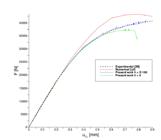
A prescribed displacements uLL is applied at the loading point, Figure 16. In Figure 17 the corresponding force at the loading point versus uLL is shown, together with results from the literature [26[26] Brocks, W., Klingbeil, D., Künecke, G., & Sun, D. Z. Application of the Gurson model to ductile tearing resistance. In Constraint Effects in Fracture Theory and Applications: Second Volume. ASTM International, 1995., 27[27] Siegmund, T. and Brocks, W., "The Role of Cohesive Strength and Separation Energy for Modeling of Ductile Fracture," Fatigue and Fracture Mechanics: 30th Volume, ASTM STP 1360, P. C. Paris and K. L. Jerina, Eds., American Society for Testing and Materials, West Conshohocken, PA, pp. 139-151, 2000.]. Considering the present work, two different simulations were performed, as seen in Figure 17. One considering an elastic-perfect plastic material, and a second using a linear strain hardening of h=E/100. The simulation without hardening presented a sudden drop in the force soon after the beginning of unstable crack propagation. This same behavior is found in studies by Hütter [13[13] Hütter, G., Linse, T., Roth, S., Mühlich, U., & Kuna, M. A modeling approach for the complete ductile-brittle transition region: cohesive zone in combination with a non-local Gurson-model. International Journal of Fracture, 185(1-2), 129-153, 2014].The case with hardening presented the best fitting with experimental behavior. The fitting is considerably better than results presented in Sigmund and Brooks [27[27] Siegmund, T. and Brocks, W., "The Role of Cohesive Strength and Separation Energy for Modeling of Ductile Fracture," Fatigue and Fracture Mechanics: 30th Volume, ASTM STP 1360, P. C. Paris and K. L. Jerina, Eds., American Society for Testing and Materials, West Conshohocken, PA, pp. 139-151, 2000.]. It must be emphasized here that in the present simulations the cohesive model and the GTN model are both considered. In simulations done in Sigmund and Brocks [27[27] Siegmund, T. and Brocks, W., "The Role of Cohesive Strength and Separation Energy for Modeling of Ductile Fracture," Fatigue and Fracture Mechanics: 30th Volume, ASTM STP 1360, P. C. Paris and K. L. Jerina, Eds., American Society for Testing and Materials, West Conshohocken, PA, pp. 139-151, 2000.], only the GTN model was considered. Cleavage propagation started for uLL=0.394 mm. As the cohesive zone is activated before propagation begins, the difference between Sigmund and Brooks [27[27] Siegmund, T. and Brocks, W., "The Role of Cohesive Strength and Separation Energy for Modeling of Ductile Fracture," Fatigue and Fracture Mechanics: 30th Volume, ASTM STP 1360, P. C. Paris and K. L. Jerina, Eds., American Society for Testing and Materials, West Conshohocken, PA, pp. 139-151, 2000.] and the present simulations can be explained by the consideration of the cleavage process. This application demonstrates the practical importance of coupling both fracture processes.
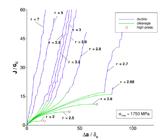
Figure 18 shows the R-curves obtained from simulations with linear strain hardening and J-integral [16[16] Rice, J. R. A path independent integral and the approximate analysis of strain concentration by notches and cracks. Journal of applied mechanics, v. 35, n. 2, p. 379-386, 1968.] calculated according to ASTM-E1820-11, Equation 19:
where K is the stress intensity factor, Apl the area under the force (F) vs. displacement (uLL) curve, BN the thickness, b0 the uncracked ligament (W-a0), νis the Poisson’s ratio and ηpl a parameter given by ηpl=2+0.522b0/W.

The results obtained by the present formulation in this case show again a good approximation of the experimental data and point out the occurrence of short mutual rupture by both precesses, for values of Δa between 0.2 mm and 0.6 mm. It is clear from the figure that the use alone of the GTN model [27[27] Siegmund, T. and Brocks, W., "The Role of Cohesive Strength and Separation Energy for Modeling of Ductile Fracture," Fatigue and Fracture Mechanics: 30th Volume, ASTM STP 1360, P. C. Paris and K. L. Jerina, Eds., American Society for Testing and Materials, West Conshohocken, PA, pp. 139-151, 2000.] tends to overestimate J values for small cracks. For larger cracks, when only GTN model is activated in the present algorithm, simulations tends to underestimate experiments. Discrepancies may be related to the strain hardening considered, that may change J calculation (see Equation 19). Also for large propagations, convergence of the GTN algorithm starts to become more difficult due to the higher non-linearity involved. Mesh distortion may have also played an effect in this regard.
4 CONCLUSIONS
In the present study, two fracture methodologies were coupled. The cohesive zone model [19[19] Tvergaard, V.; Hutchinson, J. W. Effect of strain-dependent cohesive zone model on predictions of crack growth resistance. International Journal of Solids and Structures, v. 33, n. 20-22, p. 3297-3308, 1996.], capable of capturing fracture by cleavage, and a ductile fracture model [8[8] Gurson, A. L. Continuum theory of ductile rupture by void nucleation and growth: parti-yield criteria and flow rules for porus ductile media. ASME Journal of Engineering Materials and Technology, v. 99, p.2-15, 1977.][17[17] Tvergaard, V.; Needleman, A. Analysis of the cup-cone fracture in a round tensile bar. Acta metallurgica, v. 32, n. 1, p. 157-169, 1984.]. The union of these methodologies allowed a more comprehensive view of the entire failure process in metals and permitted to observe the transition/competition between the two fracture processes. The following specific conclusions could be drawn:
-
The introduction of ductile (GTN) model caused a delay of the crack propagation by cleavage. It occurs because of the stress reduction in the material due to porosity introduced. Therefore, the damage (voids) on the material affected the propagation process, even in cases of rupture only by cleavage.
Larger nucleation deformations () make the damage effect less significant and delay the brittle-ductile transition.
Low values of the r ratio () imply that fracture by cleavage prevails. For high r values, there is a predominance of ductile fracture, but for intermediate values (r around 3) the two modes of rupture coexist. Thus r tends to control the brittle-ductile transition. alone has a small effect on transition, but larger values tend to favor cleavage propagation.
-
Even for low values of r, ductile failure can occur due to the high levels of hydrostatic stresses present at the crack tip, even though the level of voids is low.
The introduction of dynamic-inertial effects led to a delay in crack propagation, at least in the range analyzed. The transition cleavage-ductile occurred at similar values of for quasi-static and dynamic cases.
-
Comparisons with the literature indicated an excellent match with experiments for small cracks. The correlation was better than that presented by theories in which only the ductile fracture model was considered [26[26] Brocks, W., Klingbeil, D., Künecke, G., & Sun, D. Z. Application of the Gurson model to ductile tearing resistance. In Constraint Effects in Fracture Theory and Applications: Second Volume. ASTM International, 1995.][27[27] Siegmund, T. and Brocks, W., "The Role of Cohesive Strength and Separation Energy for Modeling of Ductile Fracture," Fatigue and Fracture Mechanics: 30th Volume, ASTM STP 1360, P. C. Paris and K. L. Jerina, Eds., American Society for Testing and Materials, West Conshohocken, PA, pp. 139-151, 2000.]. It is possible then that, in these cases, the cleavage-ductile transition has had a substantial effect on fracture behavior. For larger crack, when only the GTN process is active, fitting with experiments was not so good, which may be explained by converge difficulties with the algorithm.
References
-
[1]Dugdale, D. S. Yielding of steel sheets containing slits.Journal of the Mechanics and Physics of Solids, v. 8, n. 2, p. 100-104, 1960.
-
[2]Barenblatt, G. I. The mathematical theory of equilibrium cracks in brittle fracture. In: Advances in applied mechanics. Elsevier, p. 55-129, 1962.
-
[3]Xu, X.-P.; Needleman, A. Numerical simulations of fast crack growth in brittle solids. Journal of the Mechanics and Physics of Solids, v. 42, n. 9, p. 1397-1434, 1994.
-
[4]Tvergaard, V.; Hutchinson, J. W. The relation between crack growth resistance and fracture process parameters in elastic-plastic solids. Journal of the Mechanics and Physics of Solids, v. 40, n. 6, p. 1377-1397, 1992.
-
[5]Zhang, Z. J.; Paulino, G. H. Cohesive zone modeling of dynamic failure in homogeneous and functionally graded materials. International journal of plasticity, v. 21, n. 6, p. 1195-1254, 2005.
-
[6]Roth, S.; Hütter, G.; Kuna, M. Simulation of fatigue crack growth with a cyclic cohesive zone model. International Journal of Fracture, v. 188, n. 1, p. 23-45, 2014.
-
[7]Cunda, L. A. B. Gurson Model for Ductile Damage: Computational Approach and Applications (in Portuguese), Ph.D. Thesis, Universidade Federal do Rio Grande do Sul, Brazil, 2006.
-
[8]Gurson, A. L. Continuum theory of ductile rupture by void nucleation and growth: parti-yield criteria and flow rules for porus ductile media. ASME Journal of Engineering Materials and Technology, v. 99, p.2-15, 1977.
-
[9]Tvergaard, V. Influence of void nucleation on ductile shear fracture at a free surface. Journal of the Mechanics and Physics of Solids, v. 30, n. 6, p. 399-425, 1982.
-
[10]Tvergaard, V. Influence of voids on shear band instabilities under plane strain conditions. International Journal of Fracture, v.17, p.389-407, 1981.
-
[11]Zhang, Z. L.; Niemi, E. A new failure criterion for the Gurson-Tvergaard dilational constitutive model. International Journal of Fracture, v. 70, n. 4, p. 321-334, 1994.
-
[12]Nahshon, K.; Hutchinson, J. W. Modification of the Gurson model for shear failure. European Journal of Mechanics-A/Solids, v. 27, n. 1, p. 1-17, 2008.
-
[13]Hütter, G., Linse, T., Roth, S., Mühlich, U., & Kuna, M. A modeling approach for the complete ductile-brittle transition region: cohesive zone in combination with a non-local Gurson-model. International Journal of Fracture, 185(1-2), 129-153, 2014
-
[14]Beremin, F. M. et al. A local criterion for cleavage fracture of a nuclear pressure vessel steel. Metallurgical transactions A, v. 14, n. 11, p. 2277-2287, 1983.
-
[15]Needleman, A. A continuum model for void nucleation by inclusion debonding. J. Appl. Mech. Trans. ASME 54 (3), 525-531, 1987.
-
[16]Rice, J. R. A path independent integral and the approximate analysis of strain concentration by notches and cracks. Journal of applied mechanics, v. 35, n. 2, p. 379-386, 1968.
-
[17]Tvergaard, V.; Needleman, A. Analysis of the cup-cone fracture in a round tensile bar. Acta metallurgica, v. 32, n. 1, p. 157-169, 1984.
-
[18]Brown, L. M; Emburry, J. D. The initiation and growth of voids at second phase particles. In: 3rd. Int. Conf. On Strength of Metals and Alloys, Proc. Londres: Institute of Metals. p.164-169, 1973.
-
[19]Tvergaard, V.; Hutchinson, J. W. Effect of strain-dependent cohesive zone model on predictions of crack growth resistance. International Journal of Solids and Structures, v. 33, n. 20-22, p. 3297-3308, 1996.
-
[20]Needleman, A., & Tvergaard, V. An analysis of dynamic, ductile crack growth in a double edge cracked specimen. International Journal of Fracture, 49(1), 41-67, 1991.
-
[21]XIA, L.; SHIH, C. F. Ductile crack growth-III. Transition to cleavage fracture incorporating statistics. Journal of the Mechanics and Physics of Solids, v. 44, n. 4, p. 603-639, 1996.
-
[22]Tvergaard, V., & Needleman, A. An analysis of the brittle-ductile transition in dynamic crack growth. International Journal of Fracture, 59(1), 53-67, 1993.
-
[23]Anvari, M., Scheider, I., & Thaulow, C. Simulation of dynamic ductile crack growth using strain-rate and triaxiality-dependent cohesive elements. Engineering fracture mechanics, 73(15), 2210-2228, 2006.
-
[24]Linse, T., Hütter, G., & Kuna, M. Simulation of crack propagation using a gradient-enriched ductile damage model based on dilatational strain. Engineering Fracture Mechanics, 95, 13-28, 2012.
-
[25]Samal, M. K., Seidenfuss, M., Roos, E., Dutta, B. K., & Kushwaha, H. S. Finite element formulation of a new nonlocal damage model. Finite Elements in Analysis and Design, 44(6-7), 358-371, 2008.
-
[26]Brocks, W., Klingbeil, D., Künecke, G., & Sun, D. Z. Application of the Gurson model to ductile tearing resistance. In Constraint Effects in Fracture Theory and Applications: Second Volume. ASTM International, 1995.
-
[27]Siegmund, T. and Brocks, W., "The Role of Cohesive Strength and Separation Energy for Modeling of Ductile Fracture," Fatigue and Fracture Mechanics: 30th Volume, ASTM STP 1360, P. C. Paris and K. L. Jerina, Eds., American Society for Testing and Materials, West Conshohocken, PA, pp. 139-151, 2000.
-
[28]Brocks, W. Cohesive strength and separation energy as characteristic parameters of fracture toughness and their relation to micromechanics. Structural Durability & Health Monitoring, 1(4), 233, 2005.
-
[29]Needleman, A., and Tvergaard, V.. Numerical modeling of the ductile-brittle transition. International Journal of Fracture 101.1-2: 73, 2000.
-
[30]Uthaisangsuk, V. et al. Micromechanical modeling of damage behavior of multiphase steels. Computational Materials Science 43.1: 27-35, 2008.
-
[31]Xu, X. P., & Needleman, A. Numerical simulations of fast crack growth in brittle solids. Journal of the Mechanics and Physics of Solids, 42(9), 1397-1434. (1994)
-
[32]Bittencourt, E. & Creus, G.J. Finite Element Analysis of Three-dimensional Contact and Impact in Large Deformation Problems. 69, 219-234, 1998.
-
[33]Bittencourt, E. On the effects of hardening models and lattice rotations in strain gradient crystal plasticity simulations. International Journal of Plasticity, 108, 169-185, 2018.
-
[34]Freund, L.B. Dynamic fracture mechanics. Cambridge University Press, New York, 1998.
-
[35]Tvergaard, V. Crack growth predictions by cohesive zone model for ductile fracture.Journal of the Mechanics and Physics of Solids, 49(9), 2191-2207, 2001.
Edited by
Editor:
Publication Dates
-
Publication in this collection
31 May 2021 -
Date of issue
2021
History
-
Received
29 June 2020 -
Reviewed
12 Jan 2021 -
Accepted
05 Feb 2021 -
Published
09 Feb 2021


