
Abstract
Wind effects on tensile fabric structures (TFS) are not extensively investigated. Available studies consider simplified TFS support conditions and comparisons between static and dynamic analyses are lacking. The response of a double hypar TFS under varying wind speed is carried out by using fluid-structure interaction (FSI). Realistic support conditions are considered. The double hypar geometry is determined through form-finding. Computational fluid dynamics (CFD) is the basis to perform dynamic analysis to propose pressure coefficients useful for design. Differences between dynamic and static analyses are assessed. It is found that the stresses in the fabric and axial forces in the supports are significantly different for each type of analysis, which cannot be captured by simplified uniform uplift wind and snow loadings. Static analysis using pressure coefficients leads to differences of up to 17.3% for stresses in the fabric, 10.5% for the compressive force in the masts and 33.5% for the tensile force in the cables, compared to a FSI analysis. Results give further insight into the wind response of realistic TFSs.
Keywords:
tensile fabric structure; double hypar; fluid-structure interaction; finite element simulation; form-finding; wind-induced forces

1 INTRODUCTION
The wind response of tensile fabric structures (TFSs) is a research topic which seems to be calling the attention of the research community, because they are widely used due to its impressive and versatile designs, light weight, ability to cover long spans among other characteristics. They are striking structures from the architectural standpoint and challenging ones from the structural engineering standpoint. As an example, Fig. 1 shows a famous tensile membrane structure in the Olympia Park in Munich, Germany. In the recent literature on TFSs, it is common to consider a single hypar (hyperbolic paraboloid) geometry, but the wind response of double hypars is not often reported, specially by considering realistic support conditions (arrangements of cables and masts) (e.g., Valdés-Vázquez et al., 2019Valdés-Vázquez, J.G., García-Soto, A.D., Hernández-Martínez, A. (2019). Dynamic Analysis of Hypar Membrane Structures Subjected to Seismic Excitations, Rev. int. métodos numér. cálc. diseño ing. 35 (1): 1-11.). Historically, feasible TFS geometries are determined by the form-finding method, which can be carried out with a force density approach (Schek, 1974Schek, H.-J. (1974). The force density method for form finding and computation of general networks, Computer Methods in Applied Mechanics and Engineering 3 (1): 115-134.), or with a force dynamic relaxation approach (Barnes, 1999Barnes, M.R. (1999). Form Finding and Analysis of Tension Structures by Dynamic Relaxation. International Journal of Space Structures 14 (2): 89-104.). Both are still being used for the form-finding procedure (Labbafi et al., 2017aLabbafi, S.F., Sarafrazi, S.R., Kang, T.H.K. (2017a). Comparison of viscous and kinetic dynamic relaxation methods in form-finding of membrane structures, Advances in Computational Design 2 (1): 71-87. and 2017b; Asadi et al., 2018Asadi, H., Hariri-Ardebili, M. A., Mirtaheri, M., Zandi, A.P. (2018). Force density ratios of flexible borders to membrane in tension fabric structures. Structural Engineering and Mechanics 67 (6): 555-563.).

Tensile membrane structure in the Olympia Park at Munich, Germany. (image by J. F. Valdés-Vázquez)
Once the geometry of the TFS is determined by form-finding, a structural analysis can be performed. It is not uncommon to find studies which use static loadings, deemed representative for design (e.g., Gosling et al., 2013aGosling, P.D., Bridgens, B.N., Albrecht, A., Alpermann, H., Angeleri, A., Barnes, M., Bartle, N., Canobbio, R., Dieringer, F., Gellin, S., Lewis, W.J., Mageau, N., Mahadevan, R., Marion, J.-M., Marsden, P., Milliganm, E., Phang, Y.P., Sahlin, K., Stimpfle, B., Suire, O., Uhlemann, J. (2013a). Analysis and design of membrane structures: Results of a round robin exercise, Engineering Structures 48: 313-328.; De Smedt et al., 2020De Smedt, E., Mollaert, M., Caspeele, R., Botte, W., Pyl, L. (2020). Reliability-based calibration of partial factors for the design of membrane structures, Engineering Structures 214: 110632.), for the analysis. However, fluid-structure interaction (FSI) is not as often reported as a tool to investigate the dynamic response of TFSs subjected to the action of wind, except in few studies (e.g., Xu et al., 2018Xu, Y., Zheng, Z., Liu, C., Wu, K., Song, W. (2018). Aerodynamic stability analysis of geometrically nonlinear orthotropic membrane structure with hyperbolic paraboloid in sag direction, Wind and Structures 26 (6): 355-367.). Recent studies also report results from wind tunnel tests and the reliability of TFSs (e.g., Colliers et al. 2020Colliers, J., Degroote, J., Mollaert, M., De Laet, L. (2020). Mean pressure coefficient distributions over hyperbolic paraboloid roof and canopy structures with different shape parameters in a uniform flow with very small turbulence. Engineering Structures 205 (2020): 110043.; De Smedt et al. 2020). However, the inclusion of realistic supporting arrangements and their wind response is not commonly reported.
To inspect the FSI response of TFSs, the finite element and computational mechanic formulations described in Valdés et al. (2009Valdés, J.G., Canet, J., Oñate, E. (2009). Nonlinear finite element analysis of orthotropic and prestressed membrane structures, Finite Elements in Analysis and Design 45 (6-7): 395-405.) and Valdés and Oñate (2009) are to be used in this study. Wind velocities along a range representative of engineering design are considered. TFSs exhibit a highly non-linear behavior when subjected to wind. Therefore, the use of sophisticated methodologies is warranted to adequately characterize the wind response of TFSs. Paradoxically, they are very common in practice, but wind tunnel tests or the use of CFD are sometimes not justified unless very large projects with important budgets are involved (e.g., Colliers et al. 2020Colliers, J., Degroote, J., Mollaert, M., De Laet, L. (2020). Mean pressure coefficient distributions over hyperbolic paraboloid roof and canopy structures with different shape parameters in a uniform flow with very small turbulence. Engineering Structures 205 (2020): 110043.). Therefore, developing pressure coefficients for design purposes, by considering different TFS geometries (e.g., double hypars), can be important as a guide for practical applications. Consequently, to evaluate how the stresses and reactions from complex (fluid-structure interaction) approaches and equivalent (or not equivalent but practical) static analyses differ is desirable, especially if realistic supporting conditions are used for the TFSs. This becomes even more relevant because of the fact that this kind of structures fail due to the effects of wind (Phys.org news, 2010), leading to economic losses and, potentially, to the loss of human life.
Therefore, the main objective of the present study is to evaluate the response of a double hypar TFS under varying wind speed by using fluid-structure interaction, including the consideration of realistic support arrangements and comparisons of results from dynamic analyses and simplified static analyses (with proposed pressure coefficients) as a guide for researchers, code developers and designers.
2 THEORETICAL BACKGROUND
2.1 Structure formulation
The concepts of the finite element method (FEM) to be used are described in this section. Vectors and tensors represented in a curvilinear coordinate system are the basis of the employed membrane theory. This is schematically shown in Figure 2, where Greek indices on the middle surface of the membrane can adopt values of 1 and 2 in a plane stress state in the Euclidean space. The position vector X on the membrane, in the reference configuration , is defined by
Likewise, the position vector x, in the current configuration , is defined by
After equations 1 and 2 are stated, the covariant base vectors on and can now be defined by
and
As regards the metric tensors, their covariant components are represented by
and
The previous definitions lead to the components of the Green-Lagrange strain tensor given by
By further considering adequate constitutive equations, the so-called second Piola-Kirchhoff components are determined. If equation (7) above is desired in variational form, the following expression can be used
where is the virtual strain tensor, and the following equality holds

In curvilinear coordinates, the virtual internal work is equivalent to the integral given below
If the continuum equations in a discretized fashion are preferred, the following expressions are useful
where the shape functions of the element are represented by , represents the nodal coordinate i for node I in the reference configuration (Belytschko et al., 2000Belytschko, T., Liu, W.K., Moran, B. (2000). Nonlinear Finite Elements for Continua and Structures, Wiley, U.S.A.), and the corresponding values of the current configuration are denoted by ; superscript h points out that the function is discretized. Additionally, the displacement can be approximated with
where represents the field of nodal displacements. If the reference configuration is considered, the covariant base vectors, equation (3), in discretized form are
As far as the current configuration is concerned, the defined covariant base vectors of the curvilinear coordinates, equation (4), can also be represented in their discretized format leading to
Similarly, if the variation of the covariant base vector in the current configuration is discretized, the following expression results
where the equality holds. Equation (9) can also be reformulated in a discretized fashion, equations (15) and (16) are used, resulting in
Plugging equation (17) in equation (8) the following expression is obtained
Additionally, the virtual internal work, equation (10) is
or in a tensorial format
where the internal forces in tensorial form (for a particular node I in the direction i) are given by
where the fourth-order strain-displacement tensor is represented by the following equality
and
The Voigt notation is used, which means that a matrix notation instead of a tensorial notation is considered. The dynamic equation can be solved, since the vectorial internal forces for the virtual internal work can be determined, leading to the following compact expression
where M is the mass matrix and a is the acceleration vector of the system and are the external forces. These external forces are the prestress forces and the wind loads, for the scope of the present study. Equation (24) represents the computational structural dynamics (CSD); the solutions of equation (24), implies the solution of the structural problem of interest. The concepts in this section are not thoroughly extended for brevity, but the interested reader can find all details in Valdés et al. (2009Valdés, J.G., Canet, J., Oñate, E. (2009). Nonlinear finite element analysis of orthotropic and prestressed membrane structures, Finite Elements in Analysis and Design 45 (6-7): 395-405.).
Nevertleless, it is noted that 3-node bidimensional finite elements are used for the membrane, for which numerical integration is not required, because explicit matrices can be obtained for this particular element (Valdés et al., 2009Valdés, J.G., Canet, J., Oñate, E. (2009). Nonlinear finite element analysis of orthotropic and prestressed membrane structures, Finite Elements in Analysis and Design 45 (6-7): 395-405.). The constitutive equation for this element is plane stress, so that the element is geometrically non-linear but with linear material behaviour. Regarding the masts and cables, 2-node unidimensional finite elements, with the conventional co-rotational formulation, are used. However, the elements differ for cables and masts, since for the former compressions are not allowed; because they are prestressed (i.e., the cables) the same finite element is used for the discretization. Like for the membrane, no numerical integration is required, since an explicit matrix can also be obtained for this element.
2.2 Fluid formulation
The fluid flow is modeled by establishing the formulation in terms of the framework of computational fluid dynamics (CFD). CFD encompasses computational methods that can be based on different assumptions; for instance, if the viscosity is zero, an inviscid fluid is envisaged. For an incompressible fluid, density variations with respect to a reference density are marginal. The assumption of disregarding temperature effects is not uncommon, implying that the energy equation is uncoupled and that only the continuity equation and the Navier-Stokes equation are to be solved.
When the Mach number, defined as Mach=/c (where c is the sound speed), meets Mach<0.3 (or <0.3c), a flow can be considered incompressible. Besides, if the fluid temperature change is not significant compared to a reference temperature, very adequate results are obtained, at least within the scope and application of structural engineering (but also in other areas). The previous formulation is essentially the adoption of the incompressibility condition (Finlay 2001Finlay, W.H. (2001) The Mechanics of Inhaled Pharmaceutical Aerosols. An Introduction, Academic Press.; Panton 2013Panton, R.L. (2013). Incompressible flow, Wiley, (U.S.A.).).
The weighted residual method for Navier-Stokes equations is given by
By stipulating the homogeneous no-slip Dirichlet boundary and integrating by parts, the continuum system to be solved for the Navier-Stokes equation is given by
By also stipulating the incompressible condition, the continuity equation multiplied by the test function , and once more integrating over the volume, leads to
Equation (27) is known as the weak form of the continuity equation, that corresponds to the continuity equation for non-compressible fluids. Test functions , the fluid density , the wind speed , the pressure , the dynamic viscosity and the body forces are included in the referred equations.
The velocities for the finite element discretization of the incompressible flow equations, known as virtual velocities, and also the test functions can be determined approximately by
where are the shape functions for the considered element, and are, respectively, the nodal values of the velocity field and the nodal virtual velocities field. The local or partial derivative corresponding to the material derivative of the velocity is
where is the nodal acceleration vector field. As far as the gradients of the velocity and gradients of the test functions are concerned, they can be represented in a discretized format by
Extending the idea to the divergence of the velocities and virtual velocities, the following expression can be used
Additionally, the pressure and its corresponding test function are given by the following expressions
The discretized equations given above can be plugged into equations (26)-(27), to determine the tensorial forms leading to
where the last two equations (i.e., equations (39) and (40)) can be used to obtain the convective and viscous term in K. If the Voigt notation is used again, previous equations can be represented in a compact format (matrix form) as
where, in matrix format, M and G are the mass and pressure gradient matrices respectively; K is the convective and viscous term matrix. The accelerations are denoted as a, the pressure and the fluid velocity are denoted by p and v, respectively. G T denotes the divergence matrix for the incompressibility condition.
Like in the structure formulation, the fluid formulation is not further detailed for brevity. The reader is also referred to Valdés-Vázquez (2007Valdés-Vázquez, J.G. (2007). Nonlinear analysis of orthotropic membrane and shell structures including fluid-structure interaction, Ph.D. Thesis, Barcelona Tech University, Spain.) for more information on the discretization, implementation, and validation of the fluid formulation. Nevertheless, it is noted that, as in Codina (2000Codina, R., Morton, C., Oñate, E., Soto, O. (2000). Numerical aerodynamic analysis of large buildings using a finite element model with application to a telescope building. International Journal of Numerical Methods for Heat & Fluid Flow 10 (6): 616-633.) and Oñate (2000Oñate, E. (2000). A stabilized finite element method for incompressible viscous flows using a finite increment calculus formulation, Computer Methods in Applied Mechanics and Engineering 182 (3-4): 355-370.), stabilized equal order interpolation finite elements are assumed to model the fluid, in order to avoid numerical problems. Also, note that according to Guasch and Codina (2013Guasch, O., Codina, R. (2013). Statistical behavior of the orthogonal subgrid scale stabilization terms in the finite element large eddy simulation of turbulent flows, Comput. Methods Appl. Mech. Engrg. 261-262: 154-166.), Colomés et al. (2015Colomés, O., Badia, S., Codina, R., Principe, J. (2015). Assessment of variational multiscale models for the large eddy simulation of turbulent incompressible flows. Computer Methods in Applied Mechanics and Engineering 285: 32-63.), and Colomés (2016), the dynamic orthogonal subscales (OSS) model (the one used in this study) is the best model for turbulent flows, for efficiency and robustness reasons, and allows equal order interpolation functions for pressure and velocity. It is finally noted that by uncoupling equations (41) and (42), the computational efficiency can be improved. Therefore, the fractional step method for the solution of the incompressible fluid problem (Codina 2001) is used in the present study. In the fractional step method first an auxiliary velocity is computed; then, can be used to obtain the pressure p; finally, and p are used to compute v. This is to be repeated for each time step for the whole time stipulated to perform the CFD. The fluid staggered procedure is associated with the numerical solution of the Navier-Stokes equations in the FEM formulation. The fractional step approach together with the OSS method, which results in additional stabilization with a fully implicit scheme of second order, are implemented in the algorithm used.
For the fluid formulation 8-node tridimensional brick-type finite elements are employed, and Gaussian quadrature with eight points is carried out. The constitutive equation is embedded in the Navier-Stokes equations. Numerical and stabilization details are given in Codina (2000Codina, R., Morton, C., Oñate, E., Soto, O. (2000). Numerical aerodynamic analysis of large buildings using a finite element model with application to a telescope building. International Journal of Numerical Methods for Heat & Fluid Flow 10 (6): 616-633. and 2001).
The used fluid formulation has been found adequate for engineering purposes (Codina et al., 2000Codina, R., Morton, C., Oñate, E., Soto, O. (2000). Numerical aerodynamic analysis of large buildings using a finite element model with application to a telescope building. International Journal of Numerical Methods for Heat & Fluid Flow 10 (6): 616-633.; Houzeaux and Codina, 2004Houzeaux, G., Codina, R. (2004). A finite element model for the simulation of lost foam casting. International Journal for Numerical Methods in Fluids 46: 203-226.; Badia and Codina, 2007Badia, S., Codina, R. (2007). On some fluid-structure iterative algorithms using pressure segregation methods. Application to aeroelasticity. International Journal for Numerical Methods in Engineering 72: 46-71.; Guasch and Codina, 2013Guasch, O., Codina, R. (2013). Statistical behavior of the orthogonal subgrid scale stabilization terms in the finite element large eddy simulation of turbulent flows, Comput. Methods Appl. Mech. Engrg. 261-262: 154-166.).
2.3 Fluid-structure interaction
Two techniques to carry out FSI are the monolithic and partitioned approaches. The monolithic methods use a single iteration loop for solving the discretized fluid-structure system and the mesh movement system, but it requires many nonlinear equations to be solved at the same time. The partitioned methods are based on sophisticated solvers for structural or fluid subsystems. They simplify the coupling procedure by using weak or loose coupling algorithms and strong or implicit coupling schemes. Weak algorithms are also known as staggered or explicit schemes.
The fluid is treated as an Euler fluid and the structure as a Lagrangian structure in this work. This implies that the fluid pressure forces are transferred to the structure at stipulated time steps; the structure is then analyzed in the stipulated time steps with the external pressure forces from the fluid solution. Alike in Hincz and Gamboa-Marrufo (2016Hincz, K., Gamboa-Marrufo, M. (2016). Deformed Shape Wind Analysis of Tensile Membrane Structures, Journal of Structural Engineering 142(3): 04015153-1 - 04015153-5.), structural displacements are not transferred back to the fluid for every next time step. When the pressure forces are already computed at a new time step, they are sent to the structure; this is repeated for the whole-time interval considered. This implies that the geometry of the fluid is kept constant for all the time interval and also implies that different external pressures are employed to analyzing the structure in each time step. Since it is also given that the mesh for the fluid is fixed, one non-linear analysis is carried out (not many simultaneously) at each time step.
Although this methodology is detailed in Valdés-Vázquez (2007Valdés-Vázquez, J.G. (2007). Nonlinear analysis of orthotropic membrane and shell structures including fluid-structure interaction, Ph.D. Thesis, Barcelona Tech University, Spain.), an outline for solving the partitioned fluid-structure interaction problem is given as:
-
For a stipulated inlet velocity, the CFD solver is employed for the fluid flow problem (i.e., to solve equations (41) and (42)).
-
The wind pressure solution of step 1 is sent, as an external pressure force, to the structural problem in the CSD solver.
-
Finally, the CSD solver is employed to determine displacements, stresses, forces and reactions for the non-linear dynamic structural problem (equation (24)).
This procedure is repeated for each time step, until the total considered time for the FSI problem of interest is covered. This one-way wind-structure interaction scheme is considered adequate for the scope of the present study (e.g., Colliers et al., 2020Colliers, J., Degroote, J., Mollaert, M., De Laet, L. (2020). Mean pressure coefficient distributions over hyperbolic paraboloid roof and canopy structures with different shape parameters in a uniform flow with very small turbulence. Engineering Structures 205 (2020): 110043.; Foster and Mollaert, 2004Foster, B., Mollaert, M. (Eds.) (2004) European Design Guide for Tensile Surface Structures, TensiNet Association.). Nevertheless, future research is recommended to inspect the impact of using a two-way scheme in the final results (e.g., Valdés-Vázquez, 2008Valdés-Vázquez, J.-G. (2008) Aeroelastic Analysis of Membrane Structures (in Spanish), XVI National Conference on Structural Engineering, Veracruz, México.).
It is emphasized that the problem being addressed is not linear, but a non-linear problem solved by means of the fractional steps method. This approach decouples the velocity and pressure terms so that smaller equation systems are to be solved, which is more computationally efficient.
3 GEOMETRY AND VIRTUAL WIND TUNNEL DEFINITION
The geometry of the double hypar considered is showed in Figure 3 (including cables in blue and masts in green). Before the geometry in Figure 3 is defined, the form-finding, that is referred to in the Introduction, should be performed. This is to be discussed later. In Figure 3, the global axes follow the rgb color convention (red for the X-axis, green for the Y-axis and blue for the Z-axis), where also the double hypar projections in the X-Y plane (including the union of the two squares with 8 m sides) are observed; the length of the major masts, H, is 6.5 m, while for the minor masts, h, is 4.5 m. Also, the distance from the masts base to the cables anchorage, b, is 3 m.
The tensors in Figure 3 are denoted in such a way that when Tensor X is projected in the X-Y plane, its non-zero component follows the X-axis, while for Tensor Y the same reasoning applies when projected in the Y-axis.

As a convention, the global X-axis coincides with the manufacture warp direction of the fabric; similarly, the global Y-axis coincides with the fill direction. A prestressed cable surrounds the membrane (showed with red lines in Figure 3). The fabric of the membrane is prestressed as well. The material properties of the supporting arrangement of the double hypar, consisting out of cables and masts as showed in Figure 3, are reported in Table 1, together with all other properties of the TFS. Table 1 includes Ew = Ef, which are the tensile stiffness for the warp and for the fill direction, respectively. Also, in Table 1, denotes the Poisson ratio, t the fabric thickness, the density, Esc the elastic modulus for the surrounding cable (which diameter is dsc), Em the elastic modulus for the mast (which cross section is Am), and Ec the elastic modulus for the frame cable (which diameter is dc). Properties listed in Table 1 differ from the ones used for the form-finding procedure as explained in the next section, but they are the properties used for the fluid-structure interaction analysis.
The shape parameter (SP) and the height to span ratio parameter (HS) are defined by the principal curvatures (Colliers et. al, 2020Colliers, J., Degroote, J., Mollaert, M., De Laet, L. (2020). Mean pressure coefficient distributions over hyperbolic paraboloid roof and canopy structures with different shape parameters in a uniform flow with very small turbulence. Engineering Structures 205 (2020): 110043.). Following Colliers et. al (2020), and considering half of the geometry, SP=0.177 and HS=0.397 are obtained for each individual hypar of the double one; SP and HS represent the sag to span ratio along the two principal curvatures.
As regards the pressure coefficients, Foster and Mollaert (2004Foster, B., Mollaert, M. (Eds.) (2004) European Design Guide for Tensile Surface Structures, TensiNet Association.) and Huntington (2010Huntington, C.G. (Ed.) (2010). Tensile Fabric Structures. Design, Analysis, and Construction, Task Committee on Tensioned Fabric Structures, (U.S.A.).) can be followed to determine Cp values (using a virtual wind tunnel with a CFD solver, in the case of this study). Nevertheless, the pressure coefficients given by Foster and Mollaert (2004) for TFSs, cannot be properly adapted to the double hypar used in this study. Thus, another alternative is followed and explained later.
3.1 Form-finding procedure
Several approaches have been developed to perform the form-finding, as the method of Frei Otto, which is based on experimental work carried out in the University of Stuttgart in the 1970’s. The force density method (Schek, 1974Schek, H.-J. (1974). The force density method for form finding and computation of general networks, Computer Methods in Applied Mechanics and Engineering 3 (1): 115-134.) is one of early form-finding approaches. A historical review can be found in Barnes (1999Barnes, M.R. (1999). Form Finding and Analysis of Tension Structures by Dynamic Relaxation. International Journal of Space Structures 14 (2): 89-104.), including the introduction of the dynamic relaxation method. In this study, the direct stiffness method or matrix stiffness method by Tabarrok and Qin, (1992Tabarrok, B., Qin, Z. (1992). Nonlinear analysis of tension structures, Computers & Structures 45 (5-6): 973-984.) is used. Different properties (as compared to those reported in Table 1) are used for the form-finding; they are listed in Table 2. Properties in Table 2 are unrealistic but adequate (an inconsequential at this stage; Tabarrok and Qin, 1992) to carry out the direct stiffness method for the form-finding. This allows the finding of the minimum surface (Bletzinger and Ramm, 1999Bletzinger, K.-U., Ramm, E. (1999). A general finite element approach to the form finding of tensile structures by the updated reference strategy. International Journal of Space Structures 14 (2): 131-145.; Huntington, 2010Huntington, C.G. (Ed.) (2010). Tensile Fabric Structures. Design, Analysis, and Construction, Task Committee on Tensioned Fabric Structures, (U.S.A.).). Material properties for the supporting arrangement are kept as in Table 1. The self-weight of the structure is added in this phase.
The geometry showed in Figure 3 was determined after applying the form-finding procedure. Likewise, the resulting deformed shape of the membrane fabric and surrounding cable is showed in Figure 4. The deformed structure in Figures 3 and 4 is the initial geometry to be used in the FSI analysis; it is shown in 3D in Figure 3, which includes the masts and tensors of the supporting arrangement. As mentioned before, the values in Table 1, and not the ones in Table 2, are used in the following.

3.2 Virtual wind tunnel
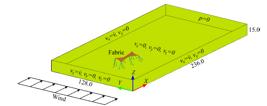
In order to model the wind action over the TFS, CFD is carried out by using a virtual (computational) wind tunnel as shown in Figure 5. The work by Behr et al. (1995Behr, M., Hastreiter, D., Mittal, S., Tezduyar, T. (1995). Incompressible flow past a circular cylinder: dependence of the computed flow field on the location of the lateral boundaries. Computer Methods in Applied Mechanics and Engineering 123: 309-316.) is the basis to establish the computational wind tunnel dimensions, as well as by adapting the work by Houzeaux and Principe (2008Houzeaux, G., Principe, J. (2008). A variational subgrid scale model for transient incompressible flows, International Journal of Computational Fluid Dynamics 22 (3): 135-152.) assuming the blocking of the solution when the surrounding walls are close to the structure.
As schematically depicted in Figure 5, the TFS is set 60 m away from the wind inlet. The assumption that the wind only interacts with the membrane fabric is stipulated. The wind flow follows the global X-axis for varying wind speed between 14 and 83 m/s (50 and 300 km/hr; 31 and 186 mph). For the problem in Figure 5, the following boundary conditions are stipulated: for the top face and ; for the fabric , and . The inlet for the wind flow is considered constant and with a wind speed equal to . This is based on the fact that the highest point of the fabric structure is 6.5 m, and codes for wind design normally adopt a constant wind speed for heights below 10 m.
A transient analysis for the CFD and also for the CSD solver is carried out for FSI with the previously mentioned data and conditions. An in-house program, which takes the COMET software (Cervera et al. 2002Cervera, M., Agelet-de-Saracibar, C., Chiumenti, M. (2002). COMET. Coupled Mechanical and Thermal Analysis - Data Input Manual. International Center for Numerical Methods in Engineering. Barcelona. Spain.) as a starting point to code the finite element formulations, is employed in this work. The formulation, discretization and implementation in COMET was thoroughly validated with experiments in problem examples of different type, both, theoretical and physical (Valdés-Vázquez, 2007Valdés-Vázquez, J.G. (2007). Nonlinear analysis of orthotropic membrane and shell structures including fluid-structure interaction, Ph.D. Thesis, Barcelona Tech University, Spain.).
4 DOUBLE HYPAR STATIC ANALYSIS
Besides the dynamic analyses, static analyses for the double hypar are also performed to inspect the results differences between dynamic and static analysis and to inspect the adequacy of the latter for design purposes. For the static analysis, pressure coefficients on the double hypar must be determined to compute the fluid force.
Pressure coefficients for single hypar structures are available in the literature (Colliers et al., 2020Colliers, J., Degroote, J., Mollaert, M., De Laet, L. (2020). Mean pressure coefficient distributions over hyperbolic paraboloid roof and canopy structures with different shape parameters in a uniform flow with very small turbulence. Engineering Structures 205 (2020): 110043.) for various SP and HS parameters. In their study, Colliers et al. (2020) report pressure coefficients for the upper and lower faces (and for the resultant of these opposite values); the adequacy of their pressure coefficients should be further investigated for their application in practical problems, because of the experimental limitations, especially for the supporting arrangement. Naturally, the pressure coefficients between a single and a double hypar may differ. In this study, we have obtained the pressure coefficients for the double hypar with parameters SP = 0.177 and HS = 0.397 (for each individual hypar); the resultants of the contribution of the upper and lower faces (from the FSI analysis) are shown in Figure 6 a).

Based on Cook (2005Cook, N.J. (2005). Wind Loading. A Practical Guide to Wind Loads on Buildings, Thomas Telford.) and Simiu and Yeo (2019Simiu, E., Yeo, D. (2019). Wind Effects on Structures. Modern Structural Design for Wind, Wiley, (U.S.A.).), mean values are used to establish constant pressure zones in different sections of the double hypar. This is convenient from a designer standpoint because the analysis of structures subjected to wind can be carried out in a conventional way, by using pressure coefficients as a mean to determine wind forces for design. This is shown in Figure 6 b), where 32 sections with the average values of the pressure coefficient in the middle are observed. These pressure coefficients, which are different for each part that the double hypar is formed of, can be used for guidance by designers and as a reference for research; therefore, they are considered as a contribution of this study. These pressure coefficients are to be used for the static analysis referred to later as equivalent static analysis. The coefficients in Figure 6 are to be used with equation (43), for each section in the double hypar, where =1.183 kg/m, are the pressure coefficients and is the wind speed (ranging from 14 to 83 m/s).
Additional information is showed in Table 3, where resulting static wind forces and stresses by using the in Figure 6 b), plus the prestressed values for the double hypar in Figure 3, are listed for six wind speeds and a selected point in the double hypar (for the fabric stresses) showed in Figure 7.
Before continuing, details of the spatial and time discretization are given ahead. Rigorously, a semidiscretization is employed since the time has not been discretized. In Fig. 7 c) a discretization for the structure is shown, whereas for the fluid its discretization at the interface coincides with the membrane nodes and it is extended to the whole domain shown in Fig. 5. For the fluid, a boundary layer is created. It is pointed out that the used OSS stabilization (Codina, 2000Codina, R., Morton, C., Oñate, E., Soto, O. (2000). Numerical aerodynamic analysis of large buildings using a finite element model with application to a telescope building. International Journal of Numerical Methods for Heat & Fluid Flow 10 (6): 616-633.) allows the fluid subscales to be solved. Also, the fluid dynamic problem is solved by means of an implicit-LES, which allows the use (at least in theory) of any time step. However, a too large time step will prevent capturing adequately the variations of the results as a function of time.
Figure 7 shows contours of the maximum stresses in the double hypar for the equivalent static and dynamic analysis (Figure 7 a) and 7 b), respectively). The red point in the mesh showed in Figure 7 c) is selected to compute the values listed in Table 3 for the fabric stresses because in this point larger stresses in the dynamic analysis were found. It is considered that the red point in Figure 7 c) presents the largest stress because the direction along which the wind hits the membrane causes an inflection point from the first single hypar to the second single hypar (of the two that the double hypar is consisted out).

If the permissible fabric stress of 10 kN/m (i.e., the ultimate stress scaled down by a large reduction factor) used by Gosling et al. (2013bGosling, P.D., Bridgens, B.N., Zhang, L. (2013b). Adoption of a reliability approach for membrane structure analysis, Structural Safety 40: 39-50.) is considered, it is found that the structure has enough strength to resist the applied forces, because the maximum obtained (equivalent static) stress in the double hypar is 7.01 kN/m. Comparisons for the supporting arrangement (i.e., for the masts and tensors) are normally not available in the literature. Figure 8 shows the vertical displacements of the structure under the action of wind for the static and dynamic cases.
As mentioned before, fluid-structure interaction analyses or wind tunnel tests (virtual or not) are not readily available for every TFS geometry. Also, they can be very costly (or complex, when not time demanding), especially for small TFS which project budgets are not large (Colliers et al., 2020Colliers, J., Degroote, J., Mollaert, M., De Laet, L. (2020). Mean pressure coefficient distributions over hyperbolic paraboloid roof and canopy structures with different shape parameters in a uniform flow with very small turbulence. Engineering Structures 205 (2020): 110043.). This is one of the reasons that may lead designers to adopt preestablished values of wind loads to design TFSs.

The assumption of wind loads under static conditions, considered representative for design purposes (but not equivalent loads since they are not derived from FSI for a specific TFS), can be used to compare the forces and stresses that they generate versus results obtained from a dynamic analysis (using fluid-structure interaction). To do this, the wind loads used by Gosling et al. (2013aGosling, P.D., Bridgens, B.N., Albrecht, A., Alpermann, H., Angeleri, A., Barnes, M., Bartle, N., Canobbio, R., Dieringer, F., Gellin, S., Lewis, W.J., Mageau, N., Mahadevan, R., Marion, J.-M., Marsden, P., Milliganm, E., Phang, Y.P., Sahlin, K., Stimpfle, B., Suire, O., Uhlemann, J. (2013a). Analysis and design of membrane structures: Results of a round robin exercise, Engineering Structures 48: 313-328.) for a double hypar are considered in this study; these loadings correspond to a uniform (uplift) wind load pressure of 1.0 kN/m2 normal to the surface and a uniform (downward) snow pressure of 0.6 kN/m2 following global Z-axis. Although snow design is normally used only in places where snow loading is common, it is considered here because it represents the effect of a static load acting in the opposite direction of the uplift wind, which cover both main directions for the fabric (i.e., it covers a more realistic scenario of stresses for practical cases). Moreover, snow and uplift wind loads have become very common in the literature to investigate stresses in TFSs, even for reliability issues (e.g., De Smedt et al. 2020De Smedt, E., Mollaert, M., Caspeele, R., Botte, W., Pyl, L. (2020). Reliability-based calibration of partial factors for the design of membrane structures, Engineering Structures 214: 110632.). Therefore, snow loading is also included in the comparison reported herein. Even for this simplified load cases, it is not common to find realistic support conditions to inspect the axial forces in inclined tensors and masts (e.g., Gosling et al., 2013a; De Smedt et al., 2020; Colliers et al., 2020Colliers, J., Degroote, J., Mollaert, M., De Laet, L. (2020). Mean pressure coefficient distributions over hyperbolic paraboloid roof and canopy structures with different shape parameters in a uniform flow with very small turbulence. Engineering Structures 205 (2020): 110043.). Therefore, the fact that the double hypar in this study includes a realistic supporting arrangement, with masts and inclined tensors, is one of the contributions of the present study, especially to inspect differences in terms of forces and stresses for each part of the double hypar, because the behaviour is not only not symmetrical but also differs if uniform simplified loadings are used.
The loading cases used in Gosling et al. (2013aGosling, P.D., Bridgens, B.N., Albrecht, A., Alpermann, H., Angeleri, A., Barnes, M., Bartle, N., Canobbio, R., Dieringer, F., Gellin, S., Lewis, W.J., Mageau, N., Mahadevan, R., Marion, J.-M., Marsden, P., Milliganm, E., Phang, Y.P., Sahlin, K., Stimpfle, B., Suire, O., Uhlemann, J. (2013a). Analysis and design of membrane structures: Results of a round robin exercise, Engineering Structures 48: 313-328.), and used for the double hypar in Figure 3, are reported in Table 4; they are: Prestressed, Load Case 1 (termed as LC1); Prestressed + Uplift Wind, Load Case 2 (termed as LC2); Prestressed + Snow, Load Case 3 (termed as LC3). Additionally, Table 4 lists also the stresses for the same point in the mesh shown in Figure 7 c) (red point), together with the norm of the axial load for masts and tensors.
These results using the non-equivalent pressure coefficients (Table 4, non-equivalent because they are not based on pressure coefficients obtained from a FSI analysis for the TFS of interest) indicate that the membrane stresses are up to 5.10 times larger than those from the static analysis using equivalent pressure coefficients (equivalent because they are based on pressure coefficients derived from FSI, Figure 6). For the case of the mast, the axial force is 1.85 times larger, while for cables in the X direction the difference is 1.82 times larger, and it is twice larger for the cable in the Y direction, all cases in relation to the values from the equivalent pressure coefficients. This means that the use of practical considerations of uplift and snow loadings (i.e., non-equivalent static cases) lead to unrealistic (too conservative) values for design. Therefore, the pressure coefficients reported in this study can be an aid for code developers and designers.
In the following sections (Sections 5 and 6) the results from the dynamic FSI analyses are directly compared versus the equivalent and not equivalent static analyses, respectively.
5 DYNAMIC ANALYSIS VERSUS EQUIVALENT STATIC ANALYSIS FOR THE DOUBLE HYPAR
Results from the FSI dynamic analysis and wind static analysis using pressure coefficients (derived from the FSI analysis as reported in Figure 6 and termed as equivalent static analysis) are compared later in this section. First, the initial geometry by form-finding, including the prestressed forces in the cables and membrane, must be defined. This was performed and described earlier. After the form-finding, this initial geometry is taken as starting point for the analysis. In the first second the prestress loads and self-weight are applied, time after which the fluid-structure interaction is started. From time 1.0 s to time 2.0 s wind pressures are steadily applied to the structure in an increasing and, this time, dynamical way. After time 2.0 s the full pressure from the fluid analysis is added and is kept so up to time 4.0 s. In this process, the considered time step is 0.0025 s.
The red point depicted in the finite element mesh of Figure 7 c) is used once more for the comparison in Figure 9, where the principal stresses in the membrane are depicted.
A comparison between the equivalent static analyses and FSI analyses is performed for the structure showed in Figure 3. This approach is normally not followed for practical purposes, because it would require the pressure coefficients to be obtained from the FSI analyses. This procedure would make no sense, because the fluid-interaction analysis is enough to determine (more accurately) the stresses and forces in the TFS, without the need of a second static analysis with realistic equivalent pressure coefficients (i.e., no designer would waste the time in a less accurate analysis if a more complex one was already performed). However, for research purposes it is useful to inspect whether differences exist between the simplified equivalent static analysis and the fluid-structure interaction analysis. It also will be a guide for possible proposals of realistic pressure coefficients to designing double hypar TFSs (or perhaps other TFSs). The dynamic analysis results by using FSI are listed in Table 5. They will be shown in Figures 9 to 12 and discussed in more detail.
Figure 9 shows the comparison of the results from the FSI analysis for different wind velocities against those from the static equivalent analysis (dashed lines) using the pressure coefficients presented before (i.e., coefficients in Figure 6 b)). Figure 9 shows that the stresses from the dynamic case are always larger, ranging from 9.1% to 17.3%, for wind speed varied between 14 m/s and 83 m/s, respectively.

Double hypar fabric stresses for different wind speeds. Dashed lines represent equivalent static values
Figure 10 is analogous to Figure 9 and compares results of the FSI and static equivalent analyses, but this time for the compressive forces in the mast; it can be observed that the dynamic analysis leads to larger values than the equivalent static analysis, where the largest difference is 10.5% for a wind speed of 83 m/s. There is a trend indicating that larger wind velocities lead to larger differences (in percentage) between the static and dynamic analyses.

Mast forces for the double hypar under different wind speeds. Dashed lines represent equivalent static values
A couple more of figures, Figures 11 and 12, compare also the FSI analysis versus the equivalent static analysis, but for the forces in tensors X and Y, respectively. Similar trends are found, except by the cases of a wind speed of 14 m/s and 28 m/s where the equivalent static case is marginally, 0.80%, bigger than for the FSI dynamic case for tensor X. In all the other cases, tensor X exhibit larger values for the FSI dynamic analysis, with increasing differences for increasing wind speed, reaching up to 8% for a wind speed of 83 m/s.
In the case of tensor Y, the FSI dynamic response is larger and with a difference of up to 33.5% for a wind speed of 69 m/s, compared to the equivalent static analysis.

Double hypar Tensor X forces for different wind speeds. Dashed lines represent equivalent static values
The elements in tension tend to be the ones with larger differences for the FSI dynamic analysis compared to the equivalent static analysis. Nevertheless, for the compressive forces in the mast and stresses in the fabric, larger values are also obtained for the dynamic analysis with the FSI procedure.

Double hypar Tensor Y Stresses for different wind speeds. Dashed lines represent equivalent static values
In the following section the comparisons between FSI analysis and non-equivalent static analysis (i.e., loadings found in the literature and deemed representative for practical design) are presented.
6 DYNAMIC ANALYSIS VERSUS NON-EQUIVALENT STATIC ANALYSIS FOR THE DOUBLE HYPAR
In this section a comparison is also carried out, but this time comparing the FSI dynamic analysis versus the static, non-equivalent, analysis. This means that the typical pressure coefficients for uplift wind and snow loads found in the literature are considered instead of the more realistic coefficients used in the previous section. The stresses from non-equivalent static snow and uplift wind loadings can be considered as an approach to dimension the hanging direction and arching direction (De Smedt et al., 2020De Smedt, E., Mollaert, M., Caspeele, R., Botte, W., Pyl, L. (2020). Reliability-based calibration of partial factors for the design of membrane structures, Engineering Structures 214: 110632.). The comparisons shown in this section are, in a broad sense, those of a sophisticated dynamic FSI analysis versus those potentially determined by a practicing engineer. For the comparison, the LC1, LC2 and LC3 load cases referred to earlier are also used here.

Double hypar membrane principal stresses. Dashed lines represent non-equivalent static values
In Figure 13 the values of principal stresses in the fabric (once more for the red point in Figure 7 c)) are showed. Figure 13 shows that the maximum values for LC2 and LC3 are 35.74 kN/m and 1.34 kN/m, respectively. LC2 results in a stress 4.2 times larger than that from the FSI analysis for a wind speed of 83 m/s. This indicates two issues: one is that the obtained results through the simplified (non-equivalent) static analysis leads to much larger values than the realistic ones computed with FSI; the other one is that for the dynamic FSI the increment between the prestressing force value and the value for a wind velocity 83 m/s is not very significant, since the geometry of the double hypar leads to not so importantly different stresses between the highest and the lowest points in the fabric.
Therefore, a membrane designed as per non-equivalent static loading cases, which may be a possible alternative selected by a designer, would result in a safe, but extremely overconservative, design. Let now inspect the comparison for the supporting arrangement elements.
Figure 14 shows the maximum compressive force at one of the masts for LC3, resulting in a value of 174.0 kN; this is significantly larger than the maximum compressive force from the FSI analysis and a 83 m/s wind velocity (resulting in a compressive force of 105.15 kN). This represents a 65% larger compressive force for the mast if a simplified non-equivalent static analysis is carried out. It is evident that this would have an economic impact in designing (and ultimately building) double hypars, and other TFSs, if one or another alternative is followed. This is especially critical for the elements of the supporting arrangement.


Tensor-X axial force for double hypar. Dashed lines represent non-equivalent static values
A final comparison is showed in Figures 15 and 16, where it is observed that the behavior of tensors X and Y do not differ importantly. For tensors X and Y, LC2 leads to a tensile load of 123 kN and 39 kN, respectively. For LC3 the tensile forces are 53.6 kN and 77.37 kN, for tensors X and Y, respectively. This represents overestimations of 66% and 40% when using the non-equivalent static analysis.

Tensor-Y axial force for double hypar. Dashed lines represent non-equivalent static values
Therefore, performing fluid-structure interaction analysis for TFS, is desirable, or at least to proposed pressure coefficients based on realistic FSI analysis for a wide variety of TFSs should be recommended. This is especially relevant if it is considered that TFSs are widely used in the construction industry nowadays.
Broadly speaking, the comparisons show that static uplift wind and snow loadings cases cover, with an overconservative safety and possibly at an importantly higher cost, the more realistic stresses and axial loads obtained though FSI dynamic analysis. Also, the results of a non-equivalent static case deviate at a large degree with respect to those from the equivalent static analysis, which on the other hand exhibits a closer trend in the results to those from the FSI analysis. Therefore, equivalent pressure coefficients derived from FSI analyses are preferred, as compared to simplified loading cases independent of the wind velocity. Consequetly, extensive research on different TFSs geometries is desirable to establish more realistic simplified static analysis for design.
6 CONCLUSIONS
Fluid-structure interaction (FSI) analysis of a double hypar is presented by varying the wind velocity. Form-finding is used to determine the tensile fabric structure (TFS) geometry. After that, wind velocities are varied to perform CFD on the double hypar. The supporting arrangement of the double hypar is realistic, which is not commonly found in the literature. Comparison of results between the FSI analysis and static analysis are presented, considering not only pressure coefficients determined from the dynamic analysis but also loading cases deemed representative for design. Comparisons are reported for the stress in the fabric, the compressive force in the masts and the tensile force in the cables.
These computed pressure coefficients, which are different for each of the single hypars that the double hypar consists out of, can be an aid for practicing engineers, when the TFS is small and wind tunnel tests of sophisticated analysis are not justified in terms of costs and time. This is a contribution of this study. This is more relevant when considering that the double hypar includes a realistic supporting arrangement of inclined tensors and masts, and differences in terms of tensile and compressive forces in the supporting elements for each part of the double hypar are found.
It is found that the static analysis using equivalent pressure coefficients derived from the FSI analysis led to different results, but the trends are not very different, and the differences are quantified, being up to 17% for the maximum stress in the fabric, up to 10% for the compressive force in the mast and up to 33% for the tensile force in the inclined tensors.
It is found that the membrane stresses are up to 4.2 times larger (approx. 322%), than those from a static analysis, considering non-equivalent loading cases found in the literature (and so also significantly different compared to those from a FSI analysis). Similarly, axial forces can be 2 times larger if non-equivalent static analysis are used instead of a FSI analysis. This implies too conservative values for design that would increase the construction costs of a double hypar or other TFSs. It is concluded that the pressure coefficients reported in this study can be an aid for code developers and designers for more realistic designs.
Since TFSs fail under the action of wind loading, since a wide variety of geometries exist and since sophisticated designs using wind tunnel tests or CFD are normally only feasible for large projects, it is concluded that the methodology, derived static pressure coefficients and results in this study, can be a guide for researchers, code developers and practicing engineers who deal with TFSs. The procedure presented in this work can be extended to other TFS geometries, materials (isotropic or orthotropic), prestress conditions (also for isotropic or orthotropic cases) and can include static or transient dynamic analyses, which is recommended for future research.
Acknowledgments
We are grateful to Universidad de Guanajuato for its financial support and to the International Centre for Numerical Methods in Engineering (CIMNE) for providing us with the pre- and post-processor GiD (2020) in our CIMNE-Classroom at the Civil Engineering Department. We are also thankful to an anonymous reviewer for the comments and suggestions that helped to improve this study.
References
- Asadi, H., Hariri-Ardebili, M. A., Mirtaheri, M., Zandi, A.P. (2018). Force density ratios of flexible borders to membrane in tension fabric structures. Structural Engineering and Mechanics 67 (6): 555-563.
- Badia, S., Codina, R. (2007). On some fluid-structure iterative algorithms using pressure segregation methods. Application to aeroelasticity. International Journal for Numerical Methods in Engineering 72: 46-71.
- Barnes, M.R. (1999). Form Finding and Analysis of Tension Structures by Dynamic Relaxation. International Journal of Space Structures 14 (2): 89-104.
- Behr, M., Hastreiter, D., Mittal, S., Tezduyar, T. (1995). Incompressible flow past a circular cylinder: dependence of the computed flow field on the location of the lateral boundaries. Computer Methods in Applied Mechanics and Engineering 123: 309-316.
- Belytschko, T., Liu, W.K., Moran, B. (2000). Nonlinear Finite Elements for Continua and Structures, Wiley, U.S.A.
- Bletzinger, K.-U., Ramm, E. (1999). A general finite element approach to the form finding of tensile structures by the updated reference strategy. International Journal of Space Structures 14 (2): 131-145.
- Cervera, M., Agelet-de-Saracibar, C., Chiumenti, M. (2002). COMET. Coupled Mechanical and Thermal Analysis - Data Input Manual. International Center for Numerical Methods in Engineering. Barcelona. Spain.
- Codina, R. (2000). Stabilization of incompressibility and convection through orthogonal sub-scales in finite element methods. Computer Methods in Applied Mechanics and Engineering 190 (13-14): 1579-1599.
- Codina, R., Morton, C., Oñate, E., Soto, O. (2000). Numerical aerodynamic analysis of large buildings using a finite element model with application to a telescope building. International Journal of Numerical Methods for Heat & Fluid Flow 10 (6): 616-633.
- Codina, R. (2001). Pressure Stability in Fractional Step Finite Element Methods for Incompressible Flows. Journal of Computational Physics 170 (1): 112-140.
- Colliers, J., Degroote, J., Mollaert, M., De Laet, L. (2020). Mean pressure coefficient distributions over hyperbolic paraboloid roof and canopy structures with different shape parameters in a uniform flow with very small turbulence. Engineering Structures 205 (2020): 110043.
- Colomés, O., Badia, S., Codina, R., Principe, J. (2015). Assessment of variational multiscale models for the large eddy simulation of turbulent incompressible flows. Computer Methods in Applied Mechanics and Engineering 285: 32-63.
- Colomés, O. (2016). Large scale Finite Element solvers for the large eddy simulation of incompressible turbulent flows, Ph.D. Thesis, Barcelona Tech University, Spain.
- Cook, N.J. (2005). Wind Loading. A Practical Guide to Wind Loads on Buildings, Thomas Telford.
- De Smedt, E., Mollaert, M., Caspeele, R., Botte, W., Pyl, L. (2020). Reliability-based calibration of partial factors for the design of membrane structures, Engineering Structures 214: 110632.
- Finlay, W.H. (2001) The Mechanics of Inhaled Pharmaceutical Aerosols. An Introduction, Academic Press.
- Foster, B., Mollaert, M. (Eds.) (2004) European Design Guide for Tensile Surface Structures, TensiNet Association.
- GiD (2020) The personal pre- and post-processor. CIMNE, www.gidhome.com, 15th edition.
» www.gidhome.com - Guasch, O., Codina, R. (2013). Statistical behavior of the orthogonal subgrid scale stabilization terms in the finite element large eddy simulation of turbulent flows, Comput. Methods Appl. Mech. Engrg. 261-262: 154-166.
- Gosling, P.D., Bridgens, B.N., Albrecht, A., Alpermann, H., Angeleri, A., Barnes, M., Bartle, N., Canobbio, R., Dieringer, F., Gellin, S., Lewis, W.J., Mageau, N., Mahadevan, R., Marion, J.-M., Marsden, P., Milliganm, E., Phang, Y.P., Sahlin, K., Stimpfle, B., Suire, O., Uhlemann, J. (2013a). Analysis and design of membrane structures: Results of a round robin exercise, Engineering Structures 48: 313-328.
- Gosling, P.D., Bridgens, B.N., Zhang, L. (2013b). Adoption of a reliability approach for membrane structure analysis, Structural Safety 40: 39-50.
- Hincz, K., Gamboa-Marrufo, M. (2016). Deformed Shape Wind Analysis of Tensile Membrane Structures, Journal of Structural Engineering 142(3): 04015153-1 - 04015153-5.
- Houzeaux, G., Codina, R. (2004). A finite element model for the simulation of lost foam casting. International Journal for Numerical Methods in Fluids 46: 203-226.
- Houzeaux, G., Principe, J. (2008). A variational subgrid scale model for transient incompressible flows, International Journal of Computational Fluid Dynamics 22 (3): 135-152.
- Huntington, C.G. (Ed.) (2010). Tensile Fabric Structures. Design, Analysis, and Construction, Task Committee on Tensioned Fabric Structures, (U.S.A.).
- Labbafi, S.F., Sarafrazi, S.R., Kang, T.H.K. (2017a). Comparison of viscous and kinetic dynamic relaxation methods in form-finding of membrane structures, Advances in Computational Design 2 (1): 71-87.
- Labbafi, S.F., Sarafrazi, S.R., Gholami, H., Kang, T.H.K. (2017b). A novel approach to the form-finding of membrane structures using dynamic relaxation method, Advances in Computational Design 2 (3): 123-141.
- Oñate, E. (2000). A stabilized finite element method for incompressible viscous flows using a finite increment calculus formulation, Computer Methods in Applied Mechanics and Engineering 182 (3-4): 355-370.
- Panton, R.L. (2013). Incompressible flow, Wiley, (U.S.A.).
- Phys.org news (2010). NIST releases final report on Cowboys facility collapse, https://phys.org/news/2010-01-nist-cowboys-facility-collapse.html (last accessed December 1st,2020).
» https://phys.org/news/2010-01-nist-cowboys-facility-collapse.html - Schek, H.-J. (1974). The force density method for form finding and computation of general networks, Computer Methods in Applied Mechanics and Engineering 3 (1): 115-134.
- Simiu, E., Yeo, D. (2019). Wind Effects on Structures. Modern Structural Design for Wind, Wiley, (U.S.A.).
- Tabarrok, B., Qin, Z. (1992). Nonlinear analysis of tension structures, Computers & Structures 45 (5-6): 973-984.
- Valdés-Vázquez, J.G. (2007). Nonlinear analysis of orthotropic membrane and shell structures including fluid-structure interaction, Ph.D. Thesis, Barcelona Tech University, Spain.
- Valdés-Vázquez, J.-G. (2008) Aeroelastic Analysis of Membrane Structures (in Spanish), XVI National Conference on Structural Engineering, Veracruz, México.
- Valdés, J.G., Oñate, E. (2009). Orthotropic rotation-free basic thin shell triangle, Computational Mechanics 44 (3): 363-375.
- Valdés, J.G., Canet, J., Oñate, E. (2009). Nonlinear finite element analysis of orthotropic and prestressed membrane structures, Finite Elements in Analysis and Design 45 (6-7): 395-405.
- Valdés-Vázquez, J.G., García-Soto, A.D., Hernández-Martínez, A. (2019). Dynamic Analysis of Hypar Membrane Structures Subjected to Seismic Excitations, Rev. int. métodos numér. cálc. diseño ing. 35 (1): 1-11.
- Xu, Y., Zheng, Z., Liu, C., Wu, K., Song, W. (2018). Aerodynamic stability analysis of geometrically nonlinear orthotropic membrane structure with hyperbolic paraboloid in sag direction, Wind and Structures 26 (6): 355-367.
Edited by
Editor:
Publication Dates
-
Publication in this collection
03 May 2021 -
Date of issue
2021
History
-
Received
18 Dec 2020 -
Reviewed
27 Jan 2021 -
Accepted
01 Mar 2021 -
Published
03 Mar 2021


