
Abstract
In this study, we investigated the preconsolidation pressure (P C) of sedimentary soft rock and its relationship with brittle-ductile transition (BDT) pressure. We proposed a generalized preconsolidation pressure (P G) suitable for both soil and sedimentary soft rock, which is defined in terms of the yield stress of the initial sediment structure under confined lateral compression. We then explored the digenetic effect on P G using 24 sediment types. Next, P G and BDT pressure were verified using confined compression and conventional triaxial tests, respectively, on red-bed soft rock in the Dingxi region of China. Finally, we discussed the BDT mechanism and analyzed the relationship between the two characteristic pressures for a given initial yield surface considered structural strength. We found that the relationship was dependent on the strength parameters, the initial structural strength, and the coefficient of earth pressure at rest. The findings of this study will have a significant impact on the determination of BDT pressure of sedimentary rock in future studies.
Keywords:
Brittle-ductile transition pressure; generalized preconsolidation pressure; sedimentary soft rock; initial yield surface; coefficient of earth pressure at rest

1 INTRODUCTION
Preconsolidation pressure (P C) is an important mechanical parameter of soil that reflects the initial stress state and stress history of sediments. The pressure has a significant influence on the excavation and support of underground engineering (Demers & Leroueil 2002Demers, D., & Leroueil, S. (2002). Evaluation of Preconsolidation Pressure and the Overconsolidation Ratio from Piezocone Tests of Clay Deposits in Quebec. Canadian Geotechnical Journal, 39, 174-192.; Pavel 2011Pavel, K. (2011). Preconsolidation, Structural Strength of Soil, and its Effect on Subsoil Upper Structure Interaction. Engineering Structures, 33, 1195-1204.). P C is generally defined as the greatest vertical effective stress to which the sediment has been subjected in its geological history (Casagrande 1936Casagrande, A. (1936). The Determination of the Preconsolidation Load and Its Practical Significance. In Proceedings of the 1st International Conference on Soil Mechanics and Foundation Engineering, Cambridge, Mass. Vol. 3, pp. 60-64.; Umar & Sadrekarimi 2017Umar, M., & Sadrekarimi, A. (2017). Accuracy of Determining Pre-consolidation Pressure from Laboratory Tests. Canadian Geotechnical Journal, 54, 441-450.). However, a soil may show a P C much greater than the existing effective stress without obvious erosion in its geological history (Cotecchia & Chandler 1997Cotecchia, F., & Chandler, R.J. (1997). The Influence of Structure on the Pre-failure Behaviour of a Natural Clay. Géotechnique, 47, 523-544.), or the pressure may decrease with increased soil depth (Liao et al. 2006Liao, Y.L., Bi, Q.T., Xi, X.W., & Zhao, K. (2006). On Preconsolidation Pressure of Red Clay. Rock & Soil Mechanic, 27, 1391-1394. (In Chinese).). This phenomenon has been attributed to bonding due to long-term secondary compression, ageing, and other diagenetic factors (Bjerrum 1967Bjerrum L. (1967). Engineering Geology of Norwegian Normally-consolidated Marine Clays as Related to Settlements of Buildings. Géotechnique, 17, 81-118.; Sridharan et al. 1991Sridharan, A., Abraham, B.M., & Jose, B.T. (1991). Improved Technique for Estimation of Preconsolidation Pressure. Geotechnique, 41, 263-268.). Therefore, several other terms have been used instead of P C, such as yield stress (Mu et al. 2020Mu, Q.Y., Zhou, C., & Ng, C.W.W. (2020). Compression and Wetting Induced Volumetric Behavior of Loess: Micro- and Macro-investigations. Transportation Geotechnics, 23(100345), 1-8.), consolidation yield stress (Hong & Tsuchida 1999Hong, Z., & Tsuchida, T. (1999). On Compression Characteristics of Ariake Clays. Canadian Geotechnical Journal, 36, 807-814.), gross yielding stress (Jiang et al. 2007Jiang, M.J., Yu, H.S., & Leroueil, S. (2007). A Simple and Efficient Approach to Capturing Bonding Effect in Naturally Microstructured Sands by Discrete Element Method. International Journal for Numerical Methods in Engineering, 69, 1158-1193.), quasi-preconsolidation pressure (Ma et al. 2014Ma, B., Muhunthan, B., & Xie, X. (2014). Mechanisms of Quasi-preconsolidation Stress Development in Clays: A Rheological Model. Soils & Foundations, 54, 439-450.), and so on. For sedimentary rocks, a characteristic stress called apparent preconsolidation pressure has also been obtained by the method used to determine the P C of soil (Nygard et al. 2004Nygard, R., Gutierrez, M., Gautam, R., & Høeg, K. (2004). Compaction Behavior of Argillaceous Sediments as Function of Diagenesis. Marine & Petroleum Geology, 21, 349-362.; Gutierrez et al. 2008Gutierrez, M., Nygard, R., Høeg, K., & Berre, T. (2008). Normalized Undrained Shear Strength of Clay Shales. Engineering Geology, 99, 31-39.; Smith et al. 2017Smith, L., Barbour, S.L., Hendry, M.J., & Elwood, D. (2017). Profiling the in Situ Compressibility of Cretaceous Shale Using Grouted-in Piezometers and Laboratory Testing. Geomechanics for Energy & the Environment, 14, 29-37.; Yuan et al. 2017Yuan, Y.S., Jin, Z.J., Zhou, Y., Liu, J.X., Li, S.J., & Liu, Q.Y. (2017). Burial Depth Interval of the Shale Brittle-ductile Transition Zone and Its Implications in Shale Gas Exploration and Production. Petroleum Science, 14, 637-647.; Liu et al. 2018Liu, J.X., Xiao, F., Liu, W., Gan, J.J., Huo, L. & Mao, H.J. (2018). Investigation on the Experimental Determination of the Apparent Preconsolidation Stress and Effective-sealing Condition for Clay Cap Rock. Arabian Journal of Geosciences, 11, 491-506.). However, the physical meaning of apparent preconsolidation pressure, which is typically determined empirically, remains poorly understood. The concept of P C as it pertains to soil was applied directly to rock in previous studies (Akai et al. 1974Akai, K., Adachi, T., & Tabushi, N. (1974). Mechanical Properties of Soft Rock in Terms of Effective Stress. Journal of the Society of Materials Science Japan, 23, 368-373.; Powell et al. 2012), due to the lack of a systematic concept of P C for sedimentary rock. Therefore, studies are urgently needed to form a generalized P C concept for soil and sedimentary rock.
Both strain softening of over-consolidated (OC) soil, whose P C is greater than the current effective stress, and strain hardening of normally consolidated (NC) soil, whose P C is equal to the current effective stress, are well-understood soil mechanical behaviors (Tavenas et al. 1978Tavenas, F., Blanchet, R., Garneau, R., & Leroueil, S. (1978). The Stability of Stage-constructed Embankments on Soft Clays. Canadian Geotechnical Journal, 15, 283-305.). For sedimentary rocks, the behavior changes from strain softening (brittle mode) to strain hardening (ductile mode) with the increase in confining pressure. The critical confining pressure, termed brittle-ductile transition (BDT) pressure, is related to the physical and mechanical characteristics of the rock. The pressure has been used as a significant indicator for deep resource exploitation and utilization (Rutter 1986Rutter, E.H. (1986). On the Nomenclature of Mode of Failure Transitions in Rocks. Tectonophysics, 122, 381-387.; Yang & Andrew 1998Yang, Y.L., & Andrew, A.C. (1998). Influence of Lithology and Compaction on the Pore Size Distribution and Modelled Permeability of Some Mudstones from the Norwegian Margin. Marine & Petroleum Geology, 15, 163-175.; Wong & Baud 2012Wong, T.F., & Baud, P. (2012). The Brittle-ductile Transition in Porous Rock: A Review. Journal of Structural Geology, 44, 25-53.; Hu et al. 2014Hu, D., Zhang, H., Ni, K., & Yu, G. (2014). Preservation Conditions for Marine Shale Gas at the Southeastern Margin of the Sichuan Basin and Their Controlling Factors. Natural Gas Industry B, 1, 178-184.; Walton et al. 2017Walton, G., Hedayat, A., Kim, E., & Labrie, D. (2017). Post-yield Strength and Dilatancy Evolution Across the Brittle-ductile Transition in Indiana Limestone. Rock Mechanics & Rock Engineering, 50, 1691-1710.). Based on the strain softening and strain hardening behavior of OC and NC soils, Nygard et al. (2004Nygard, R., Gutierrez, M., Gautam, R., & Høeg, K. (2004). Compaction Behavior of Argillaceous Sediments as Function of Diagenesis. Marine & Petroleum Geology, 21, 349-362.; 2006) and Gutierrez et al. (2008Gutierrez, M., Nygard, R., Høeg, K., & Berre, T. (2008). Normalized Undrained Shear Strength of Clay Shales. Engineering Geology, 99, 31-39.) first determined in laboratory studies that the value of BDT pressure is close to that of apparent P C. These findings were later applied to evaluate the sealing characteristics of cap rocks (Liu et al. 2018Liu, J.X., Xiao, F., Liu, W., Gan, J.J., Huo, L. & Mao, H.J. (2018). Investigation on the Experimental Determination of the Apparent Preconsolidation Stress and Effective-sealing Condition for Clay Cap Rock. Arabian Journal of Geosciences, 11, 491-506.), and the exploration and production of shale gas (Yuan et al. 2017Yuan, Y.S., Jin, Z.J., Zhou, Y., Liu, J.X., Li, S.J., & Liu, Q.Y. (2017). Burial Depth Interval of the Shale Brittle-ductile Transition Zone and Its Implications in Shale Gas Exploration and Production. Petroleum Science, 14, 637-647.), with satisfactory results. However, to date, the relationship between apparent P C and BDT pressure in sedimentary soft rock has not been studied theoretically.
The main objectives of this study were to 1) investigate the P C of sedimentary soft rock, 2) propose a generalized concept of P C (P G) valid for both soil and sedimentary rock, and 3) explore the relationship between the P G and BDT pressure of sedimentary soft rock.
2 GENERALIZED PRECONSOLIDATION PRESSURE
2.1 Traditional P C
During the deposition process, soil forms an initial structure with a given strength after mechanical compaction. After the erosion of overlaying sediments, the strength of the soil mass is maintained. When an external load is less than P C, which is equal to the greatest vertical effective stress, the initial microstructure remains unchanged, and the soil has low elastic deformation. When the load is greater than P C, the initial fabric of the soil changes, and plastic deformation occurs. Thus, P C is essentially the confined compressive yield stress of the initial structure, formed only by mechanical compaction (Hong & Tsuchida 1999Hong, Z., & Tsuchida, T. (1999). On Compression Characteristics of Ariake Clays. Canadian Geotechnical Journal, 36, 807-814.; Boone 2010Boone, S.J. (2010). A Critical Reappraisal of “Preconsolidation Pressure” Interpretations Using the Oedometer Test. Canadian Geotechnical Journal, 47, 281-296.).
For a soil element (Figure 1), only vertical deformation occurs, and no lateral deformation exists; that is, lateral strain and vertical strain . A natural stratum can be assumed to be a semi-infinite space body. Therefore, laboratory analyses always use a confined compression (K0) test to study the actual compressive property of soil in the field. For an element of soil, the total vertical stress and hydrostatic pressure can be expressed as
and
respectively, where is the natural weight function of soil depth, is the water unit weight, h s is the sampling depth, and h w is the phreatic line depth. The vertical effective stress of a soil element is calculated as:
where σ is the total stress, u a is pore air pressure, andis the effective stress coefficient.

2.2 Definition of P G
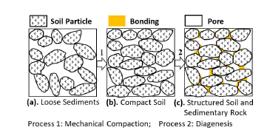
Loose sediments turn into structured soil and sedimentary rock by mechanical compaction and different degrees of diagenesis, which includes cementation, metasomatism, crystallization, leaching, hydration, etc. (Figure 2). Therefore, the apparent preconsolidation pressure of structured sediment is the confined compressive yield stress of the initial structure formed not only by mechanical compaction but also by diagenesis. Yield stress occurs in both soil and structured sediments. To differentiate from the traditional P C, we introduce a generalized P C (P G), which is valid for both soil and sedimentary soft rock. P G is the yield stress of the initial sediment structure under lateral confined compression, and can be obtained through confined compression experiments. For non-diagenetic soil, P G is equal to the traditional P C, which is in turn equal to the historical maximum effective vertical stress (σ’zmax).
Hong & Tsuchida (1999Hong, Z., & Tsuchida, T. (1999). On Compression Characteristics of Ariake Clays. Canadian Geotechnical Journal, 36, 807-814.) showed that the yield stress of structured soil is influenced by the greatest vertical effective stress to which the soil has been subjected and the strength of the solidified bond generated by physical and chemical factors in the soil deposition process. Similarly, Nygard et al. (2004Nygard, R., Gutierrez, M., Gautam, R., & Høeg, K. (2004). Compaction Behavior of Argillaceous Sediments as Function of Diagenesis. Marine & Petroleum Geology, 21, 349-362.) noted that the apparent preconsolidation pressure of sedimentary rock is proportional to the historical maximum effective vertical stress and the strength of bonding. Additionally, based on distinct element method (DEM) simulation results, Jiang et al. (2007Jiang, M.J., Yu, H.S., & Leroueil, S. (2007). A Simple and Efficient Approach to Capturing Bonding Effect in Naturally Microstructured Sands by Discrete Element Method. International Journal for Numerical Methods in Engineering, 69, 1158-1193.) deduced that the strength of the initial structure increases with the strength of bonding. Thus, the strength due to diagenesis can be expressed as:
where D is the set of diagenetic factors, x i is the diagenetic factor like sedimentary environment, mechanism, age, and parent rock, etc.
2.3 The diagenetic effect on P G
The parameter σ’zmax is deduced from geological exploration data. The strength due to diagenesis ψ(D) (Eq. 4) must be further studied to determine the diagenetic effect on P G. To facilitate this analysis, we used the non-dimensional parameter ψ(D)/P a , where P a is the standard atmospheric pressure. Using geological exploration data obtained from the samples and oedometer tests, we obtained ψ(D)/P a for 24 sediment types (Table 1). The relationship between ψ(D)/P a and diagenetic time t, which is the time since deposition, is plotted in Figure 3.
where is the natural soil gravity of sampling depth; is the natural soil gravity of surface sampling [if is not measured, the value can be adopted as 17 kN/m3]; is obtained from Eq. 2; and h w = 0 m if it is not measured.
†Because of geological tectonic movement, the rock formation is now on the surface. The effect of diagenesis on P G was much greater than that of mechanical compression over a long period of deposition (Nygard et al. 2006Nygard, R., Gutierrez, M., Bratli, R.K., & Høeg, K. (2006). Brittle-ductile Transition, Shear Failure and Leakage in Shales and Mudrocks. Marine & Petroleum Geology, 23, 201-212.). That is,
The strength due to diagenesis is approximated as:

The relationship between diagenetic time and strength due to diagenesis. * Diagenetic time t is the intermediate value of the rock sample geological age range.
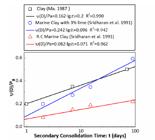
The trend line in Figure 3 indicates that ψ(D)/P a is positively correlated with diagenetic time. When the vertical effective stress remains constant, the soil particles slowly slide and roll, resulting in a denser and more stable soil skeleton. Due to the rich asperities and mineral debris on the particle surfaces, time-dependent deformation occurs at grain contacts under a constant load (Michalowski et al. 2018Michalowski, R.L., Wang, Z., & Nadukuru, S.S. (2018). Maturing of Contacts and Ageing of Silica Sand. Géotechnique, 68, 133-145.). Many studies have confirmed the influence of the secondary consolidation effect on P G. Ma (1987Ma, S.D. (1987). On the Stress-strain-strength Characteristics of Quasi-overconsolidated Clay. Chinese Journal of Geotechnical Engineering, 9, 53-60. (In Chinese).) and Sridharan et al. (1991Sridharan, A., Abraham, B.M., & Jose, B.T. (1991). Improved Technique for Estimation of Preconsolidation Pressure. Geotechnique, 41, 263-268.) conducted oedometer tests with different durations of a given consolidation pressure of σ’zmax. The relationship between ψ(D)/P a and duration are plotted in Figure 4. Over short periods of time, ψ(D)/P a was linearly related to the logarithmic duration. That is, P G increased with the secondary consolidation time, while the growth rate decreased with time. The long-term compression deformation diagram drawn by Bjerrum (1967Bjerrum L. (1967). Engineering Geology of Norwegian Normally-consolidated Marine Clays as Related to Settlements of Buildings. Géotechnique, 17, 81-118.) also showed that P G was positively correlated with duration.
As shown in Figure 3, ψ(D)/P a of Guiyang red clay is significantly higher than that of other sediments formed in the same period, and P G decreases with depth. This special phenomenon is related to the red clay parent rock and the special sedimentary environment. Guizhou Province, China, is the most typical Subtropical Karst area in the world. The formation of red clay must go through karst and cementation. After the carbonate minerals in the parent rock are dissolved, the deposits of SiO2, Al2O3, and Fe2O3 remain. With the alternating wet and dry climate, the residual deposits begin to form cementation of free oxide with high strength, and the amount decreases with the increase of soil depth (Liao et al. 2006Liao, Y.L., Bi, Q.T., Xi, X.W., & Zhao, K. (2006). On Preconsolidation Pressure of Red Clay. Rock & Soil Mechanic, 27, 1391-1394. (In Chinese).). Therefore, P G decreases with increased burial depth. Due to the strong weathering effect, the ψ(D)/P a of Nanning expansive mudstone is lower than that of other sediments formed in the same period. Thus, the weathering effect reduces the value of P G.
3 EXPERIMENT OF THE BRITTLE-DUCTILE TRANSITION PRESSURE AND GENERALIZED PRECONSOLIDATION PRESSURE IN SEDIMENTARY SOFT ROCK
3.1 Experimental sample
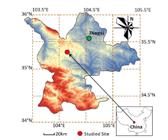
The sedimentary soft rock used in this study was obtained from Humaling tunnel, Dingxi City, China (Figure 5), at an approximate embedded depth of 218-220 m; the geological and hydrogeological conditions at the sampling site are shown in Figure 6. Table 2 provides the mineralogical composition of the red-bed soft rock, a type of argillaceous claystone formed in the Pliocene N2 period, obtained using the X-ray diffraction method. The weight content of a given mineral phase is quantitatively related to its X-ray diffraction intensity in the multiple-component mixture. The physical and mechanical parameters of the experimental material are listed in Table 3.
According to the geological exploration data, the sample is in a horizontal layer wherein compaction is vertical and one-dimensional, with few lateral tectonic stresses and no large geological formation movement or uplift erosion. To simulate the actual conditions, the sample was maintained perpendicular to the deposition direction. The BDT pressure test was conducted using a standard cylindrical sample, 50 mm in diameter and 100 mm in height. Because scale effects are insignificant at high confining pressure (Gutierrez et al. 1996Gutierrez, M., Berre, T., Høeg, K., & Nagel, N. (1996). Laboratory Testing and Modelling of Scale Effects in Chalk. Proceedings of the Fifth North Sea Chalk Symposium, Reims, France, October 7-9, 1996, Paper no. X-4.), the minimum diameter and height of the sample used in the test determined P G were 30.4 mm and 40 mm, respectively. To guarantee the sample standard, samples must be finely machined on a lathe. To make the sample cling perfectly to the oedometer cell, samples used in compression tests must be made with great care. Each sample was selected based on comparison with the average longitudinal wave velocity of samples before testing, and samples with high dispersion were removed.

3.2 BDT pressure measurement
BDT pressure was obtained through triaxial tests performed using a mechanics testing system (MTS) with a frame stiffness of 11.0 × 10⁹ N/m, maximum axial force of 4600 kN, maximum confining pressure of 150 MPa, and strain rate of 10−7 to 10−2 s−1. The first isotropic loading was applied to the designed confining pressure followed by axial loading with an axial strain rate of 0.001 s-1. Triaxial tests were carried out on three natural water-containing samples with confining pressures of 0, 2, 4, 5, 6, 8, 16, and 32 MPa. As the confining pressure increased, Dingxi red-bed soft rock underwent a transition in failure mode, from localized brittle fracture to diffused damage and ductile failure. According to the brittle and ductile characteristics of the stress-strain relationship (Nygard et al. 2006Nygard, R., Gutierrez, M., Bratli, R.K., & Høeg, K. (2006). Brittle-ductile Transition, Shear Failure and Leakage in Shales and Mudrocks. Marine & Petroleum Geology, 23, 201-212.; Ishii et al. 2011Ishii, E., Sanada, H., Funaki, H., Sugita, Y., & Kurikami, H. (2011). The Relationships Among Brittleness, Deformation Behavior, and Transport Properties in Mudstones: An Example from the Horonobe Underground Research Laboratory, Japan. Journal of Geophysical Research Solid Earth, 116, 206-221.; Wong & Baud 2012Wong, T.F., & Baud, P. (2012). The Brittle-ductile Transition in Porous Rock: A Review. Journal of Structural Geology, 44, 25-53.), the failure modes of the Dingxi samples were divided into brittle, semi-brittle, and ductile modes. To analyze conveniently, we stipulated the strain is positive when the strain direction is consistent with the loading direction. The test results are shown in Figure 7, where σ1 is axial stress, and σ3 is confining pressure; typical photographs of deformed samples are shown in Figure 8. Due to the long-term historical deposition, the rock sample shows inhomogeneous behavior, and the experiment results are inevitably discrete. To avoid the inaccurate analysis, the higher discrete test results of samples S16 and S20 with confining pressures of 16 and 32 MPa were omitted from the analysis. Samples in brittle mode were assigned to the brittle zone and those in semi-brittle and ductile modes were assigned to the ductile zone (Evans et al. 1990Evans, B., Fredrich, J.T., & Wong, T.F. (1990). The Brittle-ductile Transition in Rocks: Recent Experimental and Theoretical Progress. Geophysical Monograph Series, 56, 1-20.; Nygard et al. 2006; Ishii et al. 2011). Thus, the BDT pressure of Dingxi soft rock was found to be 4-5 MPa, which corresponds to the boundary between the brittle and ductile zones.

Stress-strain curves and axial strain-volumetric strain curves of red-bed soft rock observed in triaxial tests.

For the brittle mode, the shear surface is irregular, and the rock obviously has a peak shear strength. After the strength reaches the peak value, the stress rapidly declines to the residual strength and becomes stable, and then the stress-strain relationship shows typical softening. Since the generated macro-cracks, sample volume increased, which will trigger dilatant characteristics. For the semi-brittle mode, the shear surface is flat, and the specimen has a slight peak strength. After reaching the peak value, part of the stress-strain relationship softens, while other parts exhibit stress-strain hardening, and the samples show shear dilatant characteristics. For the ductile mode, the samples show typical stress-strain hardening behavior and have no shear surface. Some of the samples exhibit shear dilatancy, and others show shear shrinkage.
3.3 P G measurement
PC measurements included step-loading confined compression (SL-K 0) and constant strain rate confined compression (CSR-K 0). Jarad et al. (2019Jarad, N., Cuisinier, O., & Masrouri, F. (2019). Effect of Temperature and Strain Rate on the Consolidation Behaviour of Compacted Clayey Soils. European Journal of Environmental & Civil Engineering, 23, 789-806.) found that the compression curve shifts to the right as the strain rate of the CSR-K 0 test increases, resulting in an increase in P C. In this paper, the SL-K 0 compression test was used to eliminate the influence of strain rate on the test results.
In this study, we used a custom oedometer container with a consolidation pressure of 0.2-16.5 MPa (Figure 9). To reduce the influence of friction between the sample and the inner wall of the container on the test results, Vaseline should be smeared on the sides of the samples and the inner wall of the ring before the sample is placed in the confining ring. Two samples, BG-01 and BG-02, with depths of 220 m and 218 m, respectively, were tested. Because the swelling indexes of different samples are very close, the unloading and re-loading tests were only conducted on sample BG-01. Table 4 shows the designed additional stress values, the loading paths of samples BG-01 and BG-02, were Grade 1→10→4→10 and Grade 1→10, respectively, and each load was applied every 24 hours. The compression curves are plotted in Figure 10. Sedimentary rocks have rather low compressibility due to their low porosity. The initial void ratio e 0 of Dingxi soft rock is 0.196-0.217, the compression index C C is 0.033, and the swelling index C S is 0.0046. The compressibility of Dingxi soft rock is lower than those of KBC shale (C C: 0.060, e 0: 0.28) and Valhall shale (C C: 0.041, e 0: 0.32) and higher than that of North Sea shale (C C: 0.010-0.027, e 0: 0.21-0.29) (Nygard et al. 2004Nygard, R., Gutierrez, M., Gautam, R., & Høeg, K. (2004). Compaction Behavior of Argillaceous Sediments as Function of Diagenesis. Marine & Petroleum Geology, 21, 349-362.).
A previous study applied the Casagrande numerical mapping method to obtain P G values of 4.68 and 4.53 MPa for Dingxi soft rock samples BG-01 and BG-02, respectively (Lv et al. 2020Lv, L.L., Liao, H.J., Song, L., Fu, Y.P., & Musanyufu, J.N. (2020). Determination of the Red Bed Soft Rock’s Apparent Preconsolidation Pressure. Japanese Geotechnical Society Special Publication, 8, 497-502.). The value of P G is close to that of BDT pressure, the same experimental results were also shown in previous studies (Nygard et al. 2004Nygard, R., Gutierrez, M., Gautam, R., & Høeg, K. (2004). Compaction Behavior of Argillaceous Sediments as Function of Diagenesis. Marine & Petroleum Geology, 21, 349-362.; 2006; Gutierrez et al. 2008Gutierrez, M., Nygard, R., Høeg, K., & Berre, T. (2008). Normalized Undrained Shear Strength of Clay Shales. Engineering Geology, 99, 31-39.). According to the geological exploration data, the maximum vertical stresses of BG-01 and BG-02 were 3.12 MPa and 3.09 MPa, respectively. The strength due to diagenesis of BG-01 and BG-02 were calculated as 1.56 and 1.44 MPa, respectively, using Eq. 4.
In the same area, the samples with deeper burial have a longer deposition time, so the cementation between the particles in sample BG-01 is stronger than that of BG-02. Furthermore, the σ’zmax of BG-01 is larger than that of BG-02, which leads to a denser and more stable state in sample BG-01, thus the initial void ratio e 0 of BG-01 is smaller than that of BG-02. Due to its stronger initial structure, the vertical deformation of sample BG-01 is smaller than that of BG-02. With the increase of vertical pressure, the effect of initial structure decreased gradually, therefore the end of the compression curves of two samples are parallel to each other.


4 DISCUSSIONS
4.1 BDT mechanism
Because the soft rock examined in this study is a mixture of mineral particles, cement, and pores, its stress-strain curve is divided into five regions: (I) initial crack closure, (II) elastic deformation, (III) plastic deformation, (IV) softening deformation, and (V) residual deformation. The four boundary points between these five regions correspond to four characteristic stresses: closure stress (), initial yield stress (), peak stress (), and residual stress (). The typical brittle and ductile stress-strain curves of Dingxi soft rock are shown in Figure 11, and the characteristic stresses and elastic modulus (E av) of each rock sample are listed in Table 5.
These results show that exists only in samples with a confining pressure of 0 MPa. The initial cracks have closed with the increase of confining pressure σ3 before axial loading began. When σ3 ≥ 5 MPa, the elastic deformation region was difficult to find on the stress-strain curve; thus, the rock sample had entered region (III) at the beginning of the shear stage. E av increased somewhat consistent with σ3 but with a clear downward trend in the transition zone. The similar results were also shown in Bentheim sandstone (Wong et al. 1997Wong, T.F., David, C., & Zhu, W. (1997). The Transition from Brittle Faulting to Cataclastic Flow in Porous Sandstones: Mechanical Deformation. Journal of Geophysical Research: Solid Earth, 102, 3009-3025.) and Tave limestone (Vajdova et al. 2004Vajdova, V., Baud, P., & Wong, T.F. (2004). Compaction, Dilatancy and Failure in Porous Carbonate Rocks. Journal of Geophysical Research Atmospheres, 109 (B05), 1-16.).

In principle stress space, Mohr-Coulomb failure criterion can be expressed as follows:
where K is the gradient of the σ1-σ3 strength curve (Figure 12), P is the intercept of the curve, c is the cohesion, and is the friction angle.
We simulated the peak stress of Dingxi soft rock using Eq. 6, and obtained a satisfactory result (Figure 12). The strength parameters were then obtained by combining Eqs. 7 and 8. In the brittle zone, c was 2.194 MPa and was 28.7°, whereas in the ductile zone, c was 7.033 MPa and was 7.11°. The strength parameters differed greatly between the brittle and ductile zones, consistent with the findings of previous studies (Singh et al. 2011Singh, M., Raj, A., & Singh, B. (2011). Modified Mohr-Coulomb Criterion for Non-linear Triaxial and Polyaxial Strength of Intact Rocks. International Journal of Rock Mechanics & Mining Sciences, 48, 546-555.; You 2011You, M.Q. (2011). Comparison of the Accuracy of Some Conventional Triaxial Strength Criteria for Intact Rock. International Journal of Rock Mechanics & Mining Sciences, 48, 852-863.), the reason will be discussed later.

When σ3 < 5 MPa (i.e., in the brittle zone), the samples became denser, and deformation resistance became stronger as confining pressure increased. Thus, E av of the sample increased with σ3. The initial soft rock fabric remained unchanged, with the sample remaining in the elastic deformation region at the beginning of the shear stage. As the deviatoric stress σ 1 - σ 3 increased to , micro-cracks appeared in the sample. Under such conditions, confining pressure has a weak effect on crack development, with micro-cracks rapidly expanding to macro-cracks, followed by brittle failure. The stress-strain relationship shows softening due to the lost cohesion and reduced strength. Shear dilatancy appears when the failure occurs with the macro-cracks generated.
When σ3 ≥ 5 MPa (i.e., in the ductile zone), the sample entered the plastic deformation stage under isotropic compression; thus, bonds between particles were broken, altering the initial soft rock fabric. Compared with the initial structure, there was no bonding between the particles in the re-formed dense structure, resulting in weak deformation resistance. Thus, Eav of the samples showed a downward trend in the transition zone. Due to the mineral powder produced from broken bonds, the particles became smooth, and friction angles in the ductile zone became smaller than those in the brittle zone. In the isotropic compression stage, particles in the ductile zone underwent a long period of position adjustment, leading to denser and more stable particle fabric, and thus increasing cohesion. Therefore, there was less cohesion in the brittle zone than in the ductile zone. In semi-brittle mode, confining pressure has an inhibitory effect on crack development; thus, micro-cracks slowly expanded to macro-cracks, and semi-brittle failure occurred. Due to the simultaneous occurrence of strain hardening caused by particle movement and strain softening caused by structural damage, some soft rock samples exhibited stress-strain hardening, whereas others exhibited softening. Macro-cracks caused samples to exhibit dilatancy. In ductile mode, after confining pressure was applied, the initial structure was completely destroyed, and particle movement increased the sample density to such an extent that shear failure could not occur. The stress-strain relationship exhibited hardening, and the sample exhibited ductility due to compaction among particles. At lower confining pressure (i.e., σ3 = 16 MPa), the soft rock particles were densely arranged, and shrinkage occurred. When σ3 = 32 MPa, the re-formed fabric produced more micro-cracks under high confining pressure, and the samples were dilatant.
Consequently, the root cause of failure mode differences among samples is that the initial rock fabric remains unchanged at the beginning of the shear stage in the brittle zone, whereas bonds between particles break and the initial rock fabric changes during the isotropic compression stage in the ductile zone.
4.2 Relationship between BDT pressure and PG
As described above, we carefully deduced that the BDT pressure (PBDT) may be the confining pressure at the intersection between the initial yield surface and the p-axis, and PG may be the maximum principal stress point on the initial yield surface due to the confined compression (K0) loading path. The horizontal ordinates of the two characteristic stress points are p0 (i.e., isotropic consolidation pressure) and pPG, respectively (Figure 13). In the conventional triaxial (CT) test, the mean stress p and deviatoric stress q are calculated as follows:
Thus, we can obtain:
where K 0 is the coefficient of earth pressure at rest.


In p-q stress space, the K 0 loading path and shear stage of the CT loading path are expressed as follows:
The cap model can be used to simulate the initial yield surface of porous sandstones (Baud et al. 2006Baud, P., Vajdova, V., & Wong, T.F. (2006). Shear-enhanced Compaction and Strain Localization: Inelastic Deformation and Constitutive Modeling of Four Porous Sandstones. Journal of Geophysical Research: Solid Earth, 111 (B12), 1-17.). Thus, a cap model of initial yield surface considered structural strength of soft rock is introduced (Suebsuk et al. 2010Suebsuk, J., Horpibulsuk, S., & Liu, M.D. (2010). Modified Structured Cam Clay: a generalised critical state model for destructured, naturally structured and artificially structured clays. Computers and Geotechnics, 37, 956-968.):
where p s is the initial structural strength, M is the gradient of the critical state line, and in the CT test, . We simulated the initial yield stress points of Dingxi soft rock using Eq. 15, and obtained a satisfactory fitting result (R2 = 0.9588; Figure 14); the fitting value of p0 and ps were 4.617 MPa and 4.665 MPa, respectively. The value of BDT pressure from theoretical analysis was 4.617 MPa, which corresponded well to the experimental value 4-5 MPa.
To investigate the relationship between PBDT and PG, we must first define the relationship between pPG and p0. pPG is the horizontal ordinate of the intersection of the K0 loading path on the initial yield surface, so we combined Eqs. 13 and 15, got the following equation:
Then, substituting Eqs. 11 and 12 into Eq. 16, we obtained:
Moreover, substituting Eq. 4 into Eq. 17, we can also obtain the relationship among the BDT pressure and diagenetic parameter:
where
From Eqs. 19 and 20, we determined that parameters A, B depend on the material strength parameters and the coefficient of earth pressure at rest K 0. Thus, the relationship between the BDT pressure and P G of a sedimentary soft rock depends on its strength parameters, the initial structural strength, and the coefficient of earth pressure at rest.
5 CONCLUSION
In this study, we analyzed the P C of soft rock and defined a generalized preconsolidation pressure (P G ) for both soil and sedimentary soft rock, which is a more versatile parameter than P C. We explored the relationship between P G and BDT pressure by conducting experiments on Dingxi red-bed soft rock. We then drew several conclusions based on the established database and correlation studies, as follows:
(1) P G represents the yield stress of the initial sediment structure under lateral confined compression, which can be obtained through confined compression experiments. The initial structure of the structured sediment is formed by mechanical compaction and diagenesis, whereas soil structure is formed only through mechanical compaction.
(2) The elastic modulus of the samples showed a downward trend in the translation zone, with a smaller friction angle in the ductile zone than in the brittle zone, leading to less cohesion in the brittle zone.
(3) The initial rock fabric remained unchanged at the beginning of the shear stage in the brittle zone; bonds between particles were broken and the initial rock fabric changed during the isotropic compression stage in the ductile zone. And the BDT pressure equals to the isotropic consolidation pressure.
(4) The relationship between the BDT pressure and P G of a sedimentary soft rock depends on its strength parameters, the initial structural strength, and the coefficient of earth pressure at rest.
ANKNOWLEDGEMENT
The authors thank National Natural Science Foundation of China (NO. 51879212, 41630639) and the key research and development program of Shaanxi (2019SF-231, 2019KWZ-09) for their financial support.
References
- Akai, K., Adachi, T., & Tabushi, N. (1974). Mechanical Properties of Soft Rock in Terms of Effective Stress. Journal of the Society of Materials Science Japan, 23, 368-373.
- Baud, P., Vajdova, V., & Wong, T.F. (2006). Shear-enhanced Compaction and Strain Localization: Inelastic Deformation and Constitutive Modeling of Four Porous Sandstones. Journal of Geophysical Research: Solid Earth, 111 (B12), 1-17.
- Bjerrum L. (1967). Engineering Geology of Norwegian Normally-consolidated Marine Clays as Related to Settlements of Buildings. Géotechnique, 17, 81-118.
- Boone, S.J. (2010). A Critical Reappraisal of “Preconsolidation Pressure” Interpretations Using the Oedometer Test. Canadian Geotechnical Journal, 47, 281-296.
- Casagrande, A. (1936). The Determination of the Preconsolidation Load and Its Practical Significance. In Proceedings of the 1st International Conference on Soil Mechanics and Foundation Engineering, Cambridge, Mass. Vol. 3, pp. 60-64.
- Cotecchia, F., & Chandler, R.J. (1997). The Influence of Structure on the Pre-failure Behaviour of a Natural Clay. Géotechnique, 47, 523-544.
- Demers, D., & Leroueil, S. (2002). Evaluation of Preconsolidation Pressure and the Overconsolidation Ratio from Piezocone Tests of Clay Deposits in Quebec. Canadian Geotechnical Journal, 39, 174-192.
- Evans, B., Fredrich, J.T., & Wong, T.F. (1990). The Brittle-ductile Transition in Rocks: Recent Experimental and Theoretical Progress. Geophysical Monograph Series, 56, 1-20.
- Gui, Y., Yu, Z.H., Liu, M.H., Cao, J., & Wang, Z.C. (2015). Secondary Consolidation Properties and Mechanism of Plateau Lacustrine Peaty Soil. Chinese Journal of Geotechnical Engineering, 37, 1390-1398. (In Chinese).
- Gutierrez, M., Berre, T., Høeg, K., & Nagel, N. (1996). Laboratory Testing and Modelling of Scale Effects in Chalk. Proceedings of the Fifth North Sea Chalk Symposium, Reims, France, October 7-9, 1996, Paper no. X-4.
- Gutierrez, M., Nygard, R., Høeg, K., & Berre, T. (2008). Normalized Undrained Shear Strength of Clay Shales. Engineering Geology, 99, 31-39.
- Hong, Z., & Tsuchida, T. (1999). On Compression Characteristics of Ariake Clays. Canadian Geotechnical Journal, 36, 807-814.
- Hu, D., Zhang, H., Ni, K., & Yu, G. (2014). Preservation Conditions for Marine Shale Gas at the Southeastern Margin of the Sichuan Basin and Their Controlling Factors. Natural Gas Industry B, 1, 178-184.
- Ishii, E., Sanada, H., Funaki, H., Sugita, Y., & Kurikami, H. (2011). The Relationships Among Brittleness, Deformation Behavior, and Transport Properties in Mudstones: An Example from the Horonobe Underground Research Laboratory, Japan. Journal of Geophysical Research Solid Earth, 116, 206-221.
- Jarad, N., Cuisinier, O., & Masrouri, F. (2019). Effect of Temperature and Strain Rate on the Consolidation Behaviour of Compacted Clayey Soils. European Journal of Environmental & Civil Engineering, 23, 789-806.
- Jiang, M.J., Yu, H.S., & Leroueil, S. (2007). A Simple and Efficient Approach to Capturing Bonding Effect in Naturally Microstructured Sands by Discrete Element Method. International Journal for Numerical Methods in Engineering, 69, 1158-1193.
- Liao, Y.L., Bi, Q.T., Xi, X.W., & Zhao, K. (2006). On Preconsolidation Pressure of Red Clay. Rock & Soil Mechanic, 27, 1391-1394. (In Chinese).
- Liu, J.X., Xiao, F., Liu, W., Gan, J.J., Huo, L. & Mao, H.J. (2018). Investigation on the Experimental Determination of the Apparent Preconsolidation Stress and Effective-sealing Condition for Clay Cap Rock. Arabian Journal of Geosciences, 11, 491-506.
- Lv, L.L., Liao, H.J., Song, L., Fu, Y.P., & Musanyufu, J.N. (2020). Determination of the Red Bed Soft Rock’s Apparent Preconsolidation Pressure. Japanese Geotechnical Society Special Publication, 8, 497-502.
- Ma, B., Muhunthan, B., & Xie, X. (2014). Mechanisms of Quasi-preconsolidation Stress Development in Clays: A Rheological Model. Soils & Foundations, 54, 439-450.
- Ma, S.D. (1987). On the Stress-strain-strength Characteristics of Quasi-overconsolidated Clay. Chinese Journal of Geotechnical Engineering, 9, 53-60. (In Chinese).
- Mu, Q.Y., Zhou, C., & Ng, C.W.W. (2020). Compression and Wetting Induced Volumetric Behavior of Loess: Micro- and Macro-investigations. Transportation Geotechnics, 23(100345), 1-8.
- Michalowski, R.L., Wang, Z., & Nadukuru, S.S. (2018). Maturing of Contacts and Ageing of Silica Sand. Géotechnique, 68, 133-145.
- Nygard, R., Gutierrez, M., Gautam, R., & Høeg, K. (2004). Compaction Behavior of Argillaceous Sediments as Function of Diagenesis. Marine & Petroleum Geology, 21, 349-362.
- Nygard, R., Gutierrez, M., Bratli, R.K., & Høeg, K. (2006). Brittle-ductile Transition, Shear Failure and Leakage in Shales and Mudrocks. Marine & Petroleum Geology, 23, 201-212.
- Pavel, K. (2011). Preconsolidation, Structural Strength of Soil, and its Effect on Subsoil Upper Structure Interaction. Engineering Structures, 33, 1195-1204.
- Powell, J.S., Siemens, G., Take, W.A., & Remenda, V. (2012). Influence of Specimen Geometry on Sample Disturbance Observed in Oedometric Testing of Clay Shales. Geotechnical Testing Journal, 35, 771-783.
- Rutter, E.H. (1986). On the Nomenclature of Mode of Failure Transitions in Rocks. Tectonophysics, 122, 381-387.
- Singh, M., Raj, A., & Singh, B. (2011). Modified Mohr-Coulomb Criterion for Non-linear Triaxial and Polyaxial Strength of Intact Rocks. International Journal of Rock Mechanics & Mining Sciences, 48, 546-555.
- Smith, L., Barbour, S.L., Hendry, M.J., & Elwood, D. (2017). Profiling the in Situ Compressibility of Cretaceous Shale Using Grouted-in Piezometers and Laboratory Testing. Geomechanics for Energy & the Environment, 14, 29-37.
- Sridharan, A., Abraham, B.M., & Jose, B.T. (1991). Improved Technique for Estimation of Preconsolidation Pressure. Geotechnique, 41, 263-268.
- Suebsuk, J., Horpibulsuk, S., & Liu, M.D. (2010). Modified Structured Cam Clay: a generalised critical state model for destructured, naturally structured and artificially structured clays. Computers and Geotechnics, 37, 956-968.
- Tavenas, F., Blanchet, R., Garneau, R., & Leroueil, S. (1978). The Stability of Stage-constructed Embankments on Soft Clays. Canadian Geotechnical Journal, 15, 283-305.
- Tuo, Y.F., Kong, L.W., Guo, A.G., & Tan, L.R. (2004). Occurrence and Engineering Properties of Structural Soft Clay in Zhanjiang Area. Rock & Soil Mechanics, 25, 1879-1884. (In Chinese).
- Umar, M., & Sadrekarimi, A. (2017). Accuracy of Determining Pre-consolidation Pressure from Laboratory Tests. Canadian Geotechnical Journal, 54, 441-450.
- Vajdova, V., Baud, P., & Wong, T.F. (2004). Compaction, Dilatancy and Failure in Porous Carbonate Rocks. Journal of Geophysical Research Atmospheres, 109 (B05), 1-16.
- Walton, G., Hedayat, A., Kim, E., & Labrie, D. (2017). Post-yield Strength and Dilatancy Evolution Across the Brittle-ductile Transition in Indiana Limestone. Rock Mechanics & Rock Engineering, 50, 1691-1710.
- Wei, D.D., & Hu, Z.X. (1980). Experimental Study of Preconsolidation Pressure and Compressibility Parameters of Shanghai Subsoil. Chinese Journal of Geotechnical Engineering, 2, 13-22. (In Chinese).
- Wong, T.F., David, C., & Zhu, W. (1997). The Transition from Brittle Faulting to Cataclastic Flow in Porous Sandstones: Mechanical Deformation. Journal of Geophysical Research: Solid Earth, 102, 3009-3025.
- Wong, T.F., & Baud, P. (2012). The Brittle-ductile Transition in Porous Rock: A Review. Journal of Structural Geology, 44, 25-53.
- Yang, Y.L., & Andrew, A.C. (1998). Influence of Lithology and Compaction on the Pore Size Distribution and Modelled Permeability of Some Mudstones from the Norwegian Margin. Marine & Petroleum Geology, 15, 163-175.
- You, M.Q. (2011). Comparison of the Accuracy of Some Conventional Triaxial Strength Criteria for Intact Rock. International Journal of Rock Mechanics & Mining Sciences, 48, 852-863.
- Yuan, Y.S., Jin, Z.J., Zhou, Y., Liu, J.X., Li, S.J., & Liu, Q.Y. (2017). Burial Depth Interval of the Shale Brittle-ductile Transition Zone and Its Implications in Shale Gas Exploration and Production. Petroleum Science, 14, 637-647.
Edited by
Editor:
Publication Dates
-
Publication in this collection
28 May 2021 -
Date of issue
2021
History
-
Received
02 Dec 2020 -
Reviewed
01 Mar 2021 -
Accepted
29 Mar 2021 -
Published
31 Mar 2021


 * For clarity, the x-axis is not drawn to scale.

