
Abstracts
Exact expressions for the wavelengths where maxima occur in the spectral distribution curves of blackbody radiation for a number of diferent dispersion rules are given in terms of the Lambert W function. These dispersion rule dependent "Wien peaks" are compared to those wavelengths obtained in a setting independent of the dispersion rule chosen where the "peak" wavelengths are taken to be those obtained on dividing the total radiation intensity emitted from a blackbody into a given percentile. The account provides a simple yet accessible example of the growing applicability of the Lambert W function in physics.
blackbody radiation; Wien peaks; Lambert W function; polylogarithm
São apresentadas em termos das funções W de Lambert as expressões exatas para os comprimentos de onda para os quais ocorrem máximos das curvas espectrais do corpo negro para algumas diferentes regras de dispersão. Estes "picos de Wien", dependentes da regra de dispersão, são comparados àqueles obtido independentes desta regra, onde os comprimentos de onda de "pico" são obtidos dividindo-se a intensidade de radiação total emitida por um corpo negro em um dado percentil. Isto fornece um exemplo simples e acessível da crescente aplicabilidade das funções W de Lambert.
radiação de corpo negro; picos de Wien; função W de Lambert; polylogarithm
ARTIGOS GERAIS
Wien peaks and the Lambert W function
Picos de Wien e a função W de Lambert
Seán M. Stewart1 1 E-mail: sstewart@pi.ac.ae.
Department of Mathematics, The Petroleum Institute, Abu Dhabi, United Arab Emirates
ABSTRACT
Exact expressions for the wavelengths where maxima occur in the spectral distribution curves of blackbody radiation for a number of diferent dispersion rules are given in terms of the Lambert W function. These dispersion rule dependent "Wien peaks" are compared to those wavelengths obtained in a setting independent of the dispersion rule chosen where the "peak" wavelengths are taken to be those obtained on dividing the total radiation intensity emitted from a blackbody into a given percentile. The account provides a simple yet accessible example of the growing applicability of the Lambert W function in physics.
Keywords: blackbody radiation, Wien peaks, Lambert W function, polylogarithm.
RESUMO
São apresentadas em termos das funções W de Lambert as expressões exatas para os comprimentos de onda para os quais ocorrem máximos das curvas espectrais do corpo negro para algumas diferentes regras de dispersão. Estes "picos de Wien", dependentes da regra de dispersão, são comparados àqueles obtido independentes desta regra, onde os comprimentos de onda de "pico" são obtidos dividindo-se a intensidade de radiação total emitida por um corpo negro em um dado percentil. Isto fornece um exemplo simples e acessível da crescente aplicabilidade das funções W de Lambert.
Palavras-chave: radiação de corpo negro, picos de Wien, função W de Lambert, polylogarithm.
1. Introduction
In the analysis of the spectral distribution of blackbody radiation, the wavelengths λmax where maxima in Plancks spectral distribution law BD(T) occur have, and continue to remain, of particular interest [113]. As is well known [14], such maxima occur at different wavelengths depending on the type of dispersion rule, D, chosen. Such a choice, however, is completely arbitrary and lay in it usefulness [10]. Such arbitrariness in the choice of dispersion rule becomes apparent when one recognises that the Planck function BD(T) is a density distribution function which is defined differentially by

So regardless of the particular dispersion rule chosen, all possible BD(T) still represent the same physical blackbody radiation spectrum. Eq. (1) makes it clear that BD(T) is differential in nature. Plancks function BD(T) therefore gives the intensity of the emitted radiation (power emitted per unit area) per unit physical quantity interval Dfrom a blackbody at absolute temperature Tand not the intensity of the emitted radiation as a function of the physical quantity D.
In this paper we consider eight common dispersion rules and show how the maxima in the continuous spectra for each can be expressed in closed form in terms of the recently defined Lambert W function [15, 16]. The eight dispersion rules we consider are summarized in Table 1. In naming each of the respective maximawe follow that given in Ref. [10]. Here, the peak in the spectrum resulting from the linear wavelength dispersion rule has historically been referred to as Wien's displacement lawwhile all other peaks in the spectra resulting from any other type of dispersion rule are simply referred to as a Wien peak.
Since dWDrepresents the power in the differential interval dD, each of the different representations for dWDin Table 1 must correspond to each other since the powers must be equal. This should come as no surprise since what we are dealing with here is simple energy conservation. If we recall that the total intensity I(power per unit area) emitted from a blackbody at temperature Tis obtained by integrating dWDover its entire range this becomes apparent since it gives the familiar StefanBoltzmann law

Here the constant σ is the StefanBoltzmann constant while the integration of the solid angle Ω is taken over the half-sphere.2
It should be noted that moving from a frequency representation λ to a wavelength representation λ, or vice versa, is not simply a matter of substituting v= c=λinto Plancks function.3 Instead, since the Planck function is a density distribution function which is defined differentially, it is the differential dv= c=λ2dλwhich needs to be substituted when moving between the two representations. Here the minus sign can be ignored since it is an artifact resulting from the direction of integration taken in Eq. (2) [4].
On finding the dispersion rule dependent Wien peaks, we compare these to what can be thought of as a peak wavelength obtained in a setting independent of the dispersion rule chosen. Here such a "peak" is taken to be the wavelength obtained on dividing the total radiation intensity Iemitted by a blackbody at a given temperature into a given percentile. The corresponding dispersion rule giving each of these so-called percentile peakscan then be found on matching the percentile and Wien peak wavelengths.
The purpose of the present paper is two-fold. Firstly, we wish to raise awareness of the growing importance of the Lambert W function in the field of physics. Many authors continue to remain unaware that all the Wien peaks resulting from any arbitrary dispersion rule can be written in closed form in terms of the now familiar Lambert W function, despite a recent publication of a closed-form expression for Wiens displacement constant bin Wiens displacement law λmaxT= b[18].4 Secondly, while many examples from physics where the Lambert W function arises have now been found (see, e.g., Refs. [18,2034]), the problem of determining closed-form expressions for the Wien peaks provides what is undoubtedly the simplest illustration of the use of this function in physics.
2. Exact analytic expressions for the Wien peaks
Starting out with the well-known expression for the Planck function in the linear wavelength spectral representation, namely

all other spectral distribution functions in any other equivalent representation can be found. The fundamental constants h, c, and kBare Plancks constant, the speed of light in a vacuum, and Boltzmanns constant respectively. The positions of maxima in the spectral distribution functions for blackbody radiation give the so-called Wien peaks. These are obtained by taking the derivative of BD with respect to either the wavelength (in the wavelength representation) or the frequency (in the frequency representation) and equating the result to zero. When this is done, regardless of the spectral representation one is working in, the following equation results

Here m > 1 and depends on the dispersion rule chosen (see Table 2). Setting u= hc=(kBλT) and rearranging algebraically, Eq. (3) reduces to the more compact transcendental equation

The solution to the above transcendental equation can be expressed in closed form in terms of the Lambert W function.
The Lambert W function, denoted by W(z), is defined to be the inverse of the function f(z) = zezsatisfying

Referred to as the defining equationfor the Lambert W function, Eq. (5) has infinitely many solutions (most of which are complex) and is therefore multivalued. If its argument is real, Eq. (5) can have either one unique positive real root W0(x) if x >0 except for W0(0) = 0; two negative real roots W0(x) and W1(x) if 1=e < x <0; one negative real root W0(1=e) = W1(1=e) = 1 if x = 1=e; and no real roots if x < 1=e. By convention, the branch satisfying W(x) > -1 is taken to be the principal branchand is denoted by W0(x) while the branch satisfying W(x) > -1 is known as the secondary real branchand is denoted by W1(x).
Returning to the problem of determining the Wien peaks, as Eq. (4) is exactly in the form of the defining equation for the Lambert W function, it can be solved in terms of this function. For the non-trivial5 solution we have

Closed-form expressions for the wavelengths of the Wien peaks in terms of the Lambert W function immediately follow. They are given by

In the case of Wiens displacement law, Wiens displacement constant bwas first expressed in closed form in terms of the Lambert W function in [18]. It corresponds to the m= 5 (linear wavelength spectral representation) case in Eq. (7). Table 2 contains a summary of results for the Wien peaks for all eight dispersion rules considered in this paper. Note the Wien peak in both the logarithmic frequency and wavelength spectral representations are equal and as such is often referred to as the wavelength frequency neutral peak.
In addition to the elegance which an explicit expression for the Wien peaks provides, the availability of analyticity facilitates further analysis due to its new gained mathematical convenience. It is instructive to plot λmaxTas a function of the dispersion rule parameter m, as described by Eq. (7). In Fig. 1 we plot the dimensionless quantity λmaxT=(hc=kB) as a function of m. The figure shows the expected shifting in the peak wavelength λmax in the Planck function from shorter wavelengths in any of the wavelength representations (m <4) to longer wavelengths in the frequency representations (1 < m <4). The cut-off point which is seen to occur at m= 1 indicates that any frequency representation at or above that of a frequency-cubed no longer contains a peak in its spectral distribution function. No physical significance however should be attached to this cut-off point. It just tells us that the Planck function will no longer be a singly peaked function if a dispersion rule in the frequency representation at or above that of a frequency-cubed is chosen. Physically, the total intensity Iemitted from a blackbody at a given temperature Tmust remain unchanged, regardless of the particular dispersion rule chosen, this being a consequence of the StefanBoltzmann law.
3. Dispersion rule independent percentile peaks
Which Wien peak one uses depends on the application one has in mind. The conventional choice is the peak given by Wiens displacement law as found within the linear wavelength spectral representation. Often it is however more convenient to define a wavelength that can be thought of as a "peak" of sorts, yet is independent of the dispersion rule chosen. Here such a peak is taken as the wavelength (or frequency) that divides the total radiation intensity into a certain percentile  , where 0 < < 1. As alluded to in the introduction we refer to these wavelengths as the percentile peaksand will denote them by . For example, in the often used mediancase, = 0:5 and the percentile peak is the wavelength that divides the total radiation intensity into two equal halves. Once the percentile peak is found it in turn can be used to determine the type of dispersion rule Plancks spectral distribution law would correspond to. Here matching the percentile peak wavelength to an equivalent Wien peak allows such a determination to be made.
The peak wavelength that divides the total radiation intensity into a certain percentile is found on solving

As Eq. (8) is independent of the spectral representation chosen, in the linear wavelength representation one has

Using the change of variable u= hc=(kBλT), setting α = hc=(kλbpT), and noting that the StefanBoltzmann constant σ is given by 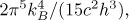 Eq. (9) reduces to ∫

The integral appearing in Eq. (10) is evaluated in the appendix. The result is

where Lis(x) is the polylogarithm function [35]. For a given , Eq. (11) must be solved numerically to find α. Once α is known the percentile peak wavelength follows and is given by T = hc=(kBα).
The percentile peak wavelengths can be related back to a Planck function corresponding to a particular dispersion rule by matching the peak wavelength for a given percentile to the Wien peak. Doing so allows one to associate a given percentile to an equivalent dispersion rule. From Eq. (4), as u= α is the solution we seek, solving for the dispersion rule parameter myields m= αeα=(eα 1). The equivalent dispersion rule can now be found as follows. In the frequency representation we set 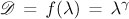 so that
  Similarly, in the wavelength representation we set D= f(v) = vbso that In each case, substituting for
  into Eq. (2) and solving for the peak wavelength leads to an equation of the form given by Eq. (7) with the dispersion rule parameter mgiven by

As an example, for the median percentile case (p= 0:5), on solving Eq. (11) numerically one finds α= 3.503 018 ...which gives m= 3.611 755 .... Since m <4, the median percentile case falls on the frequency representation side of the wavelengthfrequency neutral peak divide and thus can be represented by a frequency dispersion rule D= vβwith index β = 0.388 244 . . ..The case for other percentiles and the associated dispersion rule each corresponds to are summarized in Table 3.
Finally, from Eq. (11), it is also possible to find the percentile pcorresponding to each of the various Wien peaks. For the eight dispersion rules considered here, they are summarized in Table 4. Note that while it is possible to express each percentile appearing in Table 4 in exact form in terms of polylogarithms and the Lambert W function, for brevity we give each value for pin decimal form.
4. Conclusion
We have shown how the Wien peaks in the spectral distribution curves of blackbody radiation for a number of common dispersion rules can be expressed in closed form in terms of the recently defined Lambert W function. The dispersion rule dependent Wien peaks were then compared to the so-called percentile peaks, a dispersion rule independent peak wavelength of sorts, obtained as that which divides the total radiation intensity emitted from a blackbody into a given percentile. Associating an equivalent percentile to each Wien peak for the eight different dispersion rules considered was then made.
The Lambert W function has recently emerged as one of the important special functions of mathematical physics. By bringing the function to the attention of a wider audience through an accessible example, as was provided here, we hope one will be sufficiently convinced of the usefulness of such a function to warrant its adoption and further use in physics. Here recognition and familiarity are important if any function is to be put to greater use. While we recognise mathematical functions in themselves are not expected to uncover any new physics, as was seen here, those who choose to work with such a function benefit from having access to an existing body of mathematical knowledge. The continued usefulness of such a function is therefore expected to lay in helping to elucidate the physics involved in a particular problem, which in the past, may have otherwise proved difficult to extract.
Recebido em 17/2/2011; Aceito em 29/6/2011; Publicado em 7/10/2011
Appendix
In this appendix we evaluate the integral appearing in Eq. (10). Consider the slightly more general case of

Here n > 0 while physically α is positive. If Eq. (13) is rewritten as

recognising the term 1=(1 ex) as the sum of the convergent geometric series  , on shifting the summation index and interchanging the order of the integration and summation, the integral becomes

With the change of variable u= kxthe integral appearing in Eq. (15) can be written in terms of the upper incomplete gamma function 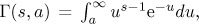 , namely

When nis an integer the upper incomplete gamma function can be evaluated explicitly in terms of standard elementary functions using integration by parts. For the case of n= 3 we have

The polylogarithm function Lis(x) is defined as

Here we restrict our attention to order indices swhich are real. On combining Eq. (17) with Eq. (16) the four resulting infinite sums are nothing more than the polylogarithm Lis(e-α ) of orders 1 through to 4. The result appearing in Eq. (11) then follows. Note the polylogarithm is also known as Jonquiére's functionand can be thought of as a generalisation of the logarithm since when s= 1

- [1] P.K. Jain, Phys. Educ. 26, 190 (1991).
- [2] P.K. Pain, Phys. Educ. 31, 149 (1996).
- [3] D. Lawson, Phys. Educ. 32, 321 (1997).
- [4] B.H. Sofer and D.K. Lynch, Am. J. Phys. 67, 946 (1999).
- [5] P.S. Guimarães, Revista Brasileira de Ensino de Física 21, 291 (1999).
- [6] B. Das, Phys. Teach. 40, 148 (2002).
- [7] M.L. Biermann, D.M. Katz, R. Aho, J. Diaz-Barriga, and J. Petron, Phys. Teach. 40, 398 (2002).
- [8] J.M. Overduin, Am. J. Phys. 71, 216 (2003).
- [9] G. Nunes, Am. J. Phys. 71, 519 (2003).
- [10] M.A. Heald, Am. J. Phys. 71, 1322 (2003).
- [11] P. Pesic, Am. J. Phys. 73, 457 (2005).
- [12] M.A. Cavalcante e R. Haag, Revista Brasileira de Ensino de Física 27, 343 (2005).
- [13] T.R. Cardoso e A.S. de Castro, Revista Brasileira de Ensino de Física 27, 559 (2005).
- [14] B.W. Carroll and D.A. Ostlie, An Introduction to Modern Astrophysics (Addison-Wesley, San Francisco, 2007), 2nd ed., p. 73.
- [15] R.M. Corless, G.H. Gonnet, D.E.G. Hare, D.J. Jefrey and D.E. Knuth, Adv. Comput. Math. 5, 329 (1996).
- [16] P.B. Brito, F. Fabião and A. Staubyn, Math. Scientist 33, 127 (2008).
- [17] W.K. Widger, Jr., Bull. Am. Meteorol. Soc. 49, 724 (1968).
- [18] S.R. Valluri, D.J. Jefrey and R.M. Corless, Canad. J. Phys. 78, 823 (2000).
- [19] R. Luck and J.W. Stevens, SIAM Rev. 44, 227 (2002).
- [20] T.C. Scott, J.F. Babb, A. Dalgarno and J.D. Morgan III, J. Chem. Phys. 99, 2841 (1993).
- [21] R.B. Mann and T. Ohta, Phys. Rev. D 55, 4723 (1997).
- [22] H. Rehn, J. Mod. Opt. 45, 2197 (1998).
- [23] B.A. Magradze, Int. J. Mod. Phys. A 15, 2715 (2000).
- [24] D.C. Jenn, IEEE Antennas Propag. Mag. 44, 139 (2002).
- [25] J.-M. Caillol, J. Phys. A: Math. Gen. 36, 10431 (2003).
- [26] S.R. Cranmer, Am. J. Phys. 72, 1397 (2004).
- [27] R.D.H. Warburton and J. Wang, Am. J. Phys. 72, 1404 (2004).
- [28] E.W. Packel and D.S. Yuen, College Math. J. 35, 337 (2004).
- [29] D.A. Morales, Canad. J. Phys. 83, 67 (2005).
- [30] B.W. Williams, Phys. Lett. A 334, 117 (2005).
- [31] S.M. Stewart, Int. J. Math. Educ. Sci. Technol. 37, 411 (2006).
- [32] S.R. Valluri, M. Gil, D.J. Jefrey and S. Basu, J. Math. Phys. 50, 102103 (2009).
- [33] H. Hernández-Saldaña, Eur. J. Phys. 31, 1319 (2010).
- [34] S.M. Stewart, Eur. J. Phys. 32, L7 (2011).
- [35] L. Lewin, Polylogarithms and Associated Functions (North Holland, New York, 1981), p. 189.
Publication Dates
-
Publication in this collection
01 Nov 2011 -
Date of issue
Sept 2011
History
-
Accepted
07 Oct 2011 -
Reviewed
29 June 2011 -
Received
17 Feb 2011


