Abstracts
Precision agriculture that is based on the physical and chemical properties of soil requires a dense sampling to evaluate spatial variability in the field. This dense sampling is often expensive and time consuming. One technique to reduce the number of samples is to define management zones based on information that is collected in the field. Some researchers have demonstrated the importance of the electrical properties of soil in defining management zones. Thus, the objective of this study was to evaluate the relationship between the apparent soil electrical conductivity and soil properties in mountainous areas of coffee production. The electrical conductivity of soil was evaluated at soil depths ranging from 0.00-0.20 m (EC20) and 0.00-0.40 m (EC40) using a portable meter. The mean values of EC20 and EC40 were 1.80 mS m-1 and 1.22 mS m-1, respectively. Both EC20 and EC40 exhibited comparatively low correlations with the soil properties, whereas higher correlations were obtained for measurements of remaining phosphorus, wherein values of 0.427 and 0.465, respectively, were obtained.
precision agriculture; management zone; sensors
A agricultura de precisão baseada nas propriedades físicas e químicas do solo exige uma amostragem densa para se determinar a variabilidade espacial no campo. Essa amostragem densa, muitas vezes apresenta custo e tempo consumido elevado. Uma das técnicas para reduzir o número de amostras é definir zonas de manejo em função de informações coletadas no campo. Alguns pesquisadores têm demonstrado a importância desempenhada pelas variáveis elétricas do solo para definir zonas de manejo. Dessa forma, este trabalho teve como objetivo avaliar a relação entre a variabilidade espacial da condutividade elétrica aparente e propriedades do solo em regiões de produção de cafés de montanha. A condutividade elétrica foi medida no perfil de solo de 0,00-0,20 m (CE20) e 0,00-0,40 m (CE40) usando um sensor portátil. Os valores de CE20 e CE40 foram de 1,80 mS m-1 e 1,22 mS m-1, respectivamente. Ambas CE20 e CE40 apresentaram baixa correlação com as propriedades químicas e a textura do solo, sendo que, a correlação mais elevada foi obtida para o fósforo remanescente com valores de 0,427 e 0,465, respectivamente.
agricultura de precisão; zonas de manejo; sensores
ARTIGO CIENTÍFICO
The relationship between apparent soil electrical conductivity and soil properties
Relação entre condutividade elétrica aparente e propriedades do solo
Domingos Sárvio Magalhães ValenteI,* * Autor para correspondência ; Daniel Marçal de QueirozI; Francisco de Assis de Carvalho PintoI; Nerilson Terra SantosII; Fábio Lúcio SantosI
IDepartamento de Engenharia Agrícola/UFV, Campus UFV, Viçosa-MG, Brazil, 36.570-000, valente@ufv.br, queiroz@ufv.br, facpinto@ufv.br, fabio.ls@ufv.br
IIDepartamento de Estatística/UFV, Campus UFV, Viçosa-MG, Brazil, 36.570-000, nsantos@ufv.br
ABSTRACT
Precision agriculture that is based on the physical and chemical properties of soil requires a dense sampling to evaluate spatial variability in the field. This dense sampling is often expensive and time consuming. One technique to reduce the number of samples is to define management zones based on information that is collected in the field. Some researchers have demonstrated the importance of the electrical properties of soil in defining management zones. Thus, the objective of this study was to evaluate the relationship between the apparent soil electrical conductivity and soil properties in mountainous areas of coffee production. The electrical conductivity of soil was evaluated at soil depths ranging from 0.00-0.20 m (EC20) and 0.00-0.40 m (EC40) using a portable meter. The mean values of EC20 and EC40 were 1.80 mS m-1 and 1.22 mS m-1, respectively. Both EC20 and EC40 exhibited comparatively low correlations with the soil properties, whereas higher correlations were obtained for measurements of remaining phosphorus, wherein values of 0.427 and 0.465, respectively, were obtained.
Key words: precision agriculture. management zone. sensors.
RESUMO
A agricultura de precisão baseada nas propriedades físicas e químicas do solo exige uma amostragem densa para se determinar a variabilidade espacial no campo. Essa amostragem densa, muitas vezes apresenta custo e tempo consumido elevado. Uma das técnicas para reduzir o número de amostras é definir zonas de manejo em função de informações coletadas no campo. Alguns pesquisadores têm demonstrado a importância desempenhada pelas variáveis elétricas do solo para definir zonas de manejo. Dessa forma, este trabalho teve como objetivo avaliar a relação entre a variabilidade espacial da condutividade elétrica aparente e propriedades do solo em regiões de produção de cafés de montanha. A condutividade elétrica foi medida no perfil de solo de 0,00-0,20 m (CE20) e 0,00-0,40 m (CE40) usando um sensor portátil. Os valores de CE20 e CE40 foram de 1,80 mS m-1 e 1,22 mS m-1, respectivamente. Ambas CE20 e CE40 apresentaram baixa correlação com as propriedades químicas e a textura do solo, sendo que, a correlação mais elevada foi obtida para o fósforo remanescente com valores de 0,427 e 0,465, respectivamente.
Palavras-chave: agricultura de precisão. zonas de manejo. sensores.
INTRODUCTION
Coffee production in different countries has been transformed into a specialized field. Consumers demand a high quality product, and coffee producers are looking for ways to reduce costs and add value to their product through production systems that provide special attributes to their coffee. Precision agriculture is a technique that may be used to attain these goals. By practicing precision agriculture, it is possible to identify areas that will give higher yields and that have the potential to produce higher quality coffee. Precision agriculture can also be used to optimize the use of inputs in the production system and make business more profitable.
The use of precision agriculture that is based on the chemical and the physical properties of the soil requires a dense sampling to determine spatial variability in the field (SILVA et al., 2010). A decreased density of sampling can lead to errors in estimating the spatial variability of soil nutrients and, consequently, errors in recommendation.
One technique for reducing the number of samples is to define management zones (MORAL et al., 2010; XIN-ZHONG et al., 2009). The field information frequently used for defining management zones is based on a digital elevation model, maps of soil fertility that have been generated from systematic sampling in the field and yield maps that have been obtained for more than one season. Recently, some researchers (CORWIN; LESCH, 2003; CORWIN et al., 2003; CORWIN; LESCH, 2005a; CORWIN; LESCH, 2005b; CORWIN et al., 2006; LESCH et al., 2005; MORARI et al., 2009; SAEY et al., 2009; YAN et al., 2007a; YAN et al., 2007b; YAN et al., 2007c; YAN et al., 2008) have demonstrated that soil electrical parameters in the field can be used to explain variability in the physical and chemical properties of the soil. Additionally, these parameters are reliable and easy to measure. Thus, the objective of this research was to evaluate the relationship between the apparent soil electrical conductivity and soil properties in a coffee production system that is located in a mountainous area.
MATERIAL AND METHODS
The data for apparent soil electrical conductivity were measured on a farm located in Araponga (20º42'33" S, 42º34'17" W, average altitude of 913 m a.s.l.), Minas Gerais, Brazil . This farm has an area of 86 hectares and is planted with the Coffea arabica L. species. The average altitude is 904 m, the area is predominantly mountainous, and the soil is classified as Typic Hapludox (SOIL SURVEY STAFF, 2006). According to the Brazilian soil classification the soil is classified as Latossolo Vermelho Amarelo.
The resistivity method was used to measure the apparent soil electrical conductivity. In this method, four equally spaced electrodes are placed in contact with the soil surface. An electric current is applied between the two external electrodes and the electrical potential difference is measured in the inner electrodes, as shown in Figura 1. This configuration is commonly referred to as the Matrix Wenner configuration (CORWIN; HEDRICKX, 2002; CORWIN; LESCH, 2003).
A portable sensor, model ERM-02, manufactured by Landviser, was used to characterize the apparent soil electrical conductivity by the resistivity method. Two electrode spacing configurations were used: one with 0.20 m (EC20) spacing and another with 0.40 m (EC40) spacing.
The apparent soil electrical conductivity and the soil properties were determined in a 20.20-ha area. The EC20 and EC40 were measured at 141 points in the experimental area. The soil was sampled in the canopy projection of culture and depth of 0-0.20 meters in an irregular mesh with 141 points (SILVA et al., 2010). Soil samples were collected at each point in order to determine the soil texture and chemical properties. At each sampling point, three single samples were collected in a radius of 1 m around the point where the EC20 and EC40 were measured. Soil samples were analyzed in order to obtain the soil texture composition (clay, silt, and sand), electrical conductivity in the extract of soil to water ratio (1:5), moisture, and soil fertility (pH; potential acidity; P, K, Ca2+, Mg2+, Al3+, and H-Al levels; sum of basis; effective cation exchange capacity (CEC t); cation exchange capacity at pH 7 (CEC T); basis saturation; aluminum saturation; remaining phosphorous; and Zn, Fe, Mn, Cu, and organic matter). The relationship between the apparent electrical conductivity and the soil properties was determined by calculating the Pearson's correlation coefficient. In order to complement the characterization of the soil, a water retention curve was determined using the Extractor Richards method (RICHARDS, 1965). For this test, 15 out of 141 sampling points were randomly selected to perform the measurements.
As can be observed in Figura 2, each sampling point was georeferenced using a DGPS Promark 3, which was manufactured by Magellan. For differential correction, data from the Brazilian Network for Continuous Monitoring (RBMC) were used. GNSS solution software (developed by Magellan) was used to process the data.
RESULTS AND DISCUSSION
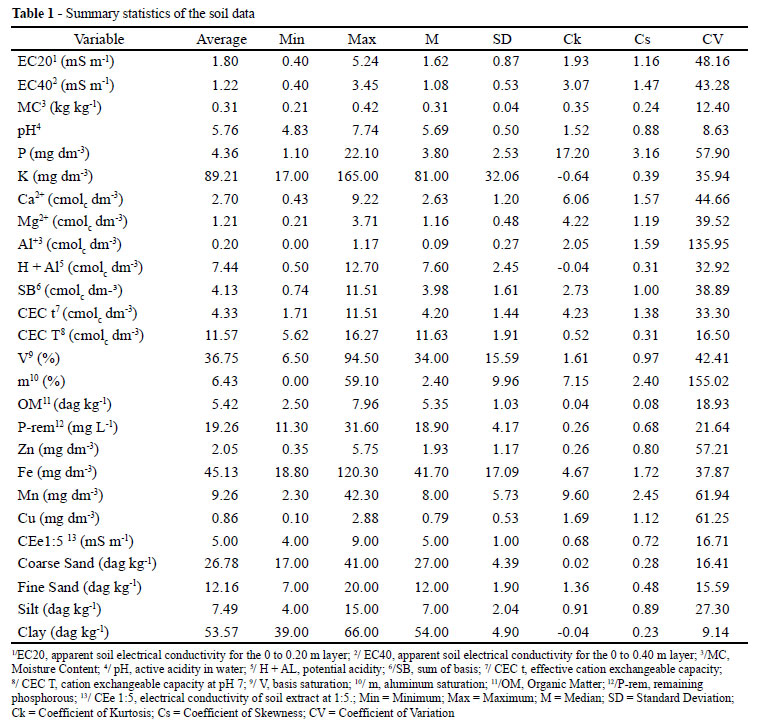
The results of the descriptive statistics for EC20, EC40, and the some soil properties are shown in Table 1. Therein, it can be observed that the EC20 exhibited a coefficient of variation that was greater than that for EC40, which indicates a greater variability in EC20 values due to variations in soil properties near the surface.
The average values of EC20 and EC40 were 1.80 and 1.22 mS m-1, respectively. These values are relatively low when compared to the apparent electrical conductivity of saline soils at 135.7 and 86.18 mS m-1, as shown by Yan et al. (2007c) and Yan et al. (2008). In non-saline soils, Machado et al. (2006) and Aimrun et al. (2007) have obtained average apparent soil electrical conductivity values of 5.2 and 5.67 mS m-1, respectively. These mean values of electrical conductivity are still higher than those found in this study. However, much lower than the values determined in saline soils.
Despite the low values of electrical conductivity, the average apparent soil electrical conductivity values were well within the range of the electrical conductivity of soil extract (1:5) that were determined in the laboratory, which confirm the results from other studies (CORWIN; LESCH, 2003; CORWIN; LESCH, 2005b; MORAL et al., 2010; YAN et al., 2007c). These observed low values may have resulted from a low cation exchange capacity of the soil, as reported by Corwin and Lesch (2005b). The cation exchange capacity of soil is related to the amount and type of clay and organic matter content in the soil. Although the soil has high clay content, probably, the clay itself has a low quality. Moreover, as shown in Table 1, the measured soil has a low organic matter content, which influences reflects a low cation exchange capacity and, consequently, low electrical conductivity.
The minimum and maximum values of conductivity were 0.40 and 5.24 mS m-1, respectively. This amplitude is less than that obtained by Machado et al. (2006), who recorded minimum and maximum conductivities of 1.90 and 13.70 mS m-1, respectively. Aimrun et al. (2007) obtained minimum and the maximum values of 0.90 and 64.10 mS m-1, whereas Faulin and Molin (2006) obtained values of apparent soil electrical conductivity ranging from 0.60 to 16,6 mS m-1. These differences in amplitude may not relate to soil moisture conditions. As shown in Table 2, for the 15 water retention curves that were obtained in this study, it was found that the soil during the electrical conductivity measurements was at or near field capacity. Thus, the amplitude of variation was low, probably due to the low cation exchange capacity, as shown in Table 1.
The ranking of the Pearson's correlation coefficients between EC20, EC40, and the soil properties are presented in Table 3. The results in Table 3 indicate that EC20 and EC40 strongly correlate to each other (0.896), which agree with result obtained by Vitharana et al. (2008) in a similar study. EC40 exhibited higher correlation coefficients with most soil properties in comparison to EC20. This may be due to major changes in the physical and the chemical characteristics that occur near the soil's surface, which increase the oscillation of EC20 and reduce the coefficient of correlation.
In general, EC20 and EC40 had low correlations with soil properties. The highest correlation coefficients for EC20 and EC40 were found for remaining phosphorus, which had values of 0.427 and 0.465, respectively. Moreover, EC20 and EC40 did not show significant correlations with the physical properties of soil, except for the silt content.
The recommended phosphorus dosage for crops can be obtained as a function of the remaining phosphorus and the clay content. In soils that have been classified as Typic Hapludox (SOIL SURVEY STAFF, 2006), higher clay and oxide contents correlate with lower remaining phosphorus contents due to a higher phosphorous adsorption capacity of the soil. If silt and sand were exclusively composed of primary minerals, soil with a high content of these two types of particles would be expected to have a low phosphorous adsorption capacity (DONOGEMMA et al., 2008); however, Typic Hapludox soils have silt-sized microaggregates that are formed by the cementing action of Fe and Al3+ oxides. Thus, the apparent soil electrical conductivity becomes an alternative for the estimation of the available phosphorus.
Several authors (LESCH et al., 2005; MACHADO et al., 2006; MOLIN; CASTRO, 2008) have shown strong correlations between the soil electrical conductivity and the clay content, whereas others (AIMRUN et al., 2007; CARROLL; OLIVER, 2005; CORWIN; LESCH, 2005b; CAMBOURIS et al., 2006; CORWIN et al., 2006; MORARI et al., 2009) have not found any such correlations. The results of this study indicate that the correlation between apparent soil electrical conductivity and clay content was either low or absent. The observed low correlation coefficient may be due to the low coefficient of variation of the clay content. Although electrical conductivity did not exhibit any correlation with the clay content, its correlation with the remaining phosphorus was related to variability in physical-chemical, mineralogical, and soil texture characteristics (EBERHARDT et al., 2008; SILVA et al., 2010; SOUZA et al., 2006).
The soil moisture content was not correlated with the apparent soil electrical conductivity, which is probably due to the low coefficient of variation for soil moisture. While studying the influence of soil moisture on the apparent soil electrical conductivity, Faulin and Molin (2006) concluded that when the amplitudes of variation in clay and moisture content were high, higher correlation coefficients between electrical conductivity with soil moisture and clay content were found. The authors worked in two different areas for two consecutive years and obtained coefficients of variation for moisture content that ranged from 7.30 to 30.51% and for clay content that ranged from 15.86 to 42.47%, respectively. The coefficients of variation for the clay and soil moisture content that were obtained in the present study are also considered to be low, with values of 9.14 and 12.40%, respectively. These findings explain why there was no relationship between the moisture content and the soil electrical conductivity.
CONCLUSIONS
1. The average values of apparent soil electrical conductivity were low compared to values observed for saline soils and soils with high values of cation exchange capacity;
2. The apparent soil electrical conductivity using electrode distances of 0.00 to 0.20 m and 0.00 to 0.40 m exhibited strongly correlate to each other;
3. The highest correlation coefficient was found between the apparent soil electrical conductivity and the remaining phosphorus;
4. There was no significant correlation between the apparent soil electrical conductivity and the clay content;
5. The soil moisture content was not correlated with the apparent soil electrical conductivity.
ACKNOWLEDGMENTS
The authors thank CNPq (The Brazilian National Counsel for Research and Development), FAPEMIG (The Minas Gerais State Foundation for Research), and Brauna Farm and CENTREINAR (the Brazilian National Center for Training in the Post-Harvest Area) for their support.
Recebido para publicação em 02/08/2011; aprovado em 01/05/2012
Parte da Tese de Doutorado do primeiro autor apresentada ao Programa de Pós-Graduação em Engenharia Agrícola da Universidade Federal de Viçosa
- AIMRUN, W. et al. Spatial variability of bulk soil electrical conductivity in a Malaysian paddy field: key to soil management. Paddy Water Environ, v. 05, n. 02, p. 113-121, 2007.
- BEKELE, A. et al Scale dependent variability of soil electrical conductivity by indirect measures of soil properties. Journal of Terramechanics, v. 42, n. 03/04, p. 339-351, 2005.
- CAMBOURIS, A. N. et al Soil management zones delineated by electrical conductivity to characterize spatial and temporal variations in potato yield and in soil properties. American Journal of Potato Research, v. 83, n. 05, p. 381-395, 2006.
- CAROLL, Z. L.; OLIVER, M. A. Exploring the spatial relations between soil physical properties and apparent electrical conductivity. Geoderma, v. 128, n. 03/04, p. 354-374, 2005.
- CORWIN, D. L. et al Identifying soil properties that influence cotton yield using soil sampling directed by apparent soil electrical conductivity. Agronomy Journal, v. 95, n. 02, p. 352-364, 2003.
- CORWIN, D. L. et al Monitoring management-induced spatio-temporal changes in soil quality through soil sampling directed by apparent electrical conductivity. Geoderma, v. 131, n. 03/04, p. 369-387, 2006.
- CORWIN, D. L.; HENDRICKX, J. M. H. Electrical resistivity: Wenner array. In: SILVA, J. S. Methods of soil analysis part 4 physical methods. Madison, Wisconsin, USA: Soil Sience society of America, 2002. p. 1282-1287.
- CORWIN, D. L.; LESCH, S. M. Characterizing soil spatial variability with apparent soil electrical conductivity part II. Case study. Computer and Electronics in Agriculture, v. 46, n. 01/03, p. 135-152, 2005b.
- CORWIN, D. L.; LESH, S. M. Apparent soil electrical conductivity measurements in agricultural. Computers and Electronics in Agriculture, v. 46, n. 01/03, p. 11-43, 2005a.
- CORWIN, D. L.; S. M. LESCH. Application of soil electrical conductivity to precision agriculture: theory, principles, and guidelines. Agronomy Journal, v. 95, n. 03, p. 471-471, 2003.
- DONAGEMMA, G. K. et al Solution equilibrium phosphorus in clay and silt fractions of oxisols after particle size analysis pre-treatments. Revista Brasileira de Ciência do Solo, v. 32, n. 04, p. 1785-1791, 2008.
- EBERHARDT, D. N. et al Influence of soil texture and mineralogy on phosphorus retention in cerrado oxisols under pasture. Revista Brasileira de Ciência do Solo, v. 32, n. 03, p. 1009-1016, 2008.
- FAULIN, G. D. C.; MOLIN, J. P. Amplitude dos valores da umidade e sua influência na mensuração da condutividade elétrica do solo. In: CONGRESSO BRASILEIRO DE AGRICULTURA DE PRECISÃO. 2006. São Pedro, SP. Resumos... São Pedro, SP, 2006.
- LESCH, S. M. et al Apparent soil electrical conductivity mapping as an agricultural management tool in arid zone soils. Computer and Electronics in Agriculture, v. 46, n. 01/03, p. 351-378, 2005.
- MACHADO, P. L. O. A. et al Electrical conductivity mapping in relation to clay of a Ferralsol under no tillage system. Pesquisa Agropecuária Brasileira, v. 41, n. 06, p. 1023-1031, 2006.
- MOLIN, J. P.; CASTRO, C. N. Establishing management zones using soil electrical conductivity and other soil properties by the fuzzy clustering technique. Scientia Agricola, v. 65, n. 06, p. 567-573, 2008.
- MORAL, F. J. et al Delineation of management zones using mobile measurements of soil apparent electrical conductivity and multivariate geostatistical techniques. Soil & Tillage Research, v. 106, n. 02, p. 335-343, 2010.
- MORARI, F. et al Application of multivariate geostatistics in delineating management zones within a gravelly vineyard using geo-electrical sensors. Computers and Electronics in Agriculture, v. 68, n. 01, p. 97-107, 2009.
- RICHARDS, L. Physical conditions of water in water retentivity of soil at specific volume of matrix suction. In: BLACK, C.; ESMINGER, L. E. Methods of soil analysis Madison: American Society of Agronomy, 1965. p. 131-137.
- SAEY, T. et al A Pedotransfer function to evaluate the soil profile textural heterogeneity using proximally sensed apparent electrical conductivity. Geoderma, v. 150, n. 03/04, p. 389-395, 2009.
- SILVA, S. A. et al Variabilidade espacial do fósforo e das frações granulométricas de um Latossolo Vermelho Amarelo. Revista Ciência Agronômica, v. 41, n. 01, p. 01-08, 2010.
- SOUZA, R. F. et al Liming and organic fertilizer: influence on phosphorus adsorption in soils. Revista Brasileira de Ciência do Solo, v. 30, n. 06, p. 975-983, 2006.
- SOIL SURVEY STAFF. Keys to Soil Taxonomy. 10ed. USDA/NCRS, Washington, D. C., USA, 2006.
- VITHARANA, U. W. A. et al Key soil and topographic properties to delineate potential management classes for precision agriculture in the European loess area. Geoderma, v. 143, n. 01/02, p. 206-215, 2008.
- XIN-ZHONG, W. et al Determination of management zones for a tobacco field based on soil fertility. Computers and Electronics in Agriculture, v. 65, n. 02, p. 168-175, 2009.
- YAN, L. et al Delineation of site-specific management zones using fuzzy clustering analysis in a coastal saline land. Computers and Electronics in Agriculture, v. 56, n. 02, p. 174-186, 2007c.
- YAN, L. et al Determination of potential management zones from soil electrical conductivity, yield and crop data. Journal of Zhejiang University Science B, v. 09, n. 01, p. 68-76, 2008.
- YAN, L. et al Optimized spatial sampling scheme for soil electrical conductivity based on variance quad-tree (VQT) method. Agricultural Sciences in China, v. 06, n. 12, p. 1463-1471, 2007b.
- YAN, L. et al. Delineation of site-specific management zones based on temporal and spatial variability of soil electrical conductivity. Pedosphere, v. 17, n. 02, p. 156-164, 2007a.
Publication Dates
-
Publication in this collection
25 June 2012 -
Date of issue
Dec 2012
History
-
Received
02 Aug 2011 -
Accepted
01 May 2012